. 2023 Jul 19;14(1):4325.
doi: 10.1038/s41467-023-39736-3.

Estimating long-term vaccine effectiveness against SARS-CoV-2 variants: a model-based approach

Affiliations

Estimating long-term vaccine effectiveness against SARS-CoV-2 variants: a model-based approach

Alexandra B Hogan et al. Nat Commun. .

Abstract

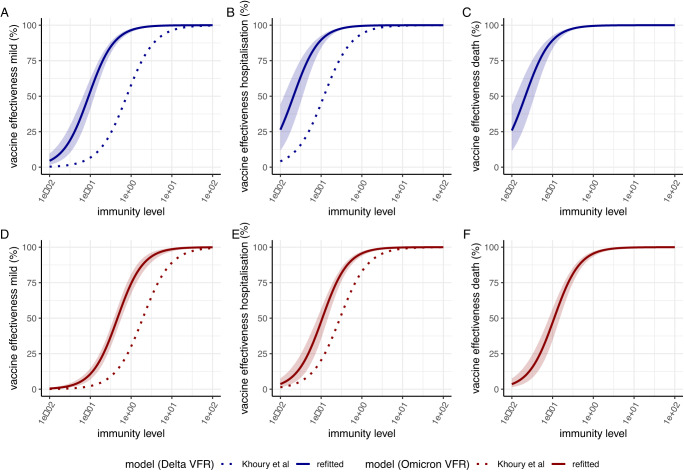
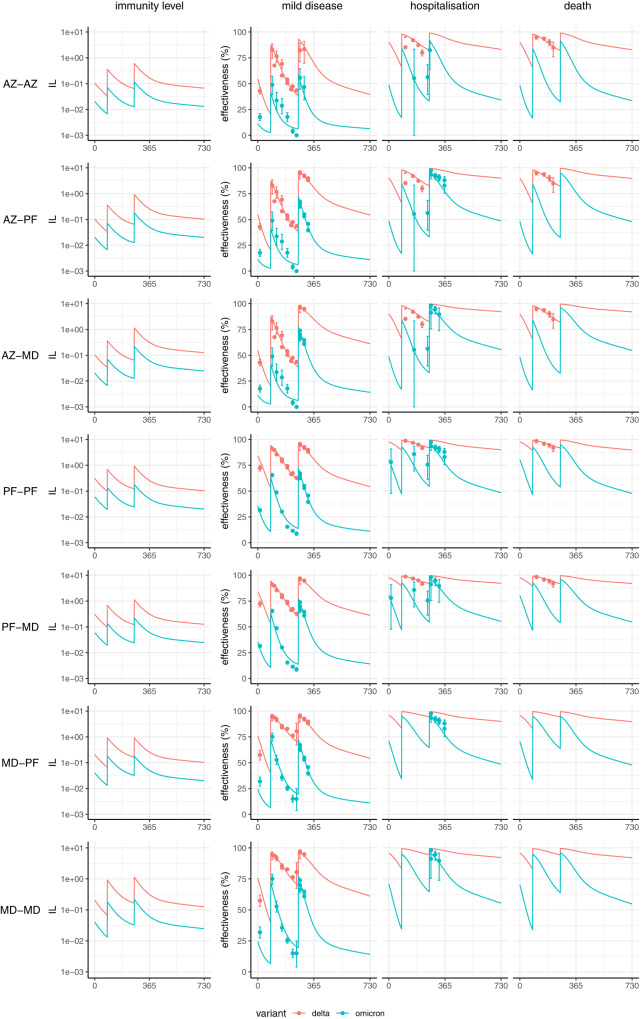
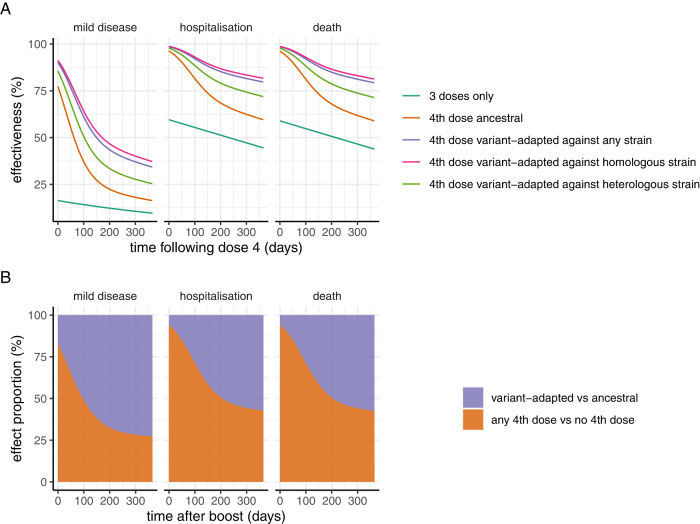
With the ongoing evolution of the SARS-CoV-2 virus updated vaccines may be needed. We fitted a model linking immunity levels and protection to vaccine effectiveness data from England for three vaccines (Oxford/AstraZeneca AZD1222, Pfizer-BioNTech BNT162b2, Moderna mRNA-1273) and two variants (Delta, Omicron). Our model reproduces the observed sustained protection against hospitalisation and death from the Omicron variant over the first six months following dose 3 with the ancestral vaccines but projects a gradual waning to moderate protection after 1 year. Switching the fourth dose to a variant-matched vaccine against Omicron BA.1/2 is projected to prevent nearly twice as many hospitalisations and deaths over a 1-year period compared to administering the ancestral vaccine. This result is sensitive to the degree to which immunogenicity data can be used to predict vaccine effectiveness and uncertainty regarding the impact that infection-induced immunity (not captured here) may play in modifying future vaccine effectiveness.


Conflict of interest statement

A.C.G. has participated as a non-renumerated member of a scientific advisory board for Moderna, has received consultancy funding from GSK and Sanofi for activities related to COVID-19 vaccination and is a member of the CEPI scientific advisory board and Gavi Vaccine Investment Strategy steering committee. She has received grant funding from Gavi for COVID-19-related work. A.B.H., P.W. and A.C.G. have previously received consultancy payments from WHO for COVID-19-related work. ABH provides COVID-19 modelling advice to the New South Wales Ministry of Health, Australia. A.B.H. was previously engaged by Pfizer Inc to advise on modelling RSV vaccination strategies for which she received no financial compensation. E.M.R. is a non-remunerated member of the UK Vaccines Network, the UKRI COVID-19 taskforce and the British Society for Immunology Covid-19 taskforce. The remaining authors declare no competing interests.

Figures

Fig. 1
Fig. 1. Relationship between immunity levels and vaccine effectiveness.
Dose–response curves estimated from fitting to vaccine effectiveness data for the relationship between immunity level (IL, x-axis) and vaccine effectiveness against mild disease (A, D), hospitalisation (B, E) and death (C, F). Panels (AC) show vaccine effectiveness against the Delta variant whilst panels (DF) show vaccine effectiveness against the Omicron/BA.1 variant. The solid lines show the posterior median estimates and colour bands the 95% credible interval from our model fitted to the data on vaccine effectiveness against each variant. The dotted lines show the dose–response curves that would be projected using the original efficacy model presented in Khoury et al. which fitted the relationship between NAT and clinical endpoints against the ancestral virus and adjusting for the Delta and Omicron variants respectively by using the variant fold reductions (VFRs) from immunogenicity data reported in Cromer et al. and Khoury et al.,.
Fig. 2
Fig. 2. Projected vaccine effectiveness over time (in days) since the first vaccine dose for combinations of schedules for the Oxford/AstraZeneca AZD1222 (AZ), Pfizer-BioNTech BNT162b2 (PF) and Moderna mRNA-1273 (MD) vaccines.
Plots show immunity level (IL) in the left column, alongside effectiveness against mild disease, hospitalisation, and death on the right. Neutralisation and protection against the Delta and Omicron variants are shown in red and blue respectively. Seven regimens are shown: AZ delivered for three doses (AZ–AZ); two doses of AZ and a third dose of PF (AZ–PF); two doses of AZ and a third dose of MD (AZ–MD); PF delivered for three doses (PF-PF); two doses of PF and a third dose of MD (PF-MD); two doses of MD and a third dose of PF (MD–PF); and MD delivered for three doses (MD–MD). The solid lines show the posterior median fitted model estimate, and the points show mean estimates of vaccine effectiveness (and associated 95% confidence intervals) against three endpoints using data from England. Where estimates were only available stratified by age group, the data are from the 65+ age group. Sample sizes for each of the 143 data points vary according to the uptake of combinations and length of follow-up; these are provided in the data files.
Fig. 3
Fig. 3. Model projected vaccine effectiveness over time following a fourth dose with either the vaccine against the ancestral strain (illustrated with Moderna mRNA.1273) or a variant-adapted vaccine, compared to only three doses.
A Vaccine effectiveness against mild disease, hospitalisation, and death, for three doses only (turqouise line), a fourth dose with the ancestral Moderna vaccine (orange line), a fourth dose with a variant-adapted vaccine against any strain (purple line), a variant-adapted vaccine against a homologous strain (pink line) and a variant-adapted vaccine against a heterologous strain (green line). The fourth dose is assumed to be administered 1 year after the third dose, such that estimates for the three-dose group are from 365 days post dose 3 through to 720 days. Estimates are based on the relationship between NAT and protection obtained from fitting to the Omicron BA.1 variant. B Proportion of dose four effectiveness (against mild disease, hospitalisation, and death) that is attributable to receiving any fourth dose (with either the ancestral or variant-adapted vaccine product), relative to the proportion of overall efficacy that is attributable to the variant-adapted product (rather than the ancestral) as the fourth dose, for one year following the fourth dose. This illustrates that administration of any fourth dose generates most of the incremental initial impact, but that the difference between administering the variant-adapted versus the ancestral vaccine becomes more substantial 6–12 months following vaccination.

References

    1. Watson OJ, et al. Global impact of the first year of COVID-19 vaccination: a mathematical modelling study. Lancet Infect. Dis. 2022;22:1293–1302. doi: 10.1016/S1473-3099(22)00320-6. - DOI - PMC - PubMed
    1. Schneider, E. C. et al. The U. S. COVID-19 vaccination program at one year: how many deaths and hospitalizations were averted? Commonwealth Fund. https://www.commonwealthfund.org/publications/issue-briefs/2021/dec/us-c... (2021).
    1. Meslé MMI, et al. Estimated number of deaths directly averted in people 60 years and older as a result of COVID-19 vaccination in the WHO European Region, December 2020 to November 2021. Eurosurveillance. 2021;26:2101021. doi: 10.2807/1560-7917.ES.2021.26.47.2101021. - DOI - PMC - PubMed
    1. Lopez Bernal J, et al. Effectiveness of Covid-19 vaccines against the B.1.617.2 (Delta) variant. N. Engl. J. Med. 2021;385:585–594. doi: 10.1056/NEJMoa2108891. - DOI - PMC - PubMed
    1. Singanayagam A, et al. Community transmission and viral load kinetics of the SARS-CoV-2 delta (B.1.617.2) variant in vaccinated and unvaccinated individuals in the UK: a prospective, longitudinal, cohort study. Lancet Infect. Dis. 2022;22:183–195. doi: 10.1016/S1473-3099(21)00648-4. - DOI - PMC - PubMed

Publication types

Supplementary concepts