. 2023 Jul 19;14(1):4342.
doi: 10.1038/s41467-023-39640-w.

Mutant APC reshapes Wnt signaling plasma membrane nanodomains by altering cholesterol levels via oncogenic β-catenin

Affiliations

Mutant APC reshapes Wnt signaling plasma membrane nanodomains by altering cholesterol levels via oncogenic β-catenin

Alfredo Erazo-Oliveras et al. Nat Commun. .

Abstract

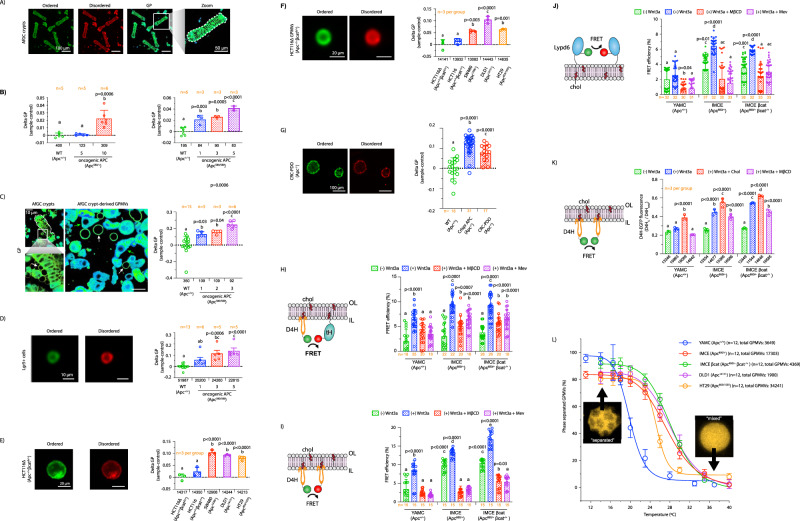
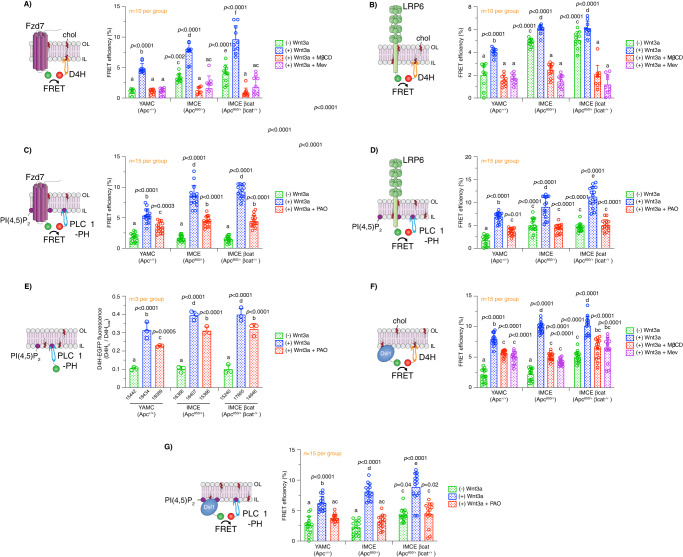
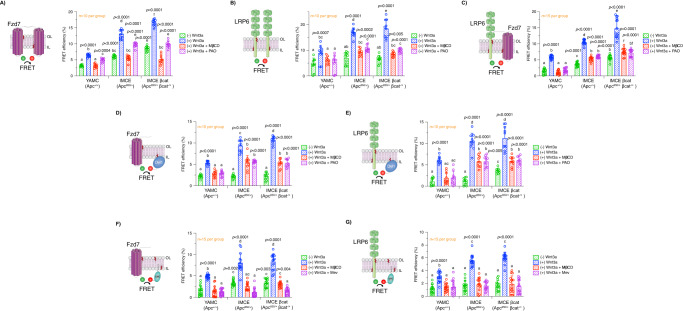
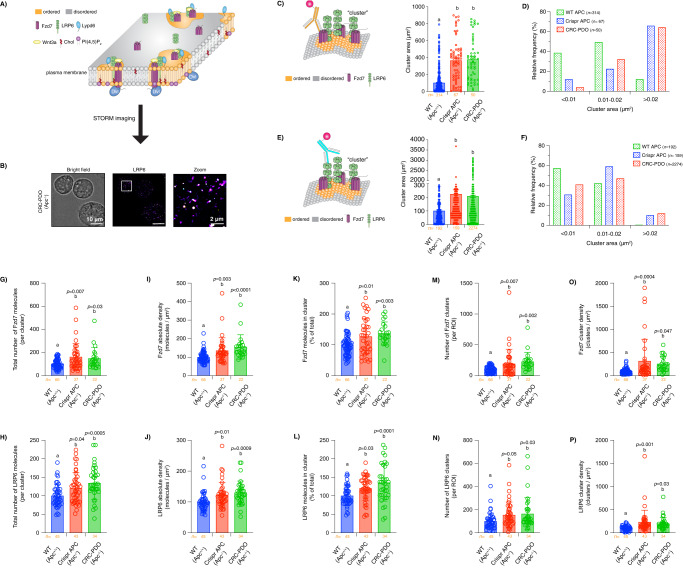
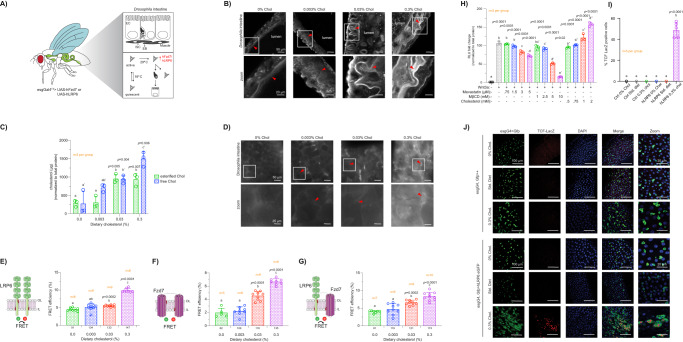
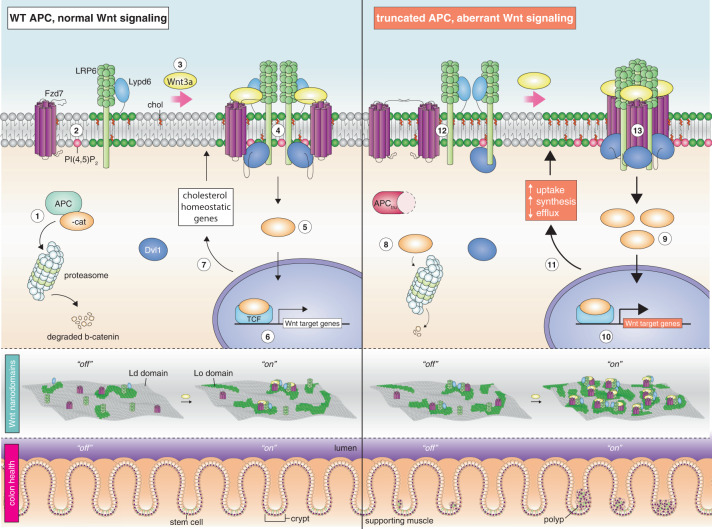
Although the role of the Wnt pathway in colon carcinogenesis has been described previously, it has been recently demonstrated that Wnt signaling originates from highly dynamic nano-assemblies at the plasma membrane. However, little is known regarding the role of oncogenic APC in reshaping Wnt nanodomains. This is noteworthy, because oncogenic APC does not act autonomously and requires activation of Wnt effectors upstream of APC to drive aberrant Wnt signaling. Here, we demonstrate the role of oncogenic APC in increasing plasma membrane free cholesterol and rigidity, thereby modulating Wnt signaling hubs. This results in an overactivation of Wnt signaling in the colon. Finally, using the Drosophila sterol auxotroph model, we demonstrate the unique ability of exogenous free cholesterol to disrupt plasma membrane homeostasis and drive Wnt signaling in a wildtype APC background. Collectively, these findings provide a link between oncogenic APC, loss of plasma membrane homeostasis and CRC development.


Conflict of interest statement

The authors declare no competing interests.

Figures

Fig. 1
Fig. 1. Oncogenic truncated APC topology in CRC models.
A Lollipop plot displaying the distribution and classes of mutations in the APC protein sequence across multiple bowel-associated CRC datasets in the cBioPortal for cancer genomics (https://www.cbioportal.org). Key mutations utilized throughout our studies are highlighted. The functional domains in the APC sequence are also highlighted and matched with their respective coding exons. cBioPortal was employed to create the illustrative depiction of the APC protein. B Summary of all the oncogenic truncated APC models utilized herein. C Characterization of truncated Apc gene products. Lysates were obtained from mouse (YAMC, IMCE, and IMCE βcat) and human (HCT116Δ, HCT116 SW480, DLD1, and HT29) cultured cells as well as patient-derived organoids (PDOs) and detected with a primary antibody against truncated APC. As controls, primary antibodies against βcat and housekeeping genes, β-actin and GAPDH, were utilized. Two independent western blots were performed two times displaying similar results. Source data are provided as a Source data file.
Fig. 2
Fig. 2. Oncogenic truncated APC disrupts plasma membrane cholesterol homeostasis.
A Representative images of colonocytes stained with filipin III and PM stain. Scale bar: 50 µm. Quantitative analysis of cholesterol levels in B mouse-, C human CRC-cultured colonocytes, D, E their derived GPMvs and their respective representative flow cytometry images. Scale bars: 20 µm. Quantitative analysis of cholesterol levels in GPMVs. Error bars represent cells or GPMVs from n = 3 independent biological replicates (mean ± SD). Number of events analyzed using flow cytometry is shown below each bar. Statistical significance was determined by B, D two-way ANOVA or C, E one-way ANOVA and post Tukey’s multiple comparison test. RNAseq analysis from F IMCE βcat and YAMC colonocytes (n = 3 independent biological replicates per group), G mouse colonic crypts isolated from AfGC and GC mice (n = 4 mice per group, equal number of males (♂) and females (♀)), and H n = 36 human paired samples (18 normal and 18 CRC). FH Enrichment of the cholesterol homeostasis pathway genes in AfGC compared to GC samples. IK Volcano plot illustrating differentially expressed genes (FDR ≤ 0.05; top 15 genes are listed) (ES, enrichment score; FDR, false discovery rate; FC, fold change). LN Gene set enrichment analysis in AfGC compared to GC samples. Gene sets were ranked by normalized enrichment score (NES). O Differentially expressed genes corresponding to Wnt/βcat signaling. For all RNA expression experiments, statistical significance was determined by EdgeR-robust in several contrasts and Benjamini-Hochberg (BH) FDR (P < 0.05). P Normalized fitted counts showing mRNA levels of differentially expressed genes associated with cholesterol efflux, uptake, and esterification assessed by RNAseq analysis. Statistical significance determined by two-way ANOVA and post Tukey’s multiple comparison test. Error bars represent n = 3 independent biological replicates (mean ± SD). Q Validation of RNAseq data via western blot normalized to β-actin. Results were used to calculate a relative ratio using YAMC (Apc +/+) as a control. In all cases, when provided, different letters indicate significant differences between WT APC (control) and treated/mutant APC (experimental) groups (P < 0.05). Source data are provided as a Source data file.
Fig. 3
Fig. 3. Cholesterol uptake-related genes modulate plasma membrane biochemical composition in cells expressing oncogenic APC.
A In “normal” YAMC (Apc +/+) cells, membrane cholesterol homeostasis is regulated by cholesterol uptake (mainly from LDL) via the endocytic pathway, de novo cholesterol synthesis in the endoplasmic reticulum (ER) and cholesterol efflux via HDL. Collectively, these steps are tightly regulated to maintain “healthy” levels of cellular cholesterol. B In “deranged” cells, mutant APC perturbs cholesterol uptake, synthesis, and efflux, thus perturbing cholesterol homeostasis leading to changes in the pool of cellular cholesterol. C A putative model demonstrating the consequences of depleting extracellular cholesterol-rich LDL. This hypothetical paradigm should substantially reduce cholesterol availability for cellular endocytic uptake. To assess the contribution of exogenous cholesterol to the plasma membrane (PM), cells were maintained in LDL-depleted (LD) culture media for 24 or 72 h. D, E Quantification of PM cholesterol using filipin III fluorescence. F, G Change in filipin III fluorescence intensity. To quantify changes in PM cholesterol, cells cultured under LD conditions were compared to control (delta filipin fluorescence intensity). Filipin fluorescence intensity was determined from filipin III fluorescence images (mean ± SEM, n = 2 independent biological replicates, exact number of cells analyzed per condition is shown below each bar). Statistical significance was determined by two-way ANOVA and post Tukey’s multiple comparison test. Different letters indicate significant differences between WT APC (control) and treated/mutant APC groups (experimental) (P < 0.05). Illustrations were created with BioRender.com. Source data are provided as a Source data file.
Fig. 4
Fig. 4. Oncogenic truncated APC drives dysregulation of free cholesterol homeostasis in vivo.
A CRC mouse model expressing oncogenic APC. B Mouse experimental design. C Representative images of crypts stained with filipin III from AfGC homo mice. Scale bars: 100 µm. D Colon tissue from GC and AfGC homo mice exhibiting polyposis. Arrowhead, mesenteric adipose tissue; arrow, polyp. Scale bars: 1 cm. E H&E staining of colonic swiss roll (top) and quantitative analysis of crypt length. Scale bars: 1 mm; zoom, 125 µm. F Whole colon quantitative fluorescence intensity analysis of filipin III in GC, AGC het, and AfGC homo. G Crypt-derived GPMV quantitative analysis of plasma membrane free cholesterol levels. Representative filipin III fluorescence images of crypt from AfGC (top left), formation of a GPMV (blebbing, white arrow) from a crypt (bottom left), mixed GPMVs (white arrow), and whole cells (green arrow) (top right), and quantitative analysis of GPMV filipin III fluorescence intensity (bottom). Scale bars: 10 µm. H CSC quantitative analysis of filipin III in AfGC homo mice. Representative images of filipin III-stained CSCs (top) from AfGC homo and filipin III quantitative analysis (bottom). Scale bars: 20 µm. I Representation of colon tumor biopsy harvesting a patient’s tumor to generate CRC-PDOs. J PDO quantitative analysis of plasma membrane free cholesterol. Representative images of PDOs and filipin III quantitative intensity analysis. Scale bars: 50 µm. For all experiments, error bars represent E, F crypts from n = 3–6 mice, E (8♂,7♀), F (15♂,15♀), G crypt-derived GPMVs from n = 3–15 mice (15♂,15♀), H CSCs from n = 5–11 mice (13♂,13♀), normalized to WT APC mice or J organoids from n = 21–37 fields of view (FOV) (2–3 PDOs per FOV) (mean ± SD, exact n value is shown in each graph). The exact total number of crypts, GPMVs, CSCs, and FOVs analyzed are provided below each bar. For all experiments, statistical significance was determined by one-way ANOVA and post Tukey’s multiple comparison test. Different letters indicate significant differences between WT APC (control) and mutant APC groups (experimental) at each time point (P < 0.05). Source data are provided as a Source data file.
Fig. 5
Fig. 5. Oncogenic truncated APC modifies the organization of Wnt signaling plasma membrane domains.
A Di-4-stained crypts from AfGC mice. B Quantitative analysis of di-4 from crypts and C their derived GPMVs (blebbing, left white arrow; GPMVs, right white arrow; whole cells green arrow), D CSCs, E human CRC cells and F their derived GPMVs, and G PDOs. For all d-i4 experiments, error bars represent B n = 3–6 crypts (16♂,15♀), C n = 3–15 GPMVs (15♂,14♀), D n = 5–13 CSCs (15♂,14♀) from mice or E cells and F their derived GPMVs from n = 3 independent biological replicates or G n = 17–31 FOV (2–3 PDOs per FOV) (mean ± SD, n value shown in each graph). Number of crypts, CSCs, cultured colonocytes, and their GPMVs, and FOVs analyzed are provided below each bar. Statistical significance was determined by one-way ANOVA and post hoc Tukey’s test. Different letters indicate significant differences between WT and mutant APC groups (P < 0.05). H Effects of oncogenic APC on plasma membrane cholesterol organization. Cells co-expressing fluorescently-labeled I D4H and tH or J Lypd6 were used to for FLIM-FRET analyses. K Quantitative analysis of IL cholesterol. D4H-EGFP plasma membrane fluorescence intensity was normalized to total D4H-EGFP fluorescence intensity. Cells were pre-treated with mevastatin (5 µM, 24 h), MβCD (10 mM, 30 min), or cholesterol (2 mM, 30 min) and subsequently incubated with control or Wnt3a-conditioned media (30 min). FRET efficiency was calculated from FLIM data averaged per FOV (mean ± SD, n = # FOVs provided below each bar, FOV containing 2–6 cells). For flow cytometry IL cholesterol experiments, error bars represent n = 3 independent biological replicates (mean ± SEM, cell number provided below each bar). Statistical significance determined by HK two-way ANOVA and post hoc Tukey’s. Different letters indicate significant differences between control and experimental groups (P < 0.05). L Quantitative analysis of Ld and Lo domain stability. The percentage of phase separated GPMVs was determined by GPMVseparated/GPMVtotal ratio (mean ± SEM, n = 12 FOVs, analyzed GPMV number shown in graph). Representative images and scale bars are provided for microscopy data. A sigmoidal four parameter logistic regression model was used to determine Tmisc. Source data file provided.
Fig. 6
Fig. 6. Oncogenic APC alters interactions between Wnt receptors and their effectors.
To examine the effect of oncogenic APC on interactions between Wnt receptors and key lipids, cells co-expressing EGFP-tagged A, C Fzd7 or B, D LRP6 and mCherry-tagged A, B D4H or C, D pleckstrin homology (PH) domain of phospholipase C δ1 (PLC-δ1, PI(4,5)P2 sensor) were used to perform FLIM FRET. E To examine the effect of oncogenic APC on PI(4,5)P2 plasma membrane levels, cells expressing EGFP-tagged PLC-δ1-PH were used to measure membrane-associated EGFP fluorescence intensity using flow cytometry. EGFP plasma membrane fluorescence intensity was normalized to total EGFP fluorescence intensity. To examine the effect of oncogenic APC on the interactions between Dvl1 and key lipids, cell co-expressing EGFP-tagged F, G Dvl1 and mCherry-tagged F D4H or G PLC-δ1 were used to perform FLIM FRET. YAMC, IMCE, and IMCE βcat cells were pre-treated with mevastatin (5 µM, 24 h), MβCD (10 mM, 30 min), or phenylarsine oxide (PAO) (20 µM, 30 min) and washed, as indicated. Subsequently, cells were incubated with Wnt3a-conditioned media or control media without Wnt3a for 30 min, washed, fixed, and imaged. For FLIM-FRET experiments, the apparent FRET efficiency was calculated from FLIM data averaged per FOV (mean ± SD, n = 10–15 FOVs containing 3–8 cells were examined per condition, exact n value is shown in each graph). For flow cytometry IL PI(4,5)P2 experiments, cells were imaged to calculate EGFP fluorescence intensity (mean ± SEM, from n = 3 independent biological replicates, total number of cells analyzed is provided below each bar). For all experiments, statistical significance was determined by two-way ANOVA and post Tukey’s multiple comparison test. Different letters indicate significant differences between WT APC (control) and mutant APC/treatment groups (experimental) (P < 0.05). Source data are provided as a Source data file.
Fig. 7
Fig. 7. Oncogenic APC enhances macromolecular interactions within Wnt receptor nanoscale signaling platforms.
For in vitro FLIM-FRET experiments, cells co-expressing EGFP- and mCherry-tagged A Fzd7 or B LRP6 or C EGFP-tagged LRP6 and mCherry-tagged Fzd7 were used to perform homo- and hetero-clustering FLIM-FRET analyses, respectively. To examine the effect of oncogenic APC on the interactions between Dvl1 and Wnt receptors, cells co-expressing EGFP-tagged D Fzd7 or E LRP6 and mCherry-tagged Dvl1 were used to perform FLIM-FRET. To examine the effect of oncogenic APC on plasma membrane Wnt receptor localization, cells co-expressing EGFP-tagged F Fzd7 or G LRP6 and tH-RFP were used to perform FLIM-FRET analyses. For FLIM-FRET experiments, YAMC, IMCE, and IMCE βcat cells were pre-treated with mevastatin (5 µM, 24 h), MβCD (10 mM, 30 min), or phenylarsine oxide (PAO) (20 µM, 30 min) and washed, as indicated. Subsequently, cells were incubated with Wnt3a-conditioned media or control media without Wnt3a for 30 min, washed, fixed, and imaged. The apparent FRET efficiency was calculated from FLIM data averaged per FOV (mean ± SD, from n = 10–15 FOVs containing 3–5 cells each were examined per condition, exact n value is shown in each graph). For all experiments, statistical significance was determined by two-way ANOVA and post Tukey’s multiple comparison test. Different letters indicate significant differences between WT APC (control) and mutant APC/treatment groups (experimental) (P < 0.05). Source data are provided as a Source data file.
Fig. 8
Fig. 8. Oncogenic APC alters the structure and organization of key protein constituents of the Wnt condensate signaling machinery.
For in vivo STORM imaging experiments, isolated single colonocytes from PDOs were fixed and labeled with primary monoclonal rat Fzd7 or mouse LRP6 antibody fluorescently labeled with Alexa Fluor 647. A Model of the formation of Wnt proteolipid condensates in ordered plasma membrane nanodomains examined via STORM imaging. B Representative bright field and Voronoi images of isolated single colonocytes from CRC-PDOs labeled with primary anti-LRP6-AF647. Quantitative analysis of Fzd7 and LRP6 C, E cluster area, D, F cluster area relative frequency, G, H total number of receptor molecules inside clusters, I, J receptor molecule absolute density, K, L percentage of receptor molecules forming part of clustered regions, M, N total number of receptor clusters, and O, P cellular receptor cluster density in isolated single colonocytes from PDOs, respectively. Cluster area was calculated from STORM data averaged per region of interest (ROI) and the respective relative frequency was calculated from individual cluster distribution data (mean ± SD, from n = 50–2274 ROIs, exact n value is shown below each bar). Data associated with the number of single receptor molecules, receptor clusters, and their density was calculated from raw fluorescence intensity images converted to text (.txt) x–y coordinate files using Clus-Doc (mean ± SD, from n = 22–66 ROIs, exact n value is shown below each bar). Different letters indicate significant differences between WT APC (control) and mutant APC groups (experimental) (P < 0.05). Source data are provided as a Source data file.
Fig. 9
Fig. 9. In vivo effect of cholesterol modulation on Wnt receptor organization and βcat activation.
A Drosophila midgut-hindgut intestinal tissue model. ISCs/progenitor cells express humanized hFzd7 or hLRP6 under control of the UAS and esg-Gal4TS. B Filipin III-stained midgut from Drosophila fed various cholesterol diets (red arrow, intestinal lumen). C Quantification of total cholesterol from Drosophila midgut. Cholesterol was calculated from luciferase luminescence data using the Amplex™ Red cholesterol assay and normalized to total protein (mean ± SD, from n = 3 independent biological replicates). D Filipin III fluorescence distribution of Drosophila intestinal epithelium (red arrow, ISCs). Effects of cholesterol on Wnt receptor organization. Flies co-expressing EGFP- and mCherry-tagged E LRP6 or F Fzd7 or G EGFP-LRP6 and mCherry-Fzd7 were used to perform FLIM-FRET in flies fed various cholesterol diets. FRET efficiency was calculated from FLIM data (mean ± SD, from n = 5–10 guts, ROIs analyzed provided below each bar, n value is shown in each graph). H Quantitative analysis of free cholesterol-induced βcat activation. 3T3 LL cells were pre-treated with mevastatin (5 µM, 24 h), MβCD (10 mM, 30 min), and MβCD-cholesterol (cholesterol) (10 mM, 30 min), and incubated with control or Wnt3a-conditioned media for 24 h. Luciferase luminescence was measured using a Luciferase Assay System kit. Luciferase luminescence fold change was normalized to total protein (mean ± SD, from n = 3 independent biological replicates). I Quantitative analysis of Wnt signaling activation. The percentage of TCF-LacZ+ cells is shown. Error bars represent n = 5 independent biological replicates (mean ± SD, ~100 cells analyzed per group). J Qualitative analysis of cholesterol-induced Wnt activation. TCF-LacZ+ cells activity in Drosophila posterior midguts from control (w1118; esgGal4TS, UAS-GFP; TCF-LacZ) and hLRP6-expressing ISCs (w1118; esgGal4TS, UAS-GFP, UAS-hLRP6; TCF-LacZ). Flies were feed a cholesterol free, standard (Std. Diet) or high cholesterol diet for 5 days. ISCs, GFP; nuclei, DAPI. Statistical significance determined by C two-way ANOVA or EI one-way ANOVA and post hoc Tukey’s test. Different letters indicate significant differences between treatment groups (P < 0.05). Representative images and scale bars are provided for microscopy data. Enterocytes, ECs; visceral muscle cells, muscle; intestinal stem cells, ISCs; enteroblasts, EB. Source data file provided.
Fig. 10
Fig. 10. Link between oncogenic APC, loss of plasma membrane homeostasis, and colon cancer development.
The plasma membrane serves as a nexus integrating extra- and intracellular Wnt pathway modulators, which by means of their specific organization at the plasma membrane play an essential role in the homeostatic maintenance of the colonic crypt. (1) WT APC tightly regulates the levels of stabilized βcat by facilitating its degradation via the proteasome, (2) turning off upstream Wnt signaling activation. (3) In the presence of Wnt3a ligand, the canonical Wnt signaling pathway is activated. (4) Activation involves increased localization of IL free cholesterol and PI(4,5)P2, Wnt receptor/effector clustering and translocation of Wnt-associated cytosolic proteins, e.g., Dvl1, at the plasma membrane. (5) Consequently, Wnt condensates drive an increase in the levels of stabilized βcat, which in turn, regulates the (6) transcription of Wnt target genes, (7) including those involved in maintaining membrane cholesterol homeostasis. Together, these processes ensure a normal/healthy colonic epithelium. In contrast, mutation of Apc leads to the expression of truncated APC protein, resulting in the dysregulation of key Wnt signaling-associated cellular steps. Firstly, truncated APC elicits (8) a decrease in βcat degradation, which leads to its (9) aberrant stabilization. (10) The increase in stabilized βcat modulates the transcription of (11) Wnt target genes, including those involved in cholesterol uptake, synthesis, and efflux. (12) The loss of cholesterol homeostasis increases the levels of plasma membrane cholesterol and rigidity, which in turn alters the spatial temporal dynamics of lipid rafts (Lo domains) as well as lipid raft localization and interactions of Wnt signaling-associated receptors and lipid/protein effectors within Wnt condensates in an unstimulated state (no Wnt3a). (13) In the presence of Wnt3a, truncated APC exacerbates oncogenic Wnt signaling by increasing IL cholesterol, PI(4,5)P2 levels, Lo domain stability, and the number of Wnt receptors/effectors at the plasma membrane. This dysregulates Wnt receptor/effector spatial temporal dynamics and nanoclustering, thereby promoting feedforward activation of aberrant βcat signaling and tumorigenesis. “Off”, absence of Wnt3a ligand; “On”, presence of Wnt3a ligand.

References

    1. Siegel Mph RL, et al. Cancer statistics, 2023. Ca. Cancer J. Clin. 2023;73:17–48. doi: 10.3322/caac.21763. - DOI - PubMed
    1. Kinzler KW, Vogelstein B. Lessons from hereditary colorectal cancer. Cell. 1996;87:159–170. doi: 10.1016/S0092-8674(00)81333-1. - DOI - PubMed
    1. Kinzler KW, et al. Identification of a gene located at chromosome 5q21 that is mutated in colorectal cancers. Science. 1991;251:1366–1370. doi: 10.1126/science.1848370. - DOI - PubMed
    1. Giles RH, Van Es,JH, Clevers H. Caught up in a Wnt storm: Wnt signaling in cancer. Biochim. Biophys. Acta - Rev. Cancer. 2003;1653:1–24. doi: 10.1016/S0304-419X(03)00005-2. - DOI - PubMed
    1. Lesko A, Goss K, Prosperi J. Exploiting APC function as a novel cancer therapy. Curr. Drug Targets. 2014;15:90–102. doi: 10.2174/1389450114666131108155418. - DOI - PubMed

Publication types