. 2023 Jul 19;14(1):4033.
doi: 10.1038/s41467-023-39663-3.

Clearance of defective muscle stem cells by senolytics restores myogenesis in myotonic dystrophy type 1

Affiliations

Clearance of defective muscle stem cells by senolytics restores myogenesis in myotonic dystrophy type 1

Talita C Conte et al. Nat Commun. .

Abstract

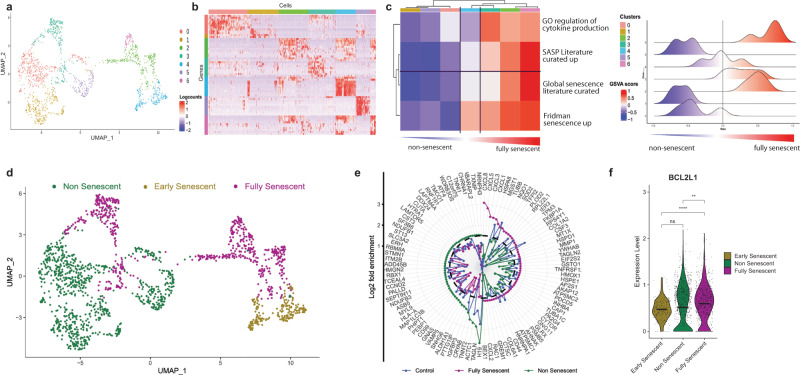
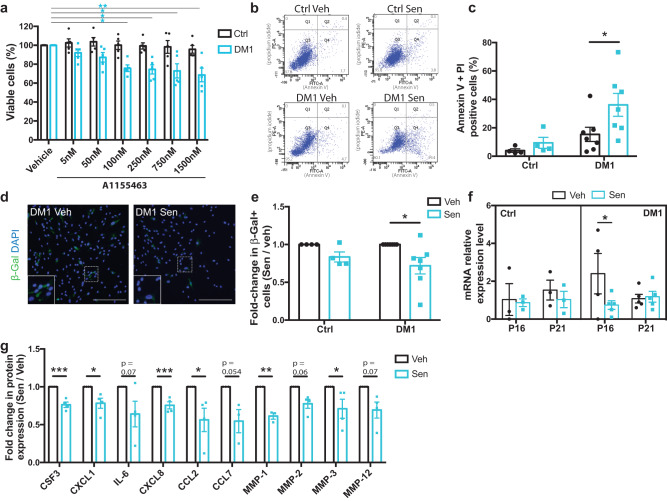
Muscle stem cells, the engine of muscle repair, are affected in myotonic dystrophy type 1 (DM1); however, the underlying molecular mechanism and the impact on the disease severity are still elusive. Here, we show using patients' samples that muscle stem cells/myoblasts exhibit signs of cellular senescence in vitro and in situ. Single cell RNAseq uncovers a subset of senescent myoblasts expressing high levels of genes related to the senescence-associated secretory phenotype (SASP). We show that the levels of interleukin-6, a prominent SASP cytokine, in the serum of DM1 patients correlate with muscle weakness and functional capacity limitations. Drug screening revealed that the senolytic BCL-XL inhibitor (A1155463) can specifically remove senescent DM1 myoblasts by inducing their apoptosis. Clearance of senescent cells reduced the expression of SASP, which rescued the proliferation and differentiation capacity of DM1 myoblasts in vitro and enhanced their engraftment following transplantation in vivo. Altogether, this study identifies the pathogenic mechanism associated with muscle stem cell defects in DM1 and opens a therapeutic avenue that targets these defective cells to restore myogenesis.


Conflict of interest statement

The authors declare no competing interests.

Figures

Fig. 1
Fig. 1. scRNA-seq analysis of myogenic cells from control and DM1 patients.
a UMAP embeddings displaying the control (blue dots) and DM1 patient cell populations (red dots). b Volcano plot depicting differentially expressed genes (DEGs) downregulated or upregulated in DM1 patient cells vs controls. The x-axis represents the log2 of the expression fold change and the y-axis represents the negative log10 of the adjusted p-value of the Wilcoxon rank-sum test. Blue dots represent the transcripts that were statistically significant (P < 10e-6; dotted horizontal line) while red dots represent the top DEGs (|log2FC | > 1.0; vertical dotted line). c Feature and violin plots showing the expression of selected DEGs in DM1 patient and control cells. d, e Functional enrichment analysis with GO Biological Processes analysis using DEGs downregulated (d) and upregulated (e) in DM1 vs control (CTRL) cells. The X-axis represents the –log10(P-value). f, g Bubble diagram showing the top 10 Reactome pathways for DEGs downregulated (f) and upregulated (g) in DM1 vs control cells. Vertical axes show enriched terms, and horizontal axes represent the genes in each cluster. Larger node size represents the larger ratio of enriched genes/total genes. h, i Rank for regulons for downregulated genes (h) or upregulated genes (i) in DM1 vs control cells based on regulon specificity score (RSS). j STRING analysis showing the interactions between top SASP, transcription factors, and the anti-apoptotic BCL pathway.
Fig. 2
Fig. 2. Identification of senescent cell subpopulations in samples from DM1 patients.
a UMAP visualization showing unsupervised clustering revealing 7 distinct cell populations in patient cells. b Heatmap showing the top differentially expressed genes (DEGs) from each cluster. c Heatmap and ridge plots showing the fold change of GSVA score on gene sets related to cellular senescence and cytokine secretion comparing DEGs transcripts from each cluster. Clusters with positive GSVA values for all the gene sets were annotated as fully senescent while clusters with mixed and negative GSVA scores were annotated as early-senescent and non-senescent, respectively. d UMAP embedding characterizing the fully senescent (purple), early-senescent (gold), and non-senescent populations (green) in patient cells. e Radar plot of DEGs of fully senescent, versus non-senescent cells, and control cells (blue). Y-axis represents the log2 of the expression fold change. Dotted line delineates the threshold of log2FC = 1.2. f Violin plot showing the expression of BCL2L1 (BCL-XL) in fully senescent, early-senescent, and non-senescent subpopulations. **p = 0.002, ****p = 5.9 × 10⁻⁸ (One-sided Wilcoxon-Mann-Whitney unpaired U test).
Fig. 3
Fig. 3. MuSC senescence is a hallmark of DM1 in vitro and in situ.
a Representative micrographs of control and DM1 myoblasts stained for FITC SA-ß-Gal (green). Scale bars: 300 μm. b Quantification of the percentage of SA-ß-Gal+ senescent cells (n = 4 ctrl and 6 DM1 cell lines; average of 467 cells [257-705 cells] counted per sample) **p = 0.0023 (Two-tailed unpaired T-Test with Welch’s correction). c qPCR for the senescence markers P16 and P21 in control and DM1 myoblasts (n = 3 ctrl and 4 DM1 cell lines); *p = 0.046 (two-way ANOVA followed by Bonferroni’s multiple comparisons). d Growth curve of control and DM1 myoblasts cultured for 7 days (n = 5); *p = 0.042 (Two-tailed multiple unpaired T-test). e Representative micrograph of co-immunostaining for RNA FISH (CUG repeats, red), SA-β-Gal (green), and DAPI (blue). Red lines identify a senescent cell and gray dashed lines a non-senescent cell. Scale bar: 46.2 μm. f Quantification of the number of intranuclear RNA foci per senescent or non-senescent cell in DM1 myoblasts. (n = 6 samples; average of 50 cells [22-104 cells] counted per sample) **p = 0.0017 (Two-tailed unpaired T-test). g Co-immunofluorescence labeling of PAX7 (green) and P16 (magenta) on control and DM1 muscle sections. White arrowheads indicate PAX7 + P16- MuSCs and white arrows indicate PAX7 + P16+ senescent MuSCs. Scale bars: 50 μm. h Quantification of senescent MuSCs expressing PAX7 and P16 (n = 3 Ctrl and 5 DM1 biological samples; average of 110 cells [23-246 cells] counted per sample) *p = 0.0219 (Two-tailed unpaired T-Test with Welch’s correction). i qPCR for the senescence markers P16 and P21 on control and DM1 muscle biopsies (n = 5 Ctrl and 9 DM1 biological samples). **p = 0.0075 (P16) and **p = 0.004 (P21) (two-tailed Mann–Whitney test). j Schematic showing the experimental design of the conditioned medium (CM) assay. Created with BioRender.com. k Cell proliferation of healthy myoblasts treated with control or DM1 CM for 4 days (n = 4); *p = 0.0452 (Two tailed unpaired T-test with Welch’s correction). l Representative micrographs of myotubes differentiated for 3 days and then cultured with control or DM1 CM for 2 days (MyHC in green; DAPI in blue). Scale bars: 50 μm. m Fusion index of myotubes treated with control or DM1 CM. (n = 4 Ctrl and 3 DM1 biological samples; average of 860 nuclei cells [576-1376 cells] counted per sample). *p = 0.0219 (two-tailed unpaired T-test). Data are expressed as means ± SEM. Source data are provided as a Source Data file.
Fig. 4
Fig. 4. SASP expression is negatively correlated with muscle strength and functional outcomes in DM1.
ad Correlation between serum IL-6 levels in DM1 patients and the expected strength (relative to normative values) of different muscle groups of the lower limb (ankle dorsiflexors, hip flexors, knee extensors, knee flexors) and eh upper limb (shoulder flexors, shoulder abductors, elbow flexors, elbow extensors). i, j Expected muscle strength of DM1 patients with low or high levels of IL-6 (based on a cut-off reference limit for healthy individuals of 4.45 pg/ml) for the lower limb (i) and upper limb (j) muscle groups. Dashed line indicates the normative data for isometric muscle strength in healthy individuals of the same age, sex, and weight. k, m, o, q Correlation between serum IL-6 levels in DM1 patients and the results of different functional capacity tests: Timed-up and Go, 10-meter walk test (10mWT), grip test, pinch test. l, n, p, r Functional capacity test results for DM1 patients with low or high levels of IL-6 levels. i, j, l, n, p, r Data are expressed as means ± SEM. n = 103 patients (80 patients IL-6 low, 23 patients IL-6 high). *p < 0.05, **p < 0.01, ***p < 0.001 (Panels ah, k, m, o, q: Spearman ρ correlation coefficient and two-tailed p-value. Panels i, j, l, n, p, r: Two-tailed Mann–Whitney U test). Source data are provided as a Source Data file.
Fig. 5
Fig. 5. A1155463 shows senolytic activity on DM1 primary myoblasts culture.
a Cell viability assay of A1155463 at different concentrations using control (Ctrl) and DM1 patients’ myoblasts (n = 5). *p = 0.038 (100 nM), *p= 0.023 (250 nM), *p = 0.011 (750 nM), **p = 0.0016 (1500 nM) (two-way ANOVA with Tukey’s multiple comparisons test). b Representative FACS plots of Annexin-V (FITC) and propidium iodide (PE), and c quantification of the percentage of positive apoptotic/necrotic cells after 48 h treatment of myoblasts (DM1 and Ctrl) with 100 nM of A1155463 (Sen) or with vehicle (Ctrl), (n = 4 Ctrl and 7 DM1 cell lines); *p = 0.034 (one-way ANOVA with Sidak’s multiple comparisons test). d Representative micrographs of DM1 myoblasts stained for the senescent marker SA-ß-Gal (green) after 72 h treatment with 100 nM of A1155463 or with vehicle. Scale bar: 300 μm. e Quantification of the number of SA-ß-Gal+ cells expressed as fold change ratio of A1155463-treated (Sen) versus non-treated (Veh) cells (n = 4 Ctrl and 7 DM1 cell lines; average of 1064 cells [142-2873 cells] counted per biological sample). *p = 0.015 (one-way ANOVA with Sidak’s multiple comparisons test). f Quantitative real-time PCR for the senescence markers P16 and P21 on primary myoblasts after 72 h of treatment with vehicle or A1155463 (n = 3 Ctrl and 5 DM1 cell lines, except n = 4 for the p16 expression of DM1-Veh group). *p = 0.042 (two-way ANOVA with Tukey’s multiple comparisons test). g Multiplex Luminex assay of SASP factors showing fold change ratio of A1155463-treated (Sen) versus non-treated (Veh) DM1 myoblasts (n = 4 cell lines, except n = 3 for CCL7 and MMP-1 expression). ***p = 0.0005 (CSF3), *p = 0.018 (CXCL1), ***p = 0.002 (CXCL8), *p = 0.041 (CCL2), **p = 0.009 (MMP-1), *p = 0.027 (MMP-3) (two-tailed multiple unpaired T-tests). Data are expressed as means ± SEM. Source data are provided as a Source Data file.
Fig. 6
Fig. 6. Clearance of senescent cells in DM1 improves myogenesis in vitro and in vivo.
a Representative micrographs of DM1 myoblasts immunolabeled with KI67 (red) after 72 h of treatment with vehicle (Veh) or A1155463 (Sen). Scale bars: 300 μm. b Quantification of the proportion of KI67+ cells treated with A1155463 (Sen) relative to vehicle (n = 4 Ctrl and 7 DM1 cell lines; average of 1064 cells [142-2873 cells] counted per sample). *p = 0.017 (one-way ANOVA with multiple comparisons). c Cell proliferation of healthy myoblasts cultured with conditioned media (CM) from DM1-untreated or DM1-senolytic-treated myoblasts for 5 days; (n = 3 biological samples). *p = 0.033 (Two-tailed unpaired T-test). d Representative micrographs of DM1 myoblasts differentiated for 5 days after treatment with vehicle (Veh) or A1155463 (Sen) and immunolabeled with MYOG (green). Scale bars: 300 μm. e Quantification of the number of MYOG+ cells treated with A1155463 (Sen) relative to vehicle (n = 4 Ctrl and 5 DM1 cell lines, average number of 1388 cells [104-4218 cells] counted per sample) *p = 0.0134 (one-way ANOVA with multiple comparisons). f Representative Western blots showing the expression of MYOG in control and DM1 myoblasts differentiated for 5 days after treatment with vehicle (Veh) or A1155463 (Sen). g Quantification of MYOG expression by Western blot (relative to β-actin as loading control). Data are expressed as fold change relative to non-treated (Veh) cells (n = 3 Ctrl and 7 DM1 cell lines). *p = 0.039 (two-way ANOVA with Sidak’s multiple comparisons test). h Schematic representation of DM1 myoblast transplantation experiment. Created with BioRender.com. i Representative micrographs of muscle sections of TA muscles (21 days post-cardiotoxin injection) of NSG mice transplanted with DM1 myoblasts treated with vehicle (upper images) or A1155463 (bottom images). Sections were immunostained with human dystrophin (hDMD; green), total dystrophin (tDMD, magenta), and DAPI (nuclei, blue). White arrows indicate myofibers expressing hDMD and tDMD. Scale bars: 50 μm. j Quantification of the number of myofibers expressing hDMD in transplanted cells treated with A1155463 (Sen) relative to vehicle (n = 3 different DM1 cell lines transplanted in three different mice per cell line; average number of 3388 myofibers [2100–5140 myofibers] counted per biological sample. *p = 0.014 (Two-tailed unpaired t-test with Welch’s correction). Data are expressed as means ± SEM. Source data are provided as a Source Data file.

Comment in

Similar articles

Cited by

References

    1. Bouchard G, Roy R, Declos M, Mathieu J, Kouladjian K. Origin and diffusion of the myotonic dystrophy gene in the Saguenay region (Quebec) Can J Neurol Sci. 1989;16:119–122. doi: 10.1017/S0317167100028651. - DOI - PubMed
    1. Liao Q, Zhang Y, He J, Huang K. Global prevalence of myotonic dystrophy: an updated systematic review and meta-analysis. Neuroepidemiology. 2022;56:163–173. doi: 10.1159/000524734. - DOI - PubMed
    1. Fu YH, et al. An unstable triplet repeat in a gene related to myotonic muscular dystrophy. Science. 1992;255:1256–1258. doi: 10.1126/science.1546326. - DOI - PubMed
    1. Savic D, et al. 250 CTG repeats in DMPK is a threshold for correlation of expansion size and age at onset of juvenile-adult DM1. Hum. Mutat. 2002;19:131–139. doi: 10.1002/humu.10027. - DOI - PubMed
    1. Thornell LE, et al. Satellite cell dysfunction contributes to the progressive muscle atrophy in myotonic dystrophy type 1. Neuropathol. Appl. Neurobiol. 2009;35:603–613. doi: 10.1111/j.1365-2990.2009.01014.x. - DOI - PubMed

Publication types

MeSH terms

Substances

Grants and funding