. 2023 Jul 19;14(1):4257.
doi: 10.1038/s41467-023-39710-z.

The muscle-enriched myokine Musclin impairs beige fat thermogenesis and systemic energy homeostasis via Tfr1/PKA signaling in male mice

Affiliations

The muscle-enriched myokine Musclin impairs beige fat thermogenesis and systemic energy homeostasis via Tfr1/PKA signaling in male mice

Lu Jin et al. Nat Commun. .

Abstract

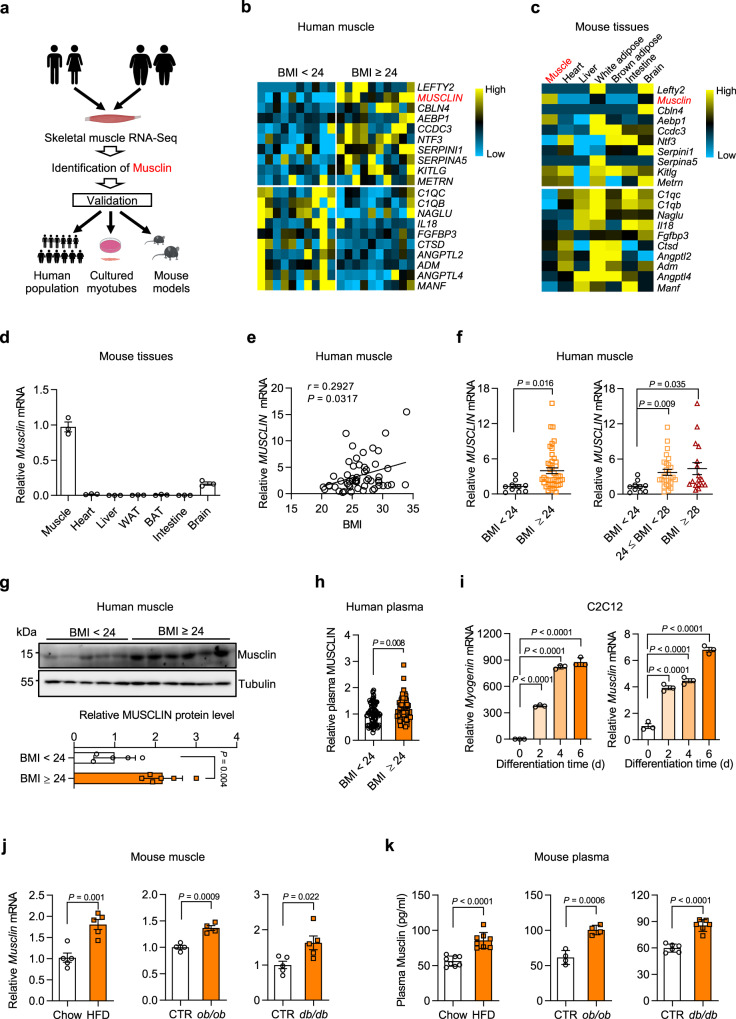
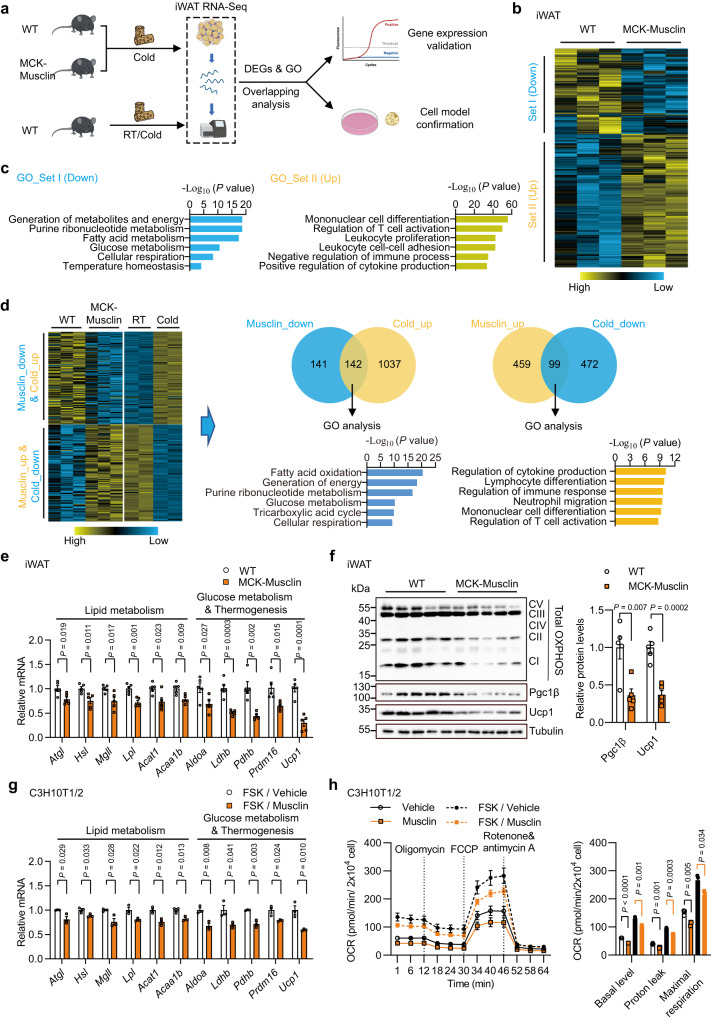
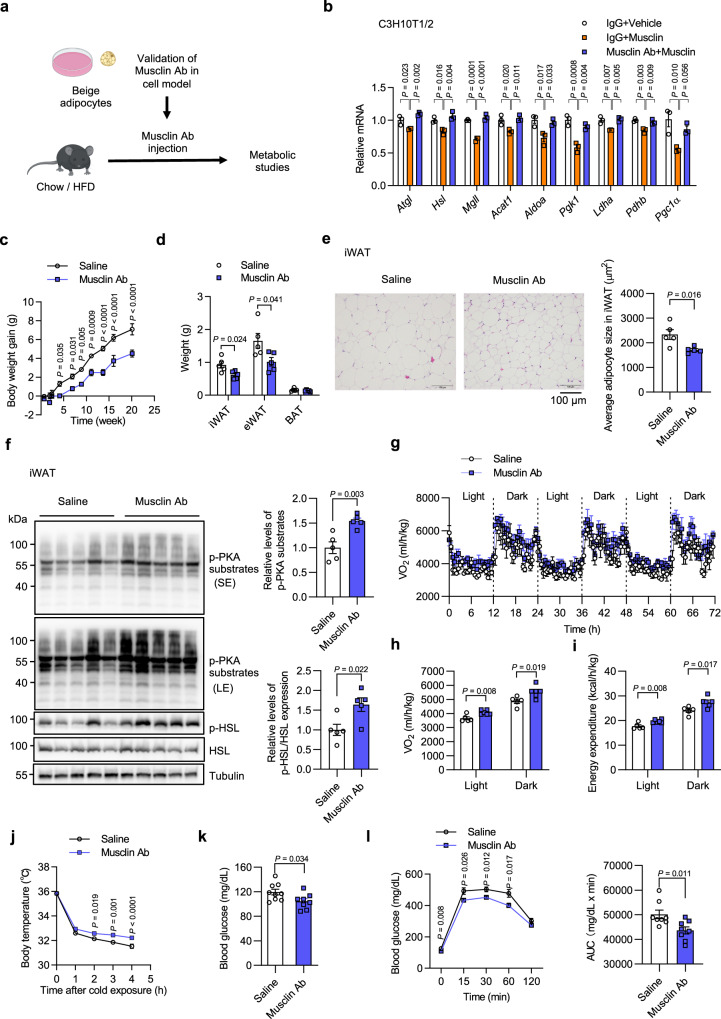
Skeletal muscle and thermogenic adipose tissue are both critical for the maintenance of body temperature in mammals. However, whether these two tissues are interconnected to modulate thermogenesis and metabolic homeostasis in response to thermal stress remains inconclusive. Here, we report that human and mouse obesity is associated with elevated Musclin levels in both muscle and circulation. Intriguingly, muscle expression of Musclin is markedly increased or decreased when the male mice are housed in thermoneutral or chronic cool conditions, respectively. Beige fat is then identified as the primary site of Musclin action. Muscle-transgenic or AAV-mediated overexpression of Musclin attenuates beige fat thermogenesis, thereby exacerbating diet-induced obesity and metabolic disorders in male mice. Conversely, Musclin inactivation by muscle-specific ablation or neutralizing antibody treatment promotes beige fat thermogenesis and improves metabolic homeostasis in male mice. Mechanistically, Musclin binds to transferrin receptor 1 (Tfr1) and antagonizes Tfr1-mediated cAMP/PKA-dependent thermogenic induction in beige adipocytes. This work defines the temperature-sensitive myokine Musclin as a negative regulator of adipose thermogenesis that exacerbates the deterioration of metabolic health in obese male mice and thus provides a framework for the therapeutic targeting of this endocrine pathway.


Conflict of interest statement

The authors declare no competing interests.

Figures

Fig. 1
Fig. 1. Identification of muscle secreted protein Musclin as a potential risk factor for metabolic diseases.
All mice used here are male. a Schematic representation of muscle secreted protein screening. b Heatmap of expression of 10 upregulated and 10 downregulated secreted protein-encoding genes in muscles from subjects with BMI ≥ 24 and BMI < 24 (Cutoff: P < 0.05, |Log2 (fold change)| > 0.3 & average reads count > 30). BMI, body mass index. c Expression levels of genes listed in (b) in mouse tissues. d qPCR analysis of Musclin expression (3 months old, n = 3). e Association of relative MUSCLIN mRNA levels to human BMI (n = 54), Spearman correlation analysis with 95% confidence interval. The statistical test was two-sided with α = 0.05. f qPCR analysis of MUSCLIN gene expression. BMI < 24, n = 10; 24 ≤ BMI < 28, n = 27; BMI ≥ 28, n = 17. g Immunoblots of human muscle lysates (top) and quantification of Musclin levels (bottom). BMI < 24, n = 5; BMI ≥ 24, n = 6. h Relative human plasma Musclin levels. BMI < 24, n = 83; BMI ≥ 24, n = 61. i qPCR analysis of Myogenin and Musclin gene expression in C2C12 during differentiation. n = 3 biologically independent cell samples. j qPCR analysis of Musclin gene expression. Chow vs HFD, n = 5 (HFD feeding at 3-month-old, continued for 4 months); CTR vs ob/ob, n = 4 (4 months old, chow diet); CTR vs db/db, n = 5 (5 months old, chow diet). k Radioimmunoassay (RIA) of plasma Musclin levels. Chow vs HFD, n = 8 (7 months old); CTR vs ob/ob, n = 4 (4 months old); CTR vs db/db, n = 6 (5 months old). d, fh, j, k, data represent mean ± SEM; i data represent mean ± SD. d-h, j-k, n represents biologically independent animals/human samples. fh, j, k, two-tailed unpaired Student’s t-test; i one-way ANOVA with Tukey’s multiple comparisons. b, c Differential expression analysis of RNA-Seq data was performed using Deseq2 package (P-value by Wald test). Experiments in dg and ik were repeated independently three times with similar results. Source data are provided as a Source Data file.
Fig. 2
Fig. 2. Transgenic overexpression of Musclin inhibits adipose tissue thermogenesis.
All mice used here are male and fed with chow diet. a qPCR analysis of Musclin mRNA in muscles from indicated mice (3 months old). Room temperature (RT) vs 30°C (1 week), n = 6; RT vs Cold, n = 5 vs 4. b Immunoblots of muscle lysates (left, 3 months old) and quantification of Musclin protein levels (right). n = 3. c Immunoblots of muscle lysates (left, 3.5 months old), and quantification of Musclin protein levels (right). RT vs Cold, n = 5 vs 6. d Plasma Musclin levels. RT vs 30°C, n = 6 (3 months old); RT vs Cold, n = 11 (5 months old). e Binding assay on mouse tissue sections using SEAP or SEAP-Musclin fusion proteins. SEAP, secreted alkaline phosphatase; iWAT, inguinal white adipose tissue; eWAT, epidydimal white adipose tissue. Scale bar: 100 μm. f Immunoblots of muscle lysates (left), and quantification of Musclin protein levels (right). WT vs MCK-Musclin, n = 5 vs 7. MCK, muscle creatine kinase. g RIA of plasma Musclin levels. WT vs MCK-Musclin, n = 8 vs 7. h Body weight (6 months old). WT vs MCK-Musclin, n = 6 vs 8. i iWAT and BAT weight (7 months old). WT vs MCK-Musclin, n = 5 vs 7. j Representative images of iWAT (7 months old). k Core body temperature before and 6 h following cold at 4°C (2.5 months old), n = 8. l Ratio of homeothermic mice during cold at 4°C (2.5 months old) (Homeothermia is defined as the ratio of mice with a body temperature above 31°C), n = 8. m Core temperature during cold at 8°C (7 months old). WT vs MCK-Musclin, n = 7 vs 6. n Representative infrared images (left) and the average body surface temperature (right) of mice following 3 h of CL316,243 (CL) injection (4.5 months old). n = 5. o Blood glucose following cold at 8 °C for 2 days (6.5 months old). WT vs MCK-Musclin, n = 6 vs 8. p Plasma insulin levels (5 months old). WT vs MCK-Musclin, n = 5 vs 6. Data represent mean ± SEM (n represents biologically independent animals). ad, fi, k, np Two-tailed unpaired Student’s t-test; m two-way ANOVA with Sidak’s multiple comparisons. All experiments here were repeated independently three times with similar results. Source data are provided as a Source Data file.
Fig. 3
Fig. 3. Musclin cell-autonomously inhibits adipocyte thermogenic metabolism.
All mice used here are male and fed with chow diet. a Schematic of transcriptional profiling analysis in iWAT from chronic cold (8°C, 1 week)-treated WT and MCK-Musclin mice (5 months old) and overlapping analysis between differentially expressed genes (DEGs) in iWAT from MCK-Musclin and cold acclimated male mice as compared to their respective controls (2.5 months old). GO, Gene Ontology. b Transcriptomics of iWAT from MCK-Musclin and control mice (Cutoff: p < 0.05, |log2 (fold change)| > 0.5). c GO analysis of gene sets I and II in (b). d Overlapping analysis of DEGs in iWAT from indicated mice (Cutoff: P < 0.05, |log2 (fold change)| > 0.5). Heatmap, Venn diagram, and GO analysis are shown. e qPCR analysis of gene expression in iWAT from MCK-Musclin and control mice as indicated in (a). f Immunoblots of total lysates of iWAT from chronic cold (8°C, 1 week)-treated mice (left), and quantification of indicated protein levels (right). e-f Data represent mean ± SEM (n = 5 biologically independent animals per group, 5 months old). g qPCR analysis of gene expression in differentiated C3H10T1/2 cells pretreated with vehicle or Musclin-His, followed by forskolin treatment. Data represent mean ± SD (n = 3 biologically independent cell samples per group). FSK, forskolin. h Oxygen consumption rates (OCRs) of adipocytes with indicated treatments at each timepoint (left) and average basal, proton leak, and maximal respiration levels (right). OCRs were normalized to the cell numbers. Data represent mean ± SD at each timepoint (left panel; n = 6 for Vehicle, 5 for Musclin, 6 for FSK/Vehicle, 7 for FSK/Musclin) and mean ± SEM (right panel; each symbol represents the average OCR from one treatment at each detection timepoint, 3 detections for each condition). eh two-tailed unpaired Student’s t-test. Differential expression analysis of RNA-Seq data was performed using Deseq2 package (P-value by Wald test) in bd. Experiments in eh were repeated independently three times with similar results. Source data are provided as a Source Data file.
Fig. 4
Fig. 4. Elevation of muscle-secreted Musclin exacerbates HFD-induced obesity and metabolic dysfunction.
MCK-Musclin and WT male mice were fed with HFD beginning at 3 months old. a Body weight of MCK-Musclin and WT mice housed at 16°C. WT vs MCK-Musclin, n = 8 vs 7. b Fasting blood glucose. WT vs MCK-Musclin, n = 11 vs 6. c Plasma insulin concentration of mice housed at 16°C. WT vs MCK-Musclin, n = 7 vs 6. d Glucose tolerance test (left) and the area under curve (AUC, right). WT vs MCK-Musclin, n = 9 vs 5. e Insulin tolerance test (left) and AUC (right) of mice housed at 16°C. WT vs MCK-Musclin, n = 9 vs 7. f Lean mass and fat mass after HFD feeding for 2 months at 16°C. WT vs MCK-Musclin, n = 6 vs 5. g Weight of indicated tissues from mice housed at 16°C. WT vs MCK-Musclin, n = 7 vs 6. h Representative H&E staining images of iWAT, eWAT, and BAT (WT vs MCK-Musclin, n = 4 vs 5). i The cell size of iWAT (n = 5 per group, left panel) and total lipid droplet area per view in BAT H&E sections (n = 7 per group, right panel) as shown in (h). ag, i data represent mean ± SEM; n represents biologically independent animals. a Two-way ANOVA with Sidak’s multiple comparisons. bg, i Two-tailed unpaired Student’s t-test. Experiments in ag were repeated independently three times, and experiments in h and i were repeated independently twice with similar results. Source data are provided as a Source Data file.
Fig. 5
Fig. 5. Adeno-associated virus-mediated elevation of Musclin suppresses thermogenesis and systemic energy expenditure.
a Schematic representation of tail vein injection of Adeno-associated virus (AAV) expressing GFP or Musclin in mice. b Immunoblots of total liver lysates from AAV-GFP/Musclin transduced male mice (n = 3 per group). c Plasma Musclin levels in AAV-GFP/Musclin transduced male mice (6 months old). n = 5 per group. d Core body temperature of chow diet-fed AAV-GFP/Musclin transduced female mice during cold acclimation (5 months old). n = 5 per group. e Representative infrared images and average body temperature of chow diet-fed AAV-GFP/Musclin transduced male mice following cold acclimation (3.5 months old). AAV-GFP vs AAV-Musclin, n = 7 vs 6. fl Three-month-old AAV-GFP/Musclin transduced male mice were fed with HFD at 16°C. f Body weight. n = 8 per group. g Fasting blood glucose. n = 8 per group. h Plasma insulin concentration. AAV-GFP vs AAV-Musclin, n = 5 vs 6. i Oral glucose tolerance test (left) and AUC (right). AAV-GFP vs AAV-Musclin, n = 6 vs 7. j Insulin tolerance test (left) and AUC (right). n = 8 per group. k CL-induced oxygen consumption at RT (24°C) (left) of indicated male mice fed with HFD for 4 weeks, represented as changes over values measured before CL treatment, and AUC (right). AAV-GFP vs AAV-Musclin, n = 7 vs 8. l Weight of indicated tissues from male mice. AAV-GFP vs AAV-Musclin, n = 8 vs 6. cl Data represent mean ± SEM; n shown in this figure represents biologically independent animals. d, f Two-way ANOVA with Sidak’s multiple comparisons. c, e, gl Two-tailed unpaired Student’s t-test. All experiments here were repeated independently three times with similar results. Source data are provided as a Source Data file.
Fig. 6
Fig. 6. Musclin directly binds to Tfr1 and antagonizes cAMP/PKA signalling-dependent thermogenic induction in adipocytes.
a Immunoblots of differentiated C3H10T1/2 cells treated with vehicle or Musclin for 1 h. b cAMP levels of differentiated C3H10T1/2 cells treated with vehicle or Musclin-Fc for 4 h. n = 3 per group. c Immunoblots of differentiated C3H10T1/2 cells pretreated with vehicle or Musclin-Fc, followed by treatment of 8-Br-cAMP or vehicle. d Schematic of screening for Musclin-interacted membrane-associated proteins using BioID assay. Musclin-BirA*, Musclin and BirA* fusion protein. e Coomassie blue staining of total membrane-associated proteins isolated from differentiated C3H10T1/2 cells (left, shown as input), and silver staining of proteins pulled down from total membrane-associated proteins by streptavidin beads (right, shown as streptavidin pulldown). f Immunoblots of input and streptavidin pulldown samples as indicated in (e). g Physical interaction of Musclin and Tfr1 in transiently transfected HEK293T cells. IP, immunoprecipitation; Musclin-Fc, Fc-tagged Musclin; Tfr1-flag, Flag-tagged Tfr1. h qPCR analysis of Tfr1 gene expression in adipocytes derived from C3H10T1/2 transduced with retrovirus expressing CTR shRNA or Tfr1 shRNA. n = 6 per group. i Immunoblots of whole-cell lysates of adipocytes derived from C3H10T1/2 treated with CTR shRNA or Tfr1 shRNA followed by treatment with vehicle or ISO (50 nM). ISO, Isoproterenol. j cAMP levels in indicated adipocytes following treatment with vehicle or ISO (100 nM). n = 3 for basal condition and n = 4 for ISO treatment. k Immunoblots of whole-cell lysates of adipocytes derived from C3H10T1/2 treated with CTR shRNA or Tfr1 shRNA followed by treatment with vehicle or Musclin-Fc. l The basal and ISO-induced cAMP levels in adipocytes derived from C3H10T1/2 transduced with CTR shRNA or Tfr1 shRNA following treatment with vehicle or Musclin-Fc. n = 3 per group. ns, no significance. m qPCR analysis of gene expression in indicated C3H10T1/2-derived adipocytes. n = 3 per group. n Model depicting the thermogenic inhibition effect of Musclin. b, h, j Data represent mean ± SD; n shown here represents biologically independent cell samples. b, h, j two-tailed unpaired Student’s t-test. l, m One-way ANOVA with Tukey’s multiple comparisons. All experiments here are repeated independently three times with similar results. Source data are provided as a Source Data file.
Fig. 7
Fig. 7. Musclin-specific Musclin knockout promotes thermogenesis and energy expenditure.
Male Musclinflox/flox and Musclin-MKO were used in studies shown in this figure. a Immunoblots of total protein lysates from muscle. b Plasma Musclin levels. Musclinflox/flox vs Musclin-MKO, n = 14 vs 15. c-m, Mice fed with HFD began at 3 months old and continued for 3–5 months. c Body temperature of HFD-fed mice during acute cold exposure. Musclinflox/flox vs Musclin-MKO, n = 8 vs 7. d Representative infrared images (left) and the average body surface temperature (right) of mice following 6.5 h of CL316,243 injection. Musclinflox/flox vs Musclin-MKO, n = 10 vs 9. e Blood glucose following 6 h of fasting at 16°C. Musclinflox/flox vs Musclin-MKO, n = 10 vs 9. f Glucose tolerance test (left) and AUC (right). Musclinflox/flox vs Musclin-MKO, n = 9 vs 7. g Insulin tolerance test (left) and AUC (right). Musclinflox/flox vs Musclin-MKO, n = 10 vs 9. h iWAT weight. n = 6 per group. i Representative H&E staining images of iWAT (left) and adipocyte size analysis (right). n = 5 per group. j Oxygen consumption rates of mice were monitored at RT (24°C) for 3 consecutive days following thermoneutrality at 30°C (1 week) and an additional 4 days of adaptation at RT. Lean mass was applied for normalization. k Average oxygen consumption rate of mice at day time or night time during the 3 days of monitoring as in (j). l Averaged energy expenditure tested at day time and night time. jl Musclinflox/flox vs Musclin-MKO, n = 6 vs 5. m Immunoblots of total iWAT protein lysates (left) and quantification of protein levels (right). n = 6 per group. bm Data represent mean ± SEM (n represents biologically independent animals). c, two-way ANOVA with Sidak’s multiple comparisons. b, di, km Two-tailed unpaired Student’s t-test. Experiments in be, m were repeated independently three times, and results in fl were repeated independently twice with similar results. Source data are provided as a Source Data file.
Fig. 8
Fig. 8. Neutralizing antibody-mediated Musclin blockade improves energy homeostasis.
WT male mice were treated with saline or Musclin Antibody (Musclin Ab). a Schematic of in vitro validation of Musclin antibody and in vivo Musclin neutralization assay. b qPCR analysis of C3H10T1/2-derived adipocytes pretreated with control IgG or Musclin Ab, followed by treatment with forskolin. n = 3 per group. cf Chow diet-fed mice were treated with saline or Musclin Ab beginning at 3 months old. n = 5 per group. c Body weight gain. d Weight of indicated tissues. e Representative H&E staining images of iWAT (left) and average adipocyte size analysis (right). f Immunoblots of total lysates from iWAT (left), and quantification of protein levels (right). g–i Chow diet-fed mice were treated with saline or Musclin Ab beginning at 2.5 months old and continued for 3 months. Saline vs Musclin Ab, n = 5 vs 6. g Oxygen consumption rate of 3 consecutive days monitored at RT (24°C) following thermoneutrality at 30°C (1 week) and an additional 2 days of adaptation at RT. Lean mass was applied for normalization. h Average oxygen consumption rate at day time or night time during the 3 days of monitoring as in (g). i Average energy expenditure at day time or night time. j Core body temperature of HFD-fed mice during acute cold exposure at 4°C. n = 8 per group. HFD feeding began at 2.5 months old with antibody treatment (for 1 month) after 5.5 months old. k Blood glucose levels. Saline vs Musclin Ab, n = 9 vs 8. HFD feeding began in mice at 3.5 months old with antibody treatment (for 2 weeks) at 4.5 months old. l Glucose tolerance test (left) and the AUC (right). n = 8 per group. HFD feeding began in mice at 3.5 months old with antibody treatment (for 1 month) at 4.5 months old. b Data represent mean ± SD (n represents biologically independent cell samples); cl data represent mean ± SEM (n represents biologically independent animals). b, one-way ANOVA with Tukey’s multiple comparisons. c, j two-way ANOVA with Sidak’s multiple comparisons. d-f, h, i, k, l Two-tailed unpaired Student’s t-test. Experiments in b, f, j, k were repeated independently three times, and results in ce, gi, l were repeated independently twice with similar results. Source data are provided as a Source Data file.

References

    1. Meng ZX, et al. Glucose sensing by skeletal myocytes couples nutrient signaling to systemic homeostasis. Mol. Cell. 2017;66:332–344.e334. doi: 10.1016/j.molcel.2017.04.007. - DOI - PMC - PubMed
    1. Meng ZX, et al. Baf60c drives glycolytic metabolism in the muscle and improves systemic glucose homeostasis through Deptor-mediated Akt activation. Nat. Med. 2013;19:640–645. doi: 10.1038/nm.3144. - DOI - PMC - PubMed
    1. Meng ZX, Wang L, Xiao Y, Lin JD. The Baf60c/Deptor pathway links skeletal muscle inflammation to glucose homeostasis in obesity. Diabetes. 2014;63:1533–1545. doi: 10.2337/db13-1061. - DOI - PMC - PubMed
    1. Meng ZX, et al. Uncoupling exercise bioenergetics from systemic metabolic homeostasis by conditional inactivation of Baf60 in skeletal muscle. Diabetes. 2018;67:85–97. doi: 10.2337/db17-0367. - DOI - PMC - PubMed
    1. Pedersen BK, Febbraio MA. Muscles, exercise and obesity: skeletal muscle as a secretory organ. Nat. Rev. Endocrinol. 2012;8:457–465. doi: 10.1038/nrendo.2012.49. - DOI - PubMed

Publication types

Substances