. 2023 Jul 19;14(1):4326.
doi: 10.1038/s41467-023-40044-z.

Nucleus reuniens transiently synchronizes memory networks at beta frequencies

Affiliations

Nucleus reuniens transiently synchronizes memory networks at beta frequencies

Maanasa Jayachandran et al. Nat Commun. .

Abstract

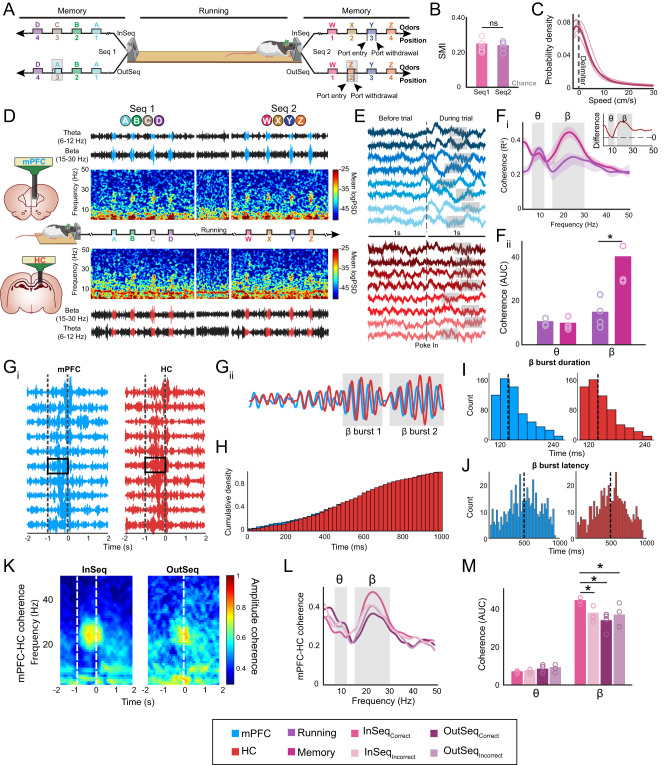
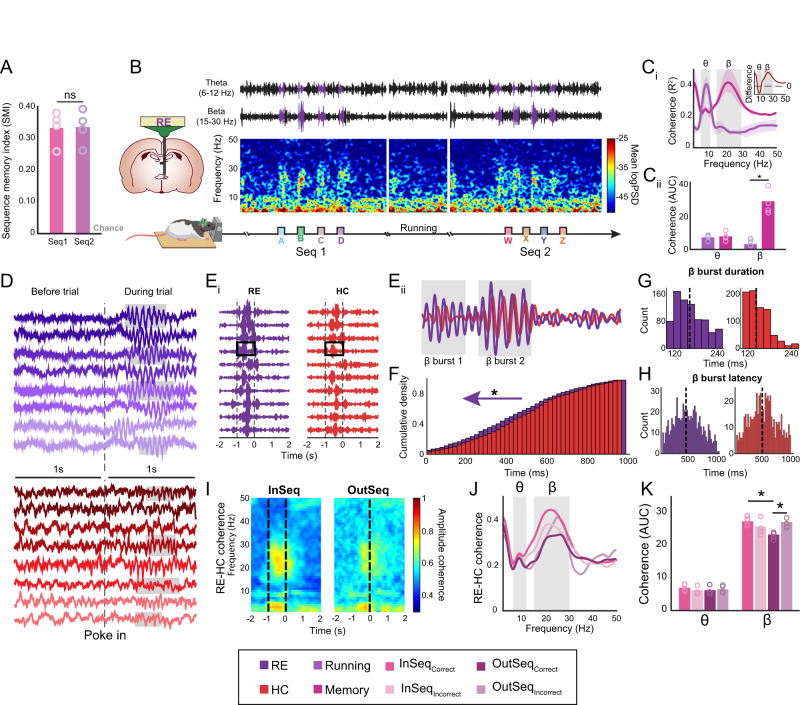
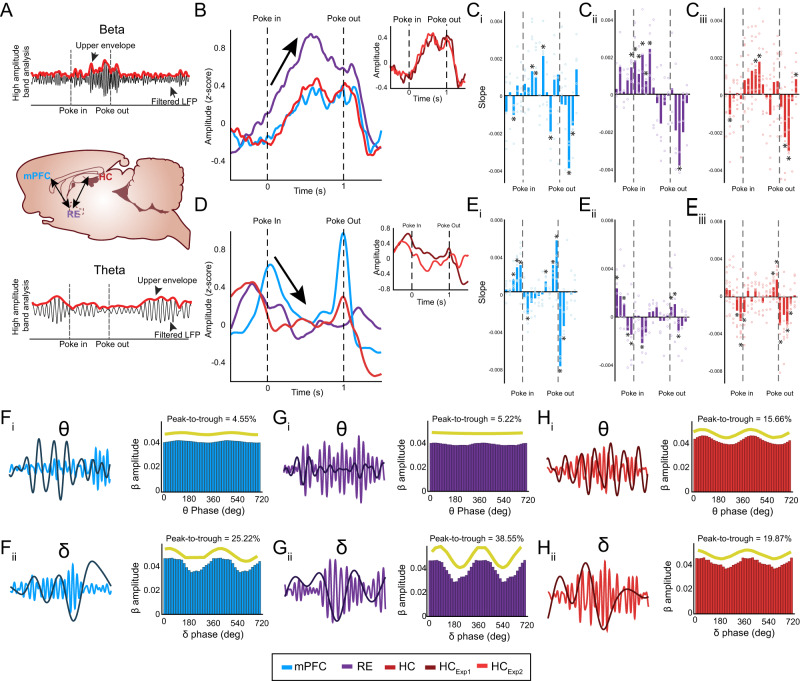
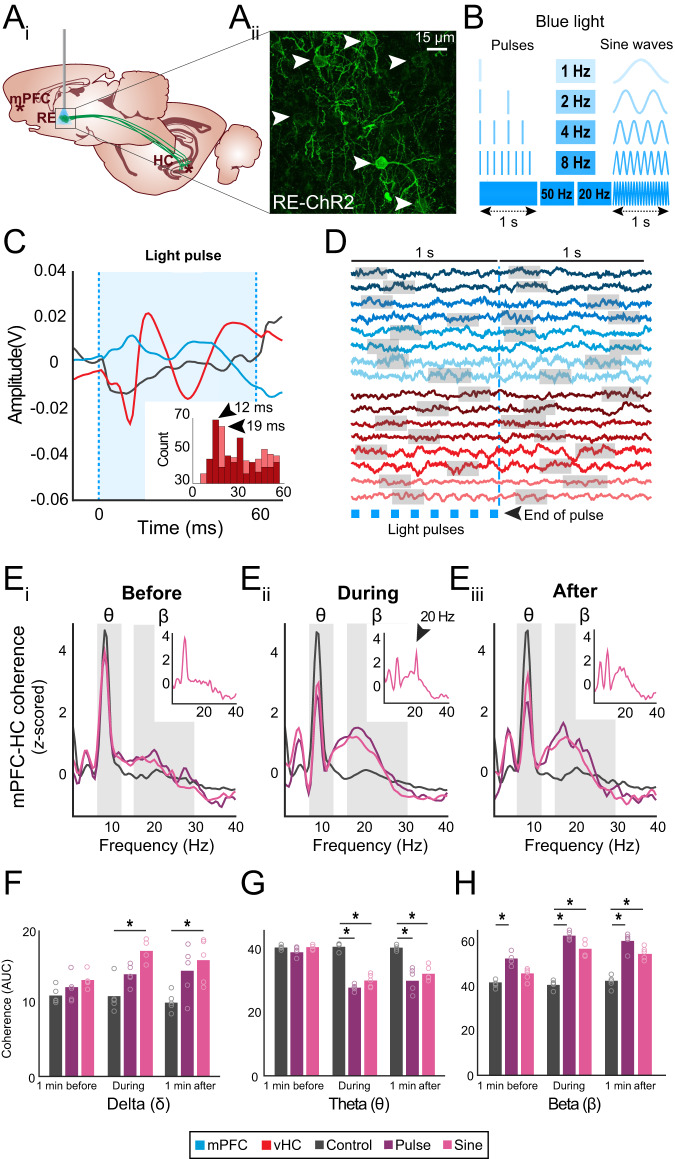
Episodic memory-based decision-making requires top-down medial prefrontal cortex and hippocampal interactions. This integrated prefrontal-hippocampal memory state is thought to be organized by synchronized network oscillations and mediated by connectivity with the thalamic nucleus reuniens (RE). Whether and how the RE synchronizes prefrontal-hippocampal networks in memory, however, remains unknown. Here, we recorded local field potentials from the prefrontal-RE-hippocampal network while rats engaged in a nonspatial sequence memory task, thereby isolating memory-related activity from running-related oscillations. We found that synchronous prefrontal-hippocampal beta bursts (15-30 Hz) dominated during memory trials, whereas synchronous theta activity (6-12 Hz) dominated during non-memory-related running. Moreover, RE beta activity appeared first, followed by prefrontal and hippocampal synchronized beta, suggesting that prefrontal-hippocampal beta could be driven by the RE. To test whether the RE is capable of driving prefrontal-hippocampal beta synchrony, we used an optogenetic approach (retroAAV-ChR2). RE activation induced prefrontal-hippocampal beta coherence and reduced theta coherence, matching the observed memory-driven network state in the sequence task. These findings are the first to demonstrate that the RE contributes to memory by driving transient synchronized beta in the prefrontal-hippocampal system, thereby facilitating interactions that underlie memory-based decision-making.


Conflict of interest statement

The authors declare no competing interests.

Figures

Fig. 1
Fig. 1. Prefrontal-hippocampal system shows transient beta coherence in nonspatial sequence memory.
A A linear track was used in which 2 separate 4-odor sequences were presented at opposite ends. Rats had to correctly identify the odor as either InSeq (hold ≥1 s) or OutSeq (hold <1 s). The rat image was modified and reproduced from Jayachandran and Allen. B The SMI did not differ significantly between Seq1 and Seq2 (t(4) = 0.22, p = 0.84; two sample t-test). Individual rat performance is indicated by the circles (n = 5). C Mean running speeds <10 cm/s represents 80% of the data. D) Representative spectrogram with corresponding filtered LFP from theta and beta bands in the mPFC (blue) and HC (red) during both sequences interleaved with a short running bout. Brain schematics are originals created using Paxinos and Watson outlines with permission. The rat image was modified and reproduced from Jayachandran and Allen. E Sample raw LFP in mPFC and HC. Each rat is indicated with a different shade of color. Beta bursts highlighted in gray. Fi mPFC-HC coherence differed significantly between running periods (non-memory) and memory (correct odor trials; n = 4). Inset shows the difference between memory and running. Fii The AUC analysis (two sample t-test) shows that the theta coherence was not significantly different between running and memory (p = 0.65; n = 4), while beta coherence differed significantly between running and memory (p = 0.01; n = 4). Gi Bandpass beta-filtered sample trials from mPFC and HC shows closely matched high amplitude beta ~100 ms after the poke-in. Gii A zoomed-in trial shows the bursty properties of beta. H The probability of beta burst occurrence in the mPFC and HC did not differ significantly (p = 0.98; two sample t-test). I The mean duration of a beta burst was not significantly different between the mPFC and HC (p = 0.48). J The latency to the first beta burst was not significantly different between the mPFC and HC (p = 0.95). K mPFC-HC coherence separated based on sequential context (InSeq vs OutSeq). L Coherence between InSeq and OutSeq trials separated based on accuracy. M InSeqcorrect Beta AUC was significantly higher compared to InSeqincorrect (p = 0.02), OutSeqcorrect (p = 0.01), and OutSeqincorrect (p = 0.02). Theta AUC was not significantly different across the 4 trial types (p = 0.21; n = 4; one-way ANOVA with Bonferroni correction). Abbreviations: mPFC, medial prefrontal cortex (Blue); HC, hippocampus (Red); InSeq, in-sequence; OutSeq, out-of-sequence; SMI, sequence memory index; Seq, sequence; LFP, local field potential; Running (Purple), Memory (Pink); AUC, area under the curve; InSeqcorrect, in-sequence correct (Dark Pink), InSeqincorrect, in-sequence incorrect (Light Pink), OutSeqcorrect, out-of-sequence correct (Dark Purple), OutSeqincorrect, out-of-sequence incorrect (Light Purple); θ, theta; β, beta; ns, not significant. All data are represented as mean ± SEM; *p < 0.05; ns, not significant. Source data are provided as a Source Data file.
Fig. 2
Fig. 2. Nonspatial sequence memory induces beta bursts in the RE.
A The SMI did not significantly differ between Seq1 and Seq2 (t(3) = −0.03, p = 0.98; two sample t-test). Circles indicate individual rat performance (n = 4). The rat image was modified and reproduced from Jayachandran and Allen. B Representative spectrogram with corresponding filtered LFP from theta and beta bands in the RE (purple) during both sequences with a sample running bout in between. High-power beta is aligned to the odor sampling period. Brain schematics are originals created using Paxinos and Watson outlines with permission. Ci RE-HC coherence was significantly different between running periods (non-memory) and memory (correct odor trials). Inset shows difference (memory–running; n = 4). Cii The AUC analysis (two sample t-test) shows that theta coherence was not significantly different between running and memory (p = 0.12; n = 4), while beta coherence differed significantly between running and memory (p = 7.8 × 10−5; n = 4). D Sample raw LFP in the RE (purple) and HC (red). Each rat is indicated with a different shade of color. Beta bursts are highlighted in gray. Ei Bandpass beta-filtered sample trials from the RE and HC shows that RE beta occurred earlier than HC beta. Eii A zoomed-in trial shows the bursty properties of beta with RE beta occurring earlier in the trial. F The probability of RE and HC beta burst occurrence differed significantly, with that in the RE occurring earlier (see purple arrow; p = 3.17 × 10−4; two sample t-test). G The mean duration of a beta burst was significantly longer in the RE than in the HC (p = 5.98 × 10−24). H The latency to the first beta burst was significantly earlier in the RE than in the HC (p = 0.01). I RE-HC coherence separated based on sequential context (InSeq vs OutSeq). J Coherence between InSeq and OutSeq trials were separated based on accuracy. K The InSeqcorrect beta AUC was significantly higher compared to the OutSeqcorrect (p = 0.01), and the OutSeqcorrect beta AUC was significantly lower than OutSeqincorrect (p = 0.01) beta AUC. Theta AUC was not significantly different across the 4 trial types (p = 0.84; n = 4; one-way ANOVA with Bonferroni correction). Abbreviations: RE, nucleus reuniens (Purple); HC, hippocampus (Red), SMI, sequence memory index; Seq, sequence; LFP, local field potential; Running (Purple); Memory (Pink) AUC, area under the curve; InSeq, in-sequence; OutSeq, out-of-sequence; InSeqcorrect, in-sequence correct (Dark Pink), InSeqincorrect, in-sequence incorrect (Light Pink), OutSeqcorrect, out-of-sequence correct (Dark Purple), OutSeqincorrect, out-of-sequence incorrect (Light Purple); θ, theta; β, beta; ns, not significant. All data are represented as mean ± SEM; *p < 0.05; ns, not significant. Source data are provided as a Source Data file.
Fig. 3
Fig. 3. Beta amplitudes rise earlier and stronger in RE and then concurrently in prefrontal cortex and hippocampus.
A Sample of upper envelope analysis for beta and theta. Brain schematics are originals created using Paxinos and Watson outlines with permission. B Beta amplitudes in the RE start rising just prior to trial onset (arrow). mPFC and HC beta simultaneously rises after the trial. Inset plot shows no significant difference between HC recordings. Ci Calculated slopes show that mPFC beta significantly rose after poke-in and then decreased after poke-out (p = 0.05; p = 0.01; p = 4.0 × 10−3; p = 0.04; p = 0.021; p = 0.01; p = 0.05; n = 5; one sample t-test). Cii RE beta slopes significantly rose before poke-in and continued to rise during the trial (p = 0.01; p = 0.01; p = 0.01; p = 0.04; p = 0.05; p = 0.02; p = 0.05; n = 4; one sample t-test). Ciii HC beta slopes show similar patterns to mPFC (p = 0.05; p = 0.03; p = 0.01; p = 0.03; p = 0.01; p = 0.05; n = 8; one sample t-test). D Theta amplitudes in RE and HC increase before a trial followed by an increase in the mPFC at the start of the trial. During the trial, there is a decrease in theta (arrow). Inset plot shows no significant difference between HC recordings. Ei Calculated slopes show that mPFC theta significantly rose before the start and end of a trial, while it decreased during the trial (p = 0.02; p = 0.01; p = 0.02; p = 0.02; p = 0.01; p = 2.0 × 10−3; p = 0.01; p = 0.02; p = 0.04; n = 5; one sample t-test). Eii RE theta slopes significantly rose before poke-in and decreased during the trial (p = 0.03; p = 0.05; p = 0.02; p = 0.01; p = 0.04; p = 0.05; p = 1.0 × 10−3; p = 0.03; n = 4; one sample t-test). Eiii HC theta slopes exhibited patterns similar to those of the RE and mPFC (p = 0.01; p = 0.02; p = 0.1; p = 0.01; p = 0.01; p = 0.03; p = 1.06 × 10−4; p = 0.04; n = 8; one sample t-test). Fi, Fii Sample of mPFC beta voltage (blue) superimposed with theta or delta voltage (dark blue). Fi Phase-amplitude plot from a rat showing beta amplitude was weakly modulated by theta phase. Fii Phase-amplitude plot showing beta amplitude was more modulated by delta phase. Gi, Gii Sample of RE beta voltage (purple) superimposed with theta and delta voltages (dark purple).Gi Phase-amplitude plot showing that beta amplitude was weakly modulated by theta phase. Gii Phase-amplitude plot from a rat showing that beta amplitude was more modulated by delta phase. Hi, Hii Sample of HC beta voltage (red) superimposed with theta voltage (dark red). Hi Phase-amplitude plot showing that beta amplitude was modulated by theta phase. Hii Phase-amplitude plot from a rat showing that beta amplitude was modulated by delta phase. Yellow waveforms represent the fitted curves to the amplitude–phase distributions. Abbreviations: mPFC, medial prefrontal cortex (Blue); RE, nucleus reuniens (Purple); HC hippocampus (Red), Exp experiment, HCExp1 (Dark Red) HCExp2 (Light Red), θ theta, δ delta, β beta. All data are represented as mean ± SEM; *p < 0.05; ns, not significant. Source data are provided as a Source Data file.
Fig. 4
Fig. 4. Optogenetic stimulation of RE drives beta coherence in prefrontal-hippocampal system.
Ai Bilateral injections of retrograde pAAV-Syn-ChR2(H134R)-GFP (experimental) or retrograde AAV-CAG-GFP (controls) were delivered in the vCA1 for the retrograde expression of RE neurons. Optic fiber implanted above the RE. Brain schematics are originals created using Paxinos and Watson outlines with permission. Aii Confocal image showing retrograde expression of ChR2 in RE neurons (white arrows). ChR2-expression was confirmed in all experimental rats (n = 5). B LED-based blue light pulse or sinewave stimulations were used to activate RE-ChR2 transduced rats. C Mean evoked responses in vCA1 resulting from 8-Hz stimulations in the RE in a control and an experimental subject. Stimulation of RE-ChR2 expressing neurons resulted in 2 consecutive negative deflections in HC (red). Mild to moderate LFP changes in mPFC activity were also observed (blue) in RE-ChR2 rats compared to controls (black). Pulse and sine stimulations were repeated across 3 different sessions in all rats. D Sample mean raw traces in mPFC (blue) and HC (red; 2 samples/experimental rat) showing a predominant beta rhythm 1 s prior and 1 s after the last optogenetic pulse. Gray boxes show high beta activity. E z-scored mPFC-HC coherence in RE-ChR2 and controls across 3 epochs: Ei 1-min before, all rats have similar theta and beta amplitude values, Eii during stimulation, marked increases in the beta band and a decrease in theta were observed in RE-ChR2 rats but not controls, Eiii 1-min after stimulation, coherence is similar to Eii. Notably, 20 Hz sine wave stimulations of RE-ChR2 neurons resulted in a large increase in beta and an additional sharp peak around 20 Hz that surpassed the amplitude of the delta and theta bands (Eii inset, black arrow); this effect was not seen before or after (Ei & Eiii inset). F Delta AUC coherence was significantly different across conditions (control/pulse/sinewave; p = 1.00 × 10−6) and time windows (before, during, after; p = 0.046; n = 5 per condition; one-way ANOVA with Bonferroni correction). G Theta AUC coherence was significantly different across conditions (p = 1.43 × 10−13) and time windows (p = 5.39 × 10−12; n = 5 per condition; one-way ANOVA with Bonferroni correction). H Beta AUC coherence was significantly different across conditions (p = 3.53 × 10−18) and time windows (p = 6.25 × 10−8; n = 5 per condition; one-way ANOVA with Bonferroni correction). All statistical tests are two tailed. AUC area under the curve, ChR2 channelrhodopsin, HC hippocampus (Red), min minute, ms milliseconds, mPFC medial prefrontal cortex (Blue), RE reuniens, vCA1 ventral CA1. Control (Black); Pulse (Purple); Sine (Pink). θ, theta; δ, delta; β, beta. All data are represented as mean ± SEM; *p < 0.05. Source data are provided as a Source Data file.

Similar articles

Cited by

References

    1. Allen TA, Fortin NJ. The evolution of episodic memory. PNAS. 2013;110:10379–10386. doi: 10.1073/pnas.1301199110. - DOI - PMC - PubMed
    1. Eichenbaum H. Prefrontal–hippocampal interactions in episodic memory. Nat. Rev. Neurosci. 2017;18:547–558. doi: 10.1038/nrn.2017.74. - DOI - PubMed
    1. Jayachandran M, et al. Prefrontal Pathways Provide Top-Down Control of Memory for Sequences of Events. Cell Rep. 2019;28:640–654.e6. doi: 10.1016/j.celrep.2019.06.053. - DOI - PMC - PubMed
    1. Ferbinteanu J, Kennedy PJ, Shapiro ML. Episodic memory—From brain to mind. Hippocampus. 2006;16:691–703. doi: 10.1002/hipo.20204. - DOI - PubMed
    1. Preston AR, Eichenbaum H. Interplay of Hippocampus and Prefrontal Cortex in Memory. Curr. Biol. 2013;23:R764–R773. doi: 10.1016/j.cub.2013.05.041. - DOI - PMC - PubMed

Publication types