

A detailed land use/land cover map for the European Alps macro region
- PMID: 37468492
- PMCID: PMC10356817
- DOI: 10.1038/s41597-023-02344-3
A detailed land use/land cover map for the European Alps macro region
Abstract
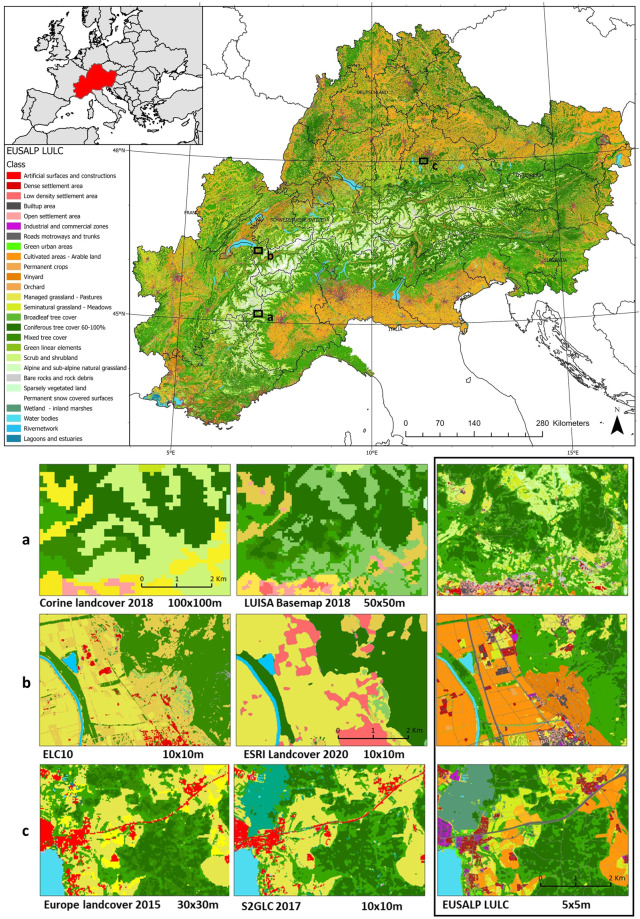
Spatially and thematically detailed land use maps are of special importance to study and manage populated mountain regions. Due to the complex terrain, high elevational gradients as well as differences in land demand, these regions are characterized by a high density of different land uses that form heterogeneous landscapes. Here, we present a new highly detailed land use/landcover map for the areas included in the European Strategy for the Alpine Region. The map has a spatial resolution of up to 5 m and a temporal extent from 2015 to 2020. It was created by aggregating 15 high-resolution layers resulting in 65 land use/cover classes. The overall map accuracy was assessed at 88.8%. The large number of land use classes and the high spatial resolution allow an easy customization of the map for research and management purposes, making it useable by a broad audience for various applications. Our map shows that by combining theme specific "high-resolution" land use products to build a comprehensive land use/land cover map, a high thematic and spatial detail can be achieved.
© 2023. The Author(s).
Conflict of interest statement
The authors declare no competing interests.
Figures


Similar articles
-
Extending coverage and thematic resolution of compositional land cover maps in a hierarchical Bayesian framework.Ecol Appl. 2021 Jul;31(5):e02318. doi: 10.1002/eap.2318. Epub 2021 Apr 28. Ecol Appl. 2021. PMID: 33665875
-
A large-area, spatially continuous assessment of land cover map error and its impact on downstream analyses.Glob Chang Biol. 2018 Jan;24(1):322-337. doi: 10.1111/gcb.13904. Epub 2017 Oct 12. Glob Chang Biol. 2018. PMID: 28921806
-
Spatial patterns of the United States National Land Cover Dataset (NLCD) land-cover change thematic accuracy (2001-2011).Int J Remote Sens. 2018;39(6):1729-1743. doi: 10.1080/01431161.2017.1410298. Int J Remote Sens. 2018. PMID: 29681670 Free PMC article.
-
Deriving spatially explicit water uses from land use change modelling results in four river basins across Europe.Sci Total Environ. 2018 Jul 1;628-629:1079-1097. doi: 10.1016/j.scitotenv.2018.02.051. Epub 2018 Feb 20. Sci Total Environ. 2018. PMID: 30045531
-
Phenological and elevational shifts of plants, animals and fungi under climate change in the European Alps.Biol Rev Camb Philos Soc. 2021 Oct;96(5):1816-1835. doi: 10.1111/brv.12727. Epub 2021 Apr 27. Biol Rev Camb Philos Soc. 2021. PMID: 33908168 Review.
Cited by
-
An annual land cover dataset for the Baltic Sea Region with crop types and peat bogs at 30 m from 2000 to 2022.Sci Data. 2024 Nov 18;11(1):1242. doi: 10.1038/s41597-024-04062-w. Sci Data. 2024. PMID: 39557873 Free PMC article.
-
Comprehensive dataset from high resolution UAV land cover mapping of diverse natural environments in Serbia.Sci Data. 2025 Jan 14;12(1):66. doi: 10.1038/s41597-025-04437-7. Sci Data. 2025. PMID: 39809785 Free PMC article.
-
Multispectral Light Detection and Ranging Technology and Applications: A Review.Sensors (Basel). 2024 Mar 4;24(5):1669. doi: 10.3390/s24051669. Sensors (Basel). 2024. PMID: 38475205 Free PMC article. Review.
-
Spatiotemporal patterns and drivers of orchard meadow loss in South Tyrol, Italy.Sci Rep. 2024 Dec 28;14(1):30812. doi: 10.1038/s41598-024-81077-8. Sci Rep. 2024. PMID: 39730465 Free PMC article.
-
Dynamic land-cover maps in the Guangdong-Hong Kong-Macao Greater Bay Area at 30 m spatial resolution, 2000-2022.Sci Data. 2025 Aug 18;12(1):1446. doi: 10.1038/s41597-025-05772-5. Sci Data. 2025. PMID: 40825791 Free PMC article.
References
-
- Fisher, P. F. & Wadsworth, R. Land use and Land cover: Contradiction or Complement. Chapter 6 in Re-Presenting GIS, Wiley (2005).
-
- Saah D, et al. Land Cover Mapping in Data Scarce Environments: Challenges and Opportunities. Front. Environ. Sci. 2019;7:150.
-
- Hock, R. et al. High Mountain Areas. In: IPCC Special Report on the Ocean and Cryosphere in a Changing Climate. Cambridge University Press, Cambridge, UK and New York, NY, USA, pp. 131–202. 10.1017/9781009157964.004 (2019).
Publication types
LinkOut - more resources
Full Text Sources
