. 2023 Jul 19;14(1):4140.
doi: 10.1038/s41467-023-38975-8.

A spatially anchored transcriptomic atlas of the human kidney papilla identifies significant immune injury in patients with stone disease

Affiliations

A spatially anchored transcriptomic atlas of the human kidney papilla identifies significant immune injury in patients with stone disease

Victor Hugo Canela et al. Nat Commun. .

Abstract

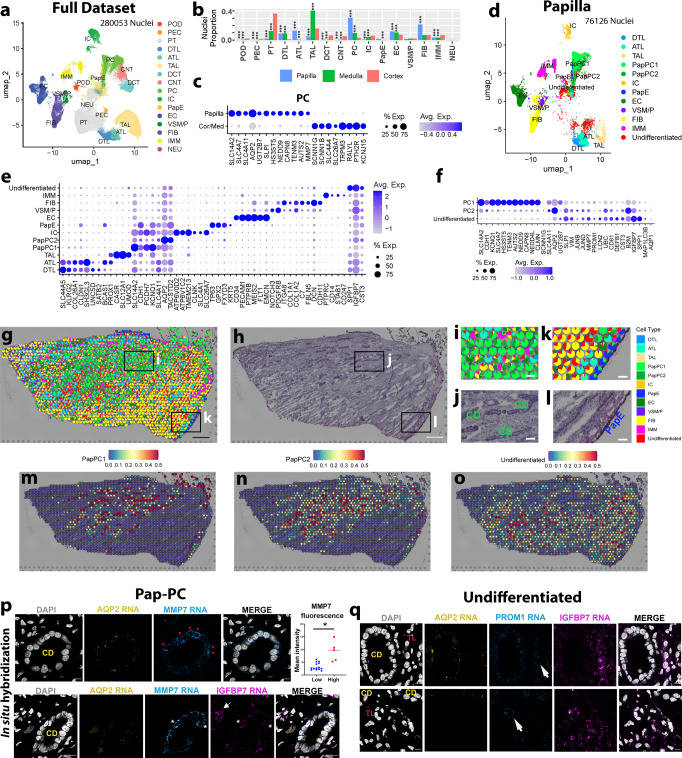
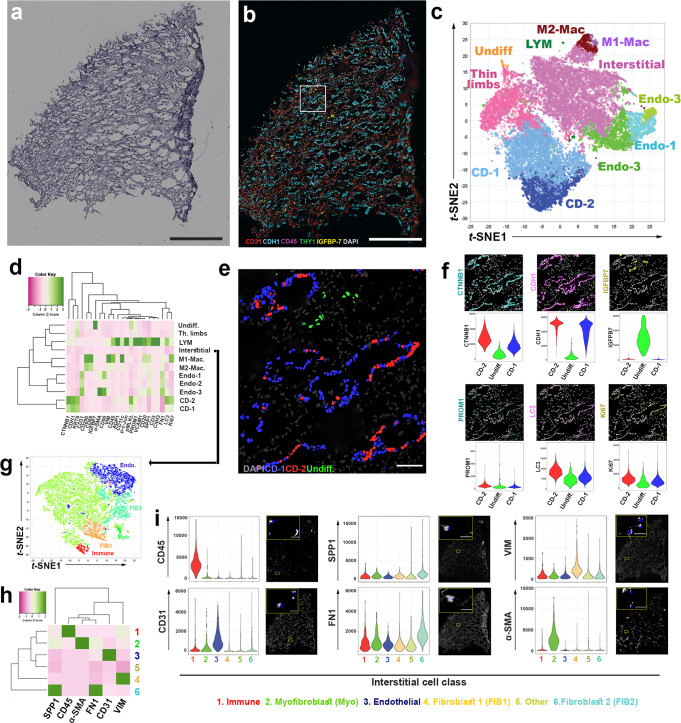
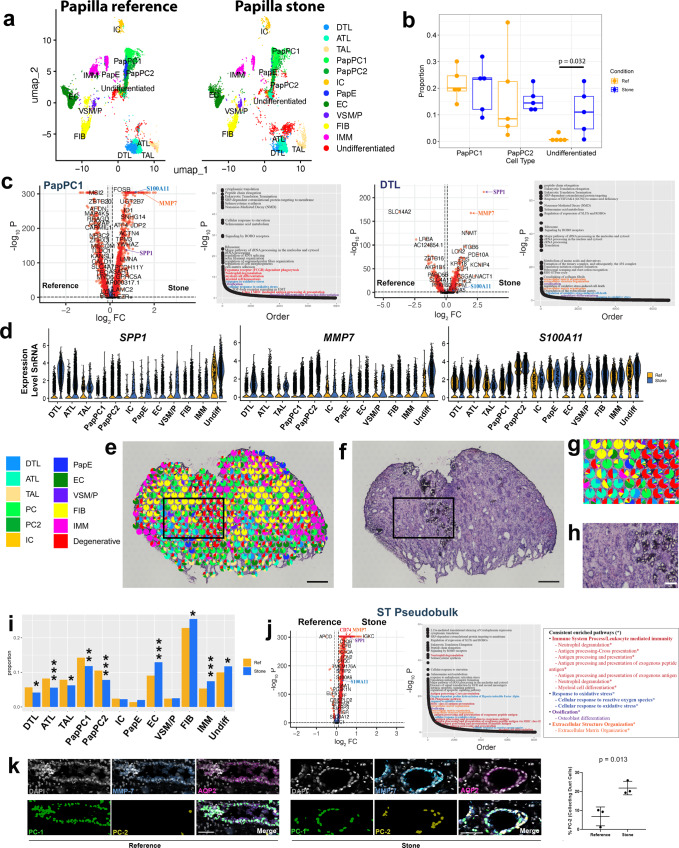
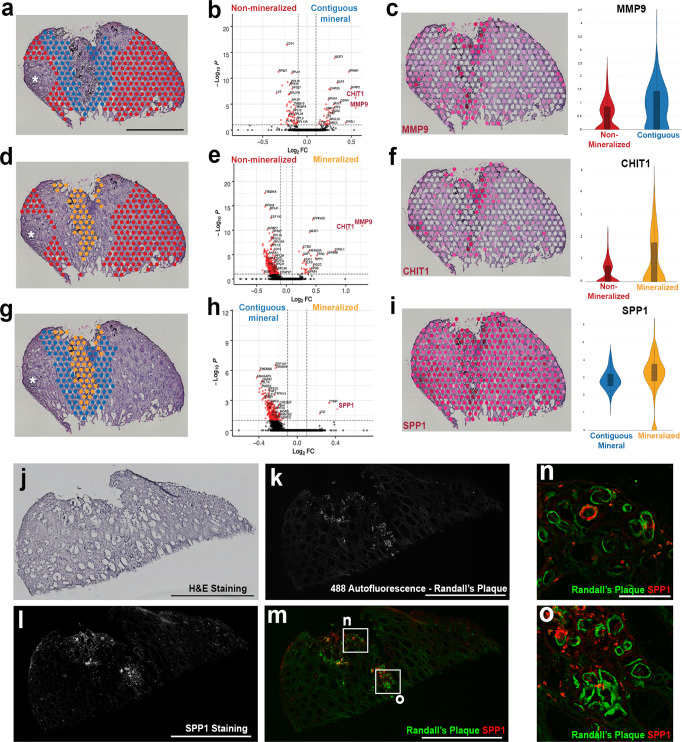
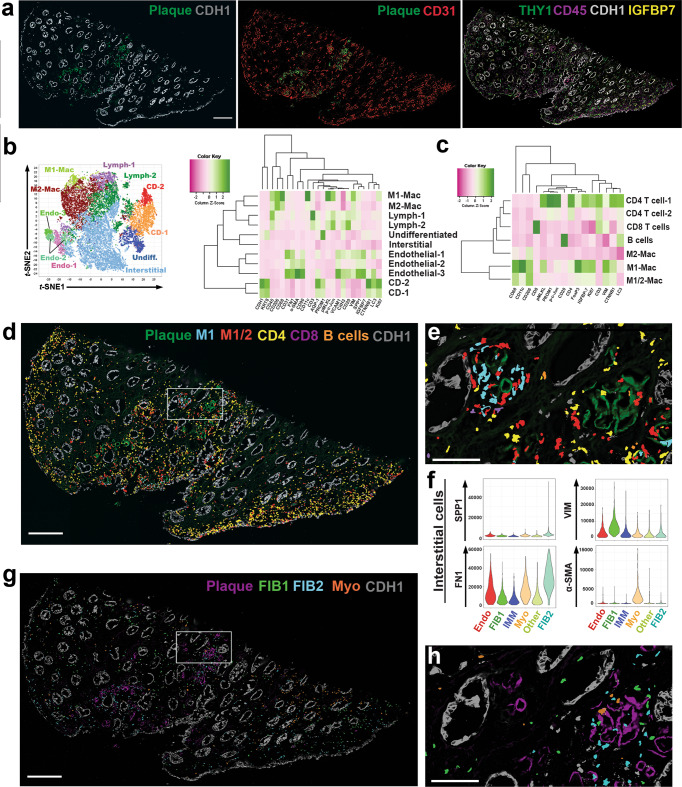
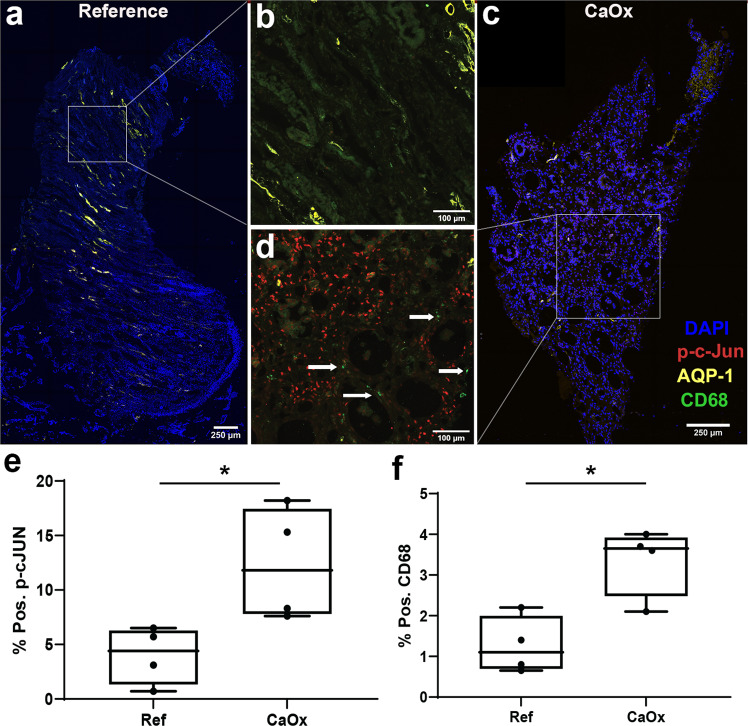
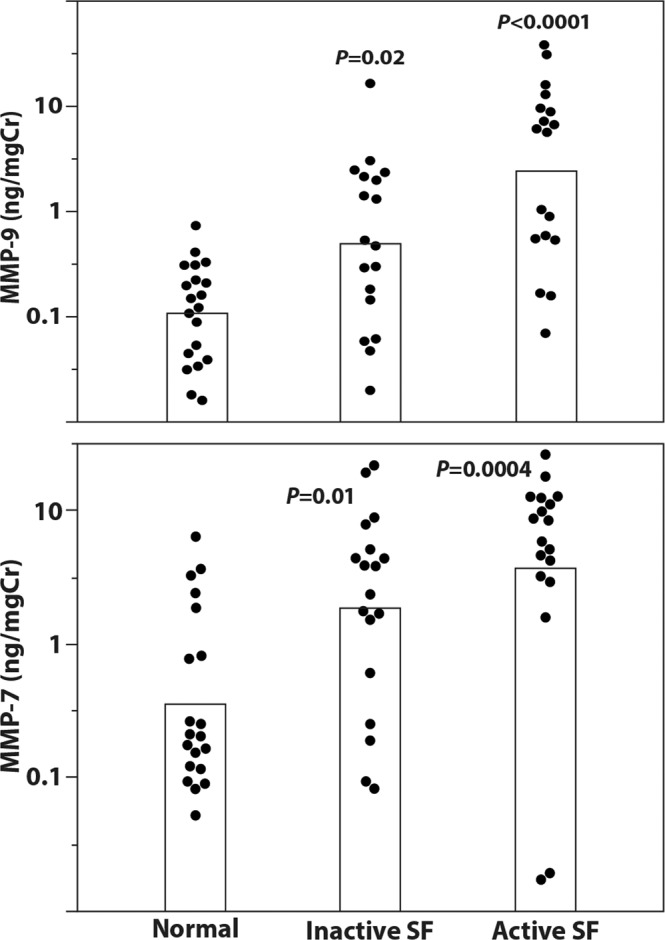
Kidney stone disease causes significant morbidity and increases health care utilization. In this work, we decipher the cellular and molecular niche of the human renal papilla in patients with calcium oxalate (CaOx) stone disease and healthy subjects. In addition to identifying cell types important in papillary physiology, we characterize collecting duct cell subtypes and an undifferentiated epithelial cell type that was more prevalent in stone patients. Despite the focal nature of mineral deposition in nephrolithiasis, we uncover a global injury signature characterized by immune activation, oxidative stress and extracellular matrix remodeling. We also identify the association of MMP7 and MMP9 expression with stone disease and mineral deposition, respectively. MMP7 and MMP9 are significantly increased in the urine of patients with CaOx stone disease, and their levels correlate with disease activity. Our results define the spatial molecular landscape and specific pathways contributing to stone-mediated injury in the human papilla and identify associated urinary biomarkers.


Conflict of interest statement

The authors declare no competing interests.

Figures

Fig. 1
Fig. 1. Spatially anchored cellular and molecular characterization of the human kidney papilla.
a Integrated KPMP/HuBMAP snRNAseq atlas combining nuclei from the renal cortex, medulla, papilla, with additional local papilla samples. b The proportion of cell type representation among nuclei by kidney region. *** denotes P < 0.0001 using two-tailed Fisher’s exact test compared to cortex. c Differential gene expression analysis of papillary principal cells (PC) reveals increased urate 2 transporter (SLC14A2) expression as compared to cortical or medullary PCs. d Subset atlas of nuclei specific to the papilla. e Gene expression profile of the papillary cells from (d). f Gene expression signatures of PapPC1, PapPC2, and undifferentiated cells in snRNAseq data, showing a spectrum of injury in the PapPC2 and undifferentiated cell types. g Label transfer of snRNAseq cell classes onto spatial transcriptomic spots within a reference papilla tissue, with underlying histology shown in (h). i, j An enlarged area denoted by the box in (g and h) showing PCs mapping on histologically identified collecting ducts. k, l An enlarged area denoted by the boxes in (g and h) showing papillary epithelial (Pap-E) cells mapping on histologically identified papillary epithelium. mo Feature plots showing the mapping of Pap-PC1, Pap-PC2, and undifferentiated cell signatures. Pap-PC1 and Pap-PC2 frequently overlay collecting duct (CD) histology. p Single molecule fluorescence in situ hybridization (smFISH) for cell markers from (f) to distinguish PapPC1 and PapPC2. Collecting ducts (CD) are morphologically distinct and express Aquaporin 2 (AQP2). Red asterisks denote cells with high MMP7 expression (Pap-PC2). MMP7 mean fluorescence intensity in these cells (n = 5) was significantly higher than other cells (n = 14) in that CD. (*p = 0.0001) by unpaired two-tailed t-test). The lower panel in (p) shows that few Pap-PC2 cells (white asterisks) also express IGFBP7, consistent with data in (f). The arrow shows undifferentiated cells outside of CD with high IGFBP7. q smFISH highlights undifferentiated cells frequently co-expressing IGFPB7 and PROM1 (arrows). These cells localize to the interstitium or in cells with morphology of thin limbs (TL). Extended data is shown in Supplementary Figs. 4 and 5. Scale bars: 0.5 mm in (g and h), 100 µm in (il), and 10 µm in (pq).
Fig. 2
Fig. 2. Co-detection by indexing (CODEX) multiplex imaging of a reference papilla tissue sample.
a H&E stained section that underwent CODEX imaging showing characteristic papillary morphology. b CODEX multiplex imaging displaying 6 markers (CD31- endothelial cells; Cadherin-1 (CDH1)- in papilla marks collecting ducts; CD45- pan immune marker; THY1 (also known as CD90)- marks pericytes; IGFBP7- Injury marker and DAPI- labels nuclei). c Unsupervised clustering and dimensionality reduction of the CODEX data in a t-stochastic neighborhood embedding (t-SNE) plot showing various cells classes, which were validated by the level of fluorescence intensity (heatmap in (d) and examining levels of fluorescence in (f)) and mapping back on the image (example in (e) for CD cells and more details also in Supplementary Figs. 7 and 8). e localization of CD-1, CD-2 and undifferentiated cells (Undiff.) in CODEX images using colored nuclear overlays. f shows the corresponding staining of various markers that characterized the profile of CD-1, CD-2 and Undiff. cells with the corresponding distribution of fluorescence intensity for these markers. CD-2 cells express higher levels of injury markers but are not segregated into separate tubules. Undifferentiated cells are localized to interstitium. g Re-clustering of interstitial cells based on specific markers h in CODEX data identifies populations of fibroblasts (2 subtypes, FIB1 and FIB2) and myofibroblasts (Myo), which were mapped into the interstitium as shown in panel i for each marker. Scale bars: (0.5 mm in a, b, 0.1 mm in e/f and 0.02 mm in (i)). Other abbreviations listed: Endo = endothelial cells; LYM = lymphocytes; Th. Limbs = thin limbs.
Fig. 3
Fig. 3. Differentially expressed genes (DEGs) and cell states induced by stone disease within the human papilla.
a UMAPs display cell types clustered from snRNA sequencing in papillary reference and stone samples, highlighting the expansion of the undifferentiated cell population in stone disease. b Proportion of PapPC1, PapPC2 and undifferentiated cell types for each specimen (n = 5 stone and n = 5 reference independent papillary specimens), validated the expansion of the undifferentiated population (box plots display median and interquartile range; two-tailed Wilcoxon rank sum test was used). c DEGs (two-tailed Wilcoxon rank sum test) and enriched pathways (overrepresentation test, see methods) in papillary cells by snRNAseq, focusing on PapPC1 and descending thin limbs (DTL, a cell important in stone disease pathogenesis). DEGs for other cell types are shown in Supplementary Figs. 10–11. Pathway analysis detected significant upregulation of ossification (purple), extracellular matrix organization (orange), response to oxidative stress (blue) and immune system process /leukocyte activation pathways (red text). d Expression of SPP1, MMP7 and S100A11 are consistently induced in stone disease across papillary cell types. e Label transfer of cell classes onto spatial transcriptomic spots in a stone disease papilla with underlying H&E histology (f). g An enlarged area from (e and f) showing the undifferentiated cell signature localizing to areas of mineralization (h). The distribution of cell signatures (percent of total spots for reference vs stone disease) in ST specimens is shown in (i). *p < 0.01, **p < 0.001 and ***p < 0.0001 (two-tailed Fisher’s exact test). j DEGs between pseudobulk (combined gene expression of spots) of reference (left) and CaOx stone ST samples (two-tailed Wilcoxon rank sum test). Differentially enriched pathways (overrepresentation test) in stone disease are illustrated in the pathway curve. Consistently enriched pathways that were common in each individual sample (N = 6) compared to reference samples (N = 4) are listed. k Analysis of MMP7 protein expression using 3D imaging and tissue cytometry (N = 3 reference and N = 3 stone specimens), showing a higher proportion of MMP7 high cells (PapPC2) within collecting ducts in stone disease vs. reference (mean ± standard deviation (error bars); p = 0.041 -unpaired two-tailed t-test). Scale: e, f = 300 µm; g, h = 100 µm; k = 10 µm.
Fig. 4
Fig. 4. Signatures of injury and inflammation are localized to regions of mineralization in a kidney papilla with stone disease.
a Regions of non-mineralization (n = 413 spots) compared to areas contiguous to mineral (n = 204 spots) display differentially expressed genes (DEGs) (by two-tailed Wilcoxon rank sum test) associated with pathways of leukocyte activation, such as MMP9 and CHIT1 (b). Scale = 1000 µm. MMP9 expression localizes in areas contiguous to minerals and in regions of mineralization (c). d Comparisons between areas of non-mineralization (n = 413 spots) and areas of mineralization (n = 95 spots) also display DEGs (two-tailed Wilcoxon rank sum test) such as MMP9 and CHIT1 (e). CHIT1 expression also appears to be more robust in areas of mineralization (f ). Regional comparison between areas contiguous to mineral (n = 204 spots) and areas of mineralization (n = 95 spots) is shown in (g). SPP1, TYMP, and LYZ were differentially expressed (two-tailed Wilcoxon rank sum test) in areas of mineralization in this CaOx biopsy specimen (h). SPP1 appears to be localized to regions of mineralization but also displays relatively high expression throughout this stone-forming papilla (i). Violin plots show Log-Normalized values. Asterisks in a, d, and g denote that the analysis excluded the areas of mineralized plug and was restricted to Randall’s plaque (RP). Box plots in c, f and i display the mean, median, interquartile and 95% range. H&E staining (j) corresponding to a papillary biopsy section with RP mineral deposition from a stone patient that was imaged using CODEX multiplexed imaging (ko and Fig. 5). Scale = 1000 µm. 488 autofluorescence shows regions of RP (k). SPP1 staining is shown in (l). Overlayed images from (k) and (l) show association between RP and SPP1 (m). Scale in km = 1000 µm. Boxed regions highlighted in m are enlarged in (n) and (o) to show regions where RP and SPP1 co-localize. Scale = 10 µm.
Fig. 5
Fig. 5. CODEX imaging of a papilla with mineral deposition identifies various stages of immune activation and fibrosis around the plaque.
a CODEX imaging showing unique autofluorescence of the plaque, which can be easily delineated from the epithelial and vascular cells. b Unsupervised analysis and clustering identify similar clusters as in the reference specimen (Fig. 1), with extensive expansion of the immune clusters. c Re-clustering and analysis of the immune cells identifies all the major subtypes of leukocytes. Macrophages had an intermediate phenotype between M1 and M2 based on the co-expression of specific markers. d Mapping of immune cells in the tissue (using nuclear overlays) reveals niches of immune activity in certain plaque areas (area of mineral on left in (e), which is a high magnification view of the boxed area in (d)) with features of antigen presentation (interaction of antigen presenting macrophages with T and B cells) and a diffuse activated T cells response, particularly towards the papillary endothelium. Interstitial cells from (b) were re-clustered and analyzed (similar analysis as detailed in Fig. 2g, h) based on specific markers. f The levels of a few markers of interest are displayed based on interstitial cell class. Fibroblasts and myofibroblasts were abundant throughout the tissue (g), but fibroblasts were concentrated in certain areas of mineral deposition with reduced immune activity (area of mineral on right in (h), which is a high magnification view of the same boxed area in (d) and (g)), suggesting progression from inflammation to fibrosis in neighboring areas within the same tissue. Scales bars: 500 µm in (a), (d) and (g); 100 µm for (e) and (h).
Fig. 6
Fig. 6. Protein markers of oxidative stress (ROS) and macrophage activation are diffusely increased in biopsies of stone patients.
ad Representative multi-fluorescence confocal images of kidney papillary biopsies from stone patients and reference nephrectomy tissue specimens (n = 4 stone and n = 4 refence independent tissue specimens) stained for phospho-c-JUN (p-c-Jun, marker of ROS), CD68 (activated macrophages) and Aquaporin1 (AQP-1, marker for thin descending limbs and descending vasa recta). Images were analyzed using volumetric tissue exploration and analysis (VTEA) software and the resulting outcomes are shown in (e) and (f) for p-c-JUN and CD68 as percentages of total cells in each tissue. Box plots show mean, interquartile range, minimum and maximum values. Boxed areas in (a) and (c) are enlarged in (b) and (d), respectively. Arrows in d shows CD68+ macrophages. Scale bars are 250 µm (a and c) and 100 µm (bd). * p = 0.03 and 0.01 for reference vs. control for p-c-JUN and CD68, respectively, using a two tailed unpaired t-test.
Fig. 7
Fig. 7. MMP7 and MMP9 levels are increased in urine of CaOx stone patients and correlate with disease activity.
Urine samples were taken either from CaOx stone patients undergoing surgery for stone removal (active stone formers, SF, N = 18) or from patients who had previously been stone formers (Inactive SF, N = 18) or from healthy volunteers (N = 20). Demographics and relevant clinical variables for each group are presented in Supplementary Table 4. Samples were assayed for urine MMP7, MMP9, and urine creatinine (Cr) by ELISA according to the manufacturer’s instructions. Samples are plotted as log10(ng MMP/mg Cr, top panel for MMP9 and bottom panel for MMP7). Statistical comparisons between groups were done using two-tailed ANOVA with the Tukey-Kramer post hoc test.

Similar articles

Cited by

References

    1. Worcester EM, Coe FL. Clinical practice. Calcium kidney stones. N. Engl. J. Med. 2010;363:954–963. - PMC - PubMed
    1. Howles SA, Thakker RV. Genetics of kidney stone disease. Nat. Rev. Urol. 2020;17:407–421. - PubMed
    1. Khan SR, Canales BK, Dominguez-Gutierrez PR. Randall’s plaque and calcium oxalate stone formation: role for immunity and inflammation. Nat. Rev. Nephrol. 2021;17:417–433. - PubMed
    1. Khan SR, Rodriguez DE, Gower LB, Monga M. Association of Randall plaque with collagen fibers and membrane vesicles. J. Urol. 2012;187:1094–1100. - PMC - PubMed
    1. Joshi S, Clapp WL, Wang W, Khan SR. Osteogenic changes in kidneys of hyperoxaluric rats. Biochim Biophys. Acta. 2015;1852:2000–2012. - PMC - PubMed

Publication types