

Biobank-scale methods and projections for sparse polygenic prediction from machine learning
- PMID: 37468507
- PMCID: PMC10356957
- DOI: 10.1038/s41598-023-37580-5
Biobank-scale methods and projections for sparse polygenic prediction from machine learning
Abstract
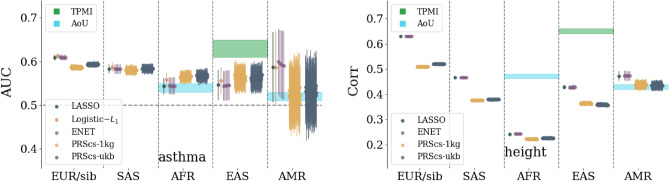
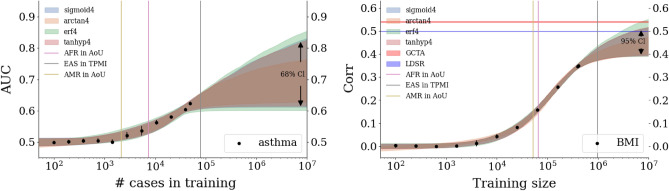
In this paper we characterize the performance of linear models trained via widely-used sparse machine learning algorithms. We build polygenic scores and examine performance as a function of training set size, genetic ancestral background, and training method. We show that predictor performance is most strongly dependent on size of training data, with smaller gains from algorithmic improvements. We find that LASSO generally performs as well as the best methods, judged by a variety of metrics. We also investigate performance characteristics of predictors trained on one genetic ancestry group when applied to another. Using LASSO, we develop a novel method for projecting AUC and correlation as a function of data size (i.e., for new biobanks) and characterize the asymptotic limit of performance. Additionally, for LASSO (compressed sensing) we show that performance metrics and predictor sparsity are in agreement with theoretical predictions from the Donoho-Tanner phase transition. Specifically, a future predictor trained in the Taiwan Precision Medicine Initiative for asthma can achieve an AUC of [Formula: see text] and for height a correlation of [Formula: see text] for a Taiwanese population. This is above the measured values of [Formula: see text] and [Formula: see text], respectively, for UK Biobank trained predictors applied to a European population.
© 2023. The Author(s).
Conflict of interest statement
The authors declare the following competing interests: SDHH is a founder, shareholder, and serves on the Board of Directors of Genomic Prediction, Inc. (GP). EW and LL are employees and shareholders of GP. TGR declares no competing interests.
Figures
Similar articles
-
Efficient blockLASSO for polygenic scores with applications to all of us and UK Biobank.BMC Genomics. 2025 Mar 27;26(1):302. doi: 10.1186/s12864-025-11505-0. BMC Genomics. 2025. PMID: 40148775 Free PMC article.
-
Combining machine learning with Cox models to identify predictors for incident post-menopausal breast cancer in the UK Biobank.Sci Rep. 2023 Jun 7;13(1):9221. doi: 10.1038/s41598-023-36214-0. Sci Rep. 2023. PMID: 37286615 Free PMC article.
-
A fast and scalable framework for large-scale and ultrahigh-dimensional sparse regression with application to the UK Biobank.PLoS Genet. 2020 Oct 23;16(10):e1009141. doi: 10.1371/journal.pgen.1009141. eCollection 2020 Oct. PLoS Genet. 2020. PMID: 33095761 Free PMC article.
-
Fused Group Lasso Regularized Multi-Task Feature Learning and Its Application to the Cognitive Performance Prediction of Alzheimer's Disease.Neuroinformatics. 2019 Apr;17(2):271-294. doi: 10.1007/s12021-018-9398-5. Neuroinformatics. 2019. PMID: 30284672
-
Fracture risk prediction in postmenopausal women with traditional and machine learning models in a nationwide, prospective cohort study in Switzerland with validation in the UK Biobank.J Bone Miner Res. 2024 Aug 21;39(8):1103-1112. doi: 10.1093/jbmr/zjae089. J Bone Miner Res. 2024. PMID: 38836468
Cited by
-
Validation of GenProb-T1D and its clinical utility for differentiating types of diabetes in a biobank from a US healthcare system.J Diabetes Investig. 2025 Jan;16(1):10-15. doi: 10.1111/jdi.14297. Epub 2024 Aug 22. J Diabetes Investig. 2025. PMID: 39171755 Free PMC article.
-
Efficient blockLASSO for polygenic scores with applications to all of us and UK Biobank.BMC Genomics. 2025 Mar 27;26(1):302. doi: 10.1186/s12864-025-11505-0. BMC Genomics. 2025. PMID: 40148775 Free PMC article.
-
EndoPRS: Incorporating endophenotype information to improve polygenic risk scores for clinical endpoints-A study in asthma.Am J Hum Genet. 2025 May 1;112(5):1199-1214. doi: 10.1016/j.ajhg.2025.03.008. Epub 2025 Apr 8. Am J Hum Genet. 2025. PMID: 40203832
-
EndoPRS: Incorporating Endophenotype Information to Improve Polygenic Risk Scores for Clinical Endpoints.medRxiv [Preprint]. 2024 May 24:2024.05.23.24307839. doi: 10.1101/2024.05.23.24307839. medRxiv. 2024. Update in: Am J Hum Genet. 2025 May 1;112(5):1199-1214. doi: 10.1016/j.ajhg.2025.03.008. PMID: 38826253 Free PMC article. Updated. Preprint.
-
Polygenic height prediction for the Han Chinese in Taiwan.NPJ Genom Med. 2025 Feb 5;10(1):7. doi: 10.1038/s41525-025-00468-6. NPJ Genom Med. 2025. PMID: 39910149 Free PMC article.
References
-
- TOPMed https://www.nhlbiwgs.org/.
-
- UK Biobank Available online. http://www.ukbiobank.ac.uk/. Accessed: 21 March 2021.
-
- Taiwan Precision Medicine Initiative. https://tpmi.ibms.sinica.edu.tw/www/en/. Accessed 01 Feb 2023.
