. 2023 Jul 19;14(1):4352.
doi: 10.1038/s41467-023-40134-y.

Highly specific and non-invasive imaging of Piezo1-dependent activity across scales using GenEPi

Affiliations

Highly specific and non-invasive imaging of Piezo1-dependent activity across scales using GenEPi

Sine Yaganoglu et al. Nat Commun. .

Erratum in

Abstract

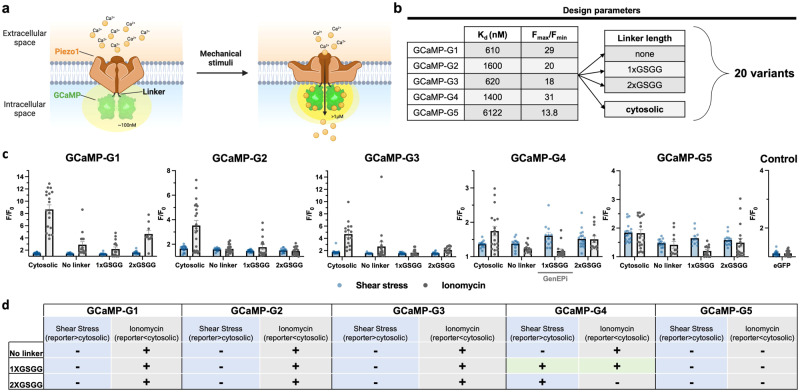
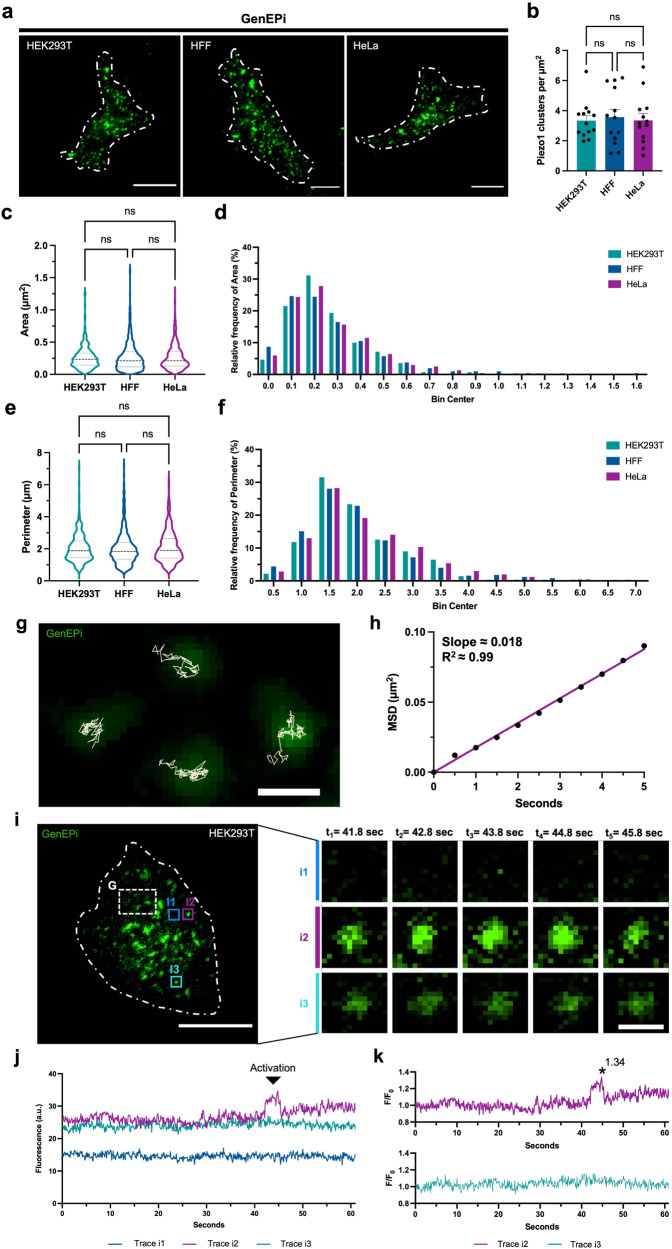
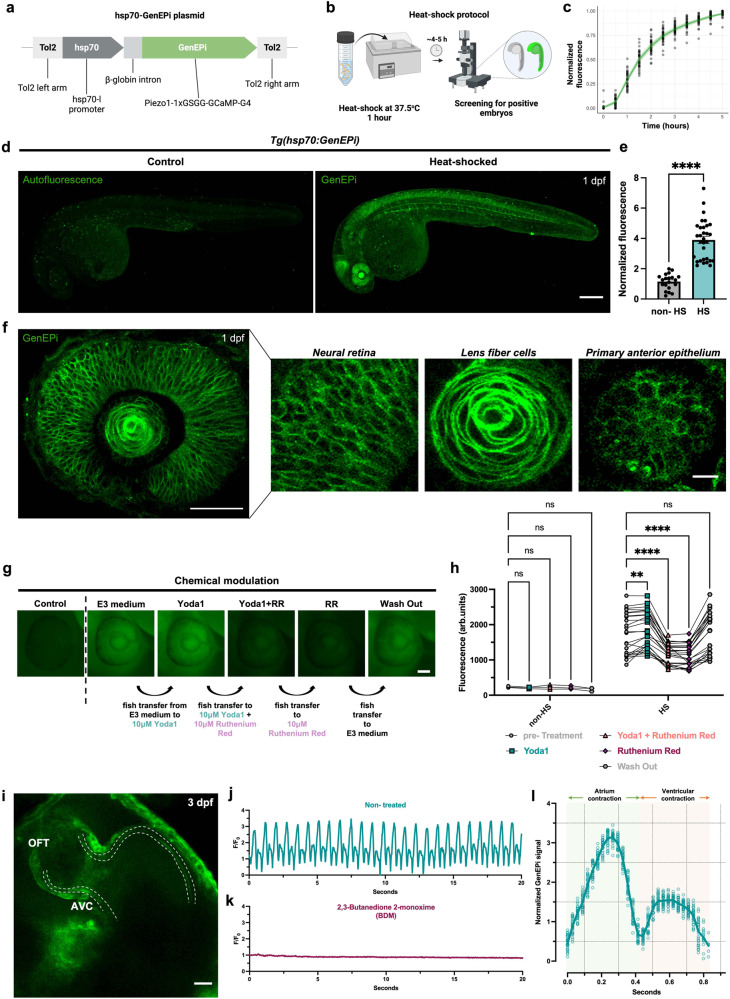
Mechanosensing is a ubiquitous process to translate external mechanical stimuli into biological responses. Piezo1 ion channels are directly gated by mechanical forces and play an essential role in cellular mechanotransduction. However, readouts of Piezo1 activity are mainly examined by invasive or indirect techniques, such as electrophysiological analyses and cytosolic calcium imaging. Here, we introduce GenEPi, a genetically-encoded fluorescent reporter for non-invasive optical monitoring of Piezo1-dependent activity. We demonstrate that GenEPi has high spatiotemporal resolution for Piezo1-dependent stimuli from the single-cell level to that of the entire organism. GenEPi reveals transient, local mechanical stimuli in the plasma membrane of single cells, resolves repetitive contraction-triggered stimulation of beating cardiomyocytes within microtissues, and allows for robust and reliable monitoring of Piezo1-dependent activity in vivo. GenEPi will enable non-invasive optical monitoring of Piezo1 activity in mechanochemical feedback loops during development, homeostatic regulation, and disease.


Conflict of interest statement

The authors declare no competing interests.

Figures

Fig. 1
Fig. 1. Design and systematic screen to identify an optical reporter of Piezo1 activity.
a Schematic of the reporter working principle. A low-affinity GCaMP is targeted near the C-terminal site of the Piezo1 channel. When mechanical stimuli induce channel opening, incoming Ca2+ (in yellow) binds to GCaMP, causing an increase in green fluorescence. b Design of the reporter screen. Five different GCaMPs with low affinity for Ca2+ (GCaMP-G1 to -G5) were fused to the C-terminus of human Piezo1 without any linker, with the addition of a short linker (i.e., 1xGly-Ser-Gly-Gly (1xGSGG) linker sequence) and long linker (i.e., 2xGSGG linker sequence). c Results of the reporter screen. The response of the resulting 20 variants (including the co-transfected cytosolic GCaMPs and human Piezo1) to shear stress (10 dyne/cm2, blue) and ionomycin (1 µM, grey) and identified Piezo1-1xGSGG-GCaMP-G4 (GenEPi) as a specific reporter for mechanical stimuli. eGFP fused to human Piezo1 serves as a control for the noise acquired during imaging under either stimulus. Data are presented as means ± SEM. Data from three independent experiments. For detailed statistical information for the screen, see Supplementary Table 3. d Summary of systematic screening results that illustrate which tested variant fulfilled our key requirements (here: higher response to shear stress and lower response to ionomycin administration compared to the cytosolic response). The only variant which fulfilled both initial requirements (statistically significant) was the fusion Piezo1-1XGSGG-GCaMP-G4 which is labeled with green shading. Source data are provided as a Source Data file.
Fig. 2
Fig. 2. GenEPi specifically reports Piezo1-dependent activity without affecting the functionality of the channel.
a Representative example of GenEPi activation and b F/F0 signal intensity profile (black) in response to 10 dyne/cm2 shear stress (green) in HEK293T cells. Time stamps in the images correspond to the stimulation and response profile in the graph. Scale bar, 10 μm. c Response of HEK293T cells expressing Piezo1 and GCaMP-G4 (n = 13, shear stress; n = 18, ionomycin), GenEPi (n = 12, shear stress; n = 15, ionomycin), or Piezo1-eGFP (n = 16, shear stress, n = 19, ionomycin) to shear stress and ionomycin. Two-tailed Mann–Whitney test, ****p < 0.0001; *p < 0.05; n.s. = p > 0.05, data from three independent experiments. Data were presented as means ± SEM. d Response of GenEPi-expressing HEK293T cells to 10 μM Yoda1 (n = 14) or DMSO (n = 17). Two-tailed Mann–Whitney test, ****p < 0.0001, data from three independent experiments. Data were presented as means ± SEM. e Response of GenEPi and jRCaMP1a expressing HEK293T cells (n = 19) to intracellular Ca2+ triggered by 30 μM ATP. Two-tailed unpaired t-test, ****p < 0.0001, data from six independent experiments. Data were presented as means ± SEM. f Representative images of AFM cantilever stimulation of GenEPi-expressing HEK293T cells stimulated by the compressing AFM cantilever. Brightfield image of cantilever position before (top left) and during stimulation (top right) and corresponding fluorescent images of the stimulated cell before and after stimulation. Scale bar, 10 μm. g The mechanical stimulation procedure of compressive forces ranging from 100–400 nN (purple) along with the brightfield (gray) and fluorescent (green) traces from the cell depicted in f. h Amplitude of Ca2+ responses from GenEPi (n = 21), and Piezo-eGFP (n = 45) expressing cells. Data were presented as means ± SEM. Two-tailed Mann–Whitney test, ****p < 0.0001. i Amplitude of Ca2+ responses of GenEPi in cells transfected with GenEPi before (n = 13) and after addition of 3 μM GsMTx-4 (n = 11). Data were presented as means ± SEM. Two-tailed Mann–Whitney test, ****p < 0.0001. j Threshold forces and pressures for cells co-transfected with human Piezo1 and cytosolic GCaMP-G4 (n = 21), n.s. = p > 0.05, Data were presented as means ± SEM. Two-tailed unpaired t-test. k Duration of Ca2+ responses from cells co-transfected with cytosolic GCaMP-G4 and human Piezo1 (n = 27) and GenEPi (n = 16). Two-tailed Mann–Whitney test, ****p < 0.0001. Data were presented as means ± SEM. Data from three independent experiments. l Representative traces of the currents from wild-type Piezo1 (black) and GenEPi (green) evoked by the negative pressure of 0, −20, −40, −60, −80, and −100 mmHg at −80 mV with the cell-attached recording configuration. The current evoked by individual negative pressure was normalized to the maximum evoked by the negative pressure of −100 mmHg. m Both wild-type Piezo1 (n = 8 cells; 8 experiments) (black) and GenEPi (n = 6 cells; 6 experiments) (green) show a similar pressure-dependent response. Data were presented as means ± SEM. Two-tailed unpaired t-test, p = 0.11, p = 0.06, p = 0.20, and p = 0.07 for pressure sensitivities to −20, −40, −60, and −80 mmHg between Piezo1 and GenEPi. n Representative traces of wild-type Piezo1 (black) or GenEPi (green) currents evoked by −60 mmHg pressure at different voltages of +30, −30, −50, and −80 mV. o The conductance value for wild-type Piezo1 (black) is 24.9 ± 0.8 pS (n = 6 cells from six experiments, mean ± SEM) and the conductance value for GenEPi (green) is 25.5 ± 0.6 pS (n = 6 cells from six experiments, mean ± SEM). Both channels show the typical 25 pS conductance of the Piezo1 channel, indicating that the ion selectivity of Piezo1 is preserved within GenEPi. p Example traces of wild-type Piezo1 channels (black) or GenEPi (green) activated by 0.1, 0.3, 1, 3, 10 µM Yoda1 in the absence of mechanical stimulation. After the channel activities were evoked by 10 µM Yoda1, 10 µM ruthenium red (RR) was used to inhibit the currents (blue). Source data are provided as a Source Data file.
Fig. 3
Fig. 3. GenEPi captures Piezo1-dependent activity to transient, local mechanical stimuli on the cell membrane.
a Representative TIRFM images from the cell-substrate interface of live HEK293T, HFF, and HeLa cells expressing GenEPi. Scale bar, 10 μm. b Number of GenEPi clusters per cell in HEK293T, HFF, and HeLa cells expressing GenEPi. n = 13 cells, error bar: SEM. Ordinary one-way ANOVA test. cf Quantification of GenEPi cluster area and perimeter as violin plots in HEK293T, HFF, and HeLa cells expressing GenEPi. HEK293T cells (n = 279), HFF cells (n = 503), HeLa cells (n = 669); n = 1 represent a single GenEPi (Piezo1) cluster. Kruskal–Wallis test. g Tracking of GenEPi (Piezo1) clusters imaged at 10 frames per second in live HEK293T cells reveals the motility of the channel clusters. The background image shows the fluorescence of GenEPi clusters captured during a single imaging frame (rectangular region (G) in image i, two-pixel median filter applied in FiJi/ImageJ (see Methods, Image processing and analysis). White lines depict the tracks of these clusters over several successive frames. Scale bar, 1 μm. h Mean-squared displacement calculated from 5332 GenEPi tracks plotted as a function of time. Data fit to a straight line with a slope corresponding to a two-dimensional (2D) diffusion coefficient of 0.0044 µm2/s. R2 for linear fit to data is 0.9969. i Representative time-lapse images of GenEPi (Piezo1) cluster dynamics in a single HEK293T cell expressing GenEPi. i1i3 (i1) Region without GenEPi cluster adjacent to a GenEPi cluster. (i2) Region with a GenEPi cluster which shows dynamic behavior and changes in fluorescence. (i3) Region with a GenEPi cluster which does not show dynamic behavior. Scale bars, 10 and 1 μm, respectively. j Raw values of fluorescence intensity profiles of the ROIs i1–i3 (Trace i1, Trace i2, and Trace i3) which show different GenEPi activity dynamics. k Fluorescence intensity profiles (F/F0) of the ROIs i1–i3 which illustrate the different GenEPi activity dynamics. Source data are provided as a Source Data file.
Fig. 4
Fig. 4. GenEPi reports cardiomyocyte contraction-triggered mechanical stimulation with high spatiotemporal resolution.
a Multicellular and systemic activation of GenEPi in response to autonomous contraction of cardiomyocytes in differentiated tissue within multiple beating patches. Representative time-lapse fluorescence intensity (F/F0) images and profile of multiple responding cells embedded in the differentiated tissue of beating cardiomyocyte patches. Scale bar, 10 μm. b Single cell local responses of GenEPi in a dissected beating patch in response to the autonomous beating of cardiomyocytes. b1, b2 Representative time-lapse fluorescence intensity (F/F0) images and profiles of a responding (b1) and a non-responding (b2) ROI in a single cell attached to the beating cardiomyocyte patch. Scale bar, 5 μm. c Representative fluorescence intensity (F/F0) profile from an ROI with systemic activation of GenEPi in response to cardiomyocyte contraction before (control) and after the addition of 100 μM blebbistatin. d Frequency of peaks, e amplitude of fluorescence intensity (F/F0) changes and f median ± SEM values of d and e before (control) and after the addition of norepinephrine (range of concentrations, 10 nM–10 μM). n = 6 ROIs, error bar: SEM. Ordinary one-way ANOVA and Kruskal–Wallis test, respectively. Data from three independent experiments. g Representative fluorescence intensity (F/F0) profiles from an ROI with GenEPi activation in response to cardiomyocyte contraction after the addition of norepinephrine (range of concentrations, 10 nm–10 μM). h Representative fluorescence intensity (F/F0) profile from an ROI with systemic activation of GenEPi in response to cardiomyocyte contraction before (control) and after the addition of 100 nM nifedipine. i Beating rate of cardiac microtissues before and after the addition of 100 nM nifedipine which abolishes the contraction of the beating cardiomyocytes. n = 17 measurements from three independent biological replicates, error bar: SEM. Two-tailed Wilcoxon rank-sum test. j Amplitude of fluorescence intensity (F/F0) changes before (control) and after the addition of 100 nM nifedipine. n = 101 and n = 20 measurements for control and nifedipine treatments, respectively, from three individual biological replicates, error bar: SEM. Two-tailed Mann–Whitney test. k Baseline fluorescence (F0) before and after the addition of 100 nM nifedipine. n = 24 ROIs containing multiple cells for each condition from 3 individual biological replicates, error bars: SEM. Two-tailed Mann–Whitney test. l Median ± SEM values of (i) and (j) before (control) and after the addition of 100 nM nifedipine. Source data are provided as a Source Data file.
Fig. 5
Fig. 5. GenEPi reports Piezo1-dependent activity changes in vivo.
a Schematic of the pTol2-hsp70:GenEPi plasmid used for the zebrafish transgenesis. GenEPi is downstream of the zebrafish hsp70-l promoter after the β-globin rabbit intron. b Schematic of the heat-shock protocol used to induce the expression of GenEPi in Tg(hsp70:GenEPi) zebrafish. c Longitudinal analysis of GenEPi expression upon heat-shock of Tg(hsp70:GenEPi) zebrafish at 1dpf, fluorescence steady state is reached after ~4–5 h. n = 35 fish. d Representative fluorescence of a non- (non-HS) and heat-shocked (HS) Tg(hsp70:GenEPi) zebrafish at 1 day post-fertilization (dpf). Scale bar, 200 μm. e Increase in fluorescence intensity following the heat-shock protocol in (b). (n = 20 and n = 31 non-heat-shocked (non-HS) and heat-shocked (HS) fish, respectively). Data were presented as means ± SEM. f GenEPi expression in the developing eye, neural retina, lens fiber cells, and primary anterior epithelium in a 1dpf Tg(hsp70:GenEPi) zebrafish. Scale bar, 20, 200, and 20 μm, respectively. g Representative images of GenEPi expression in the eye of a 1dpf Tg(hsp70:GenEPi) zebrafish during the chemical modulation of channel’s activity by Yoda1 and RR. Scale bar, 50 μm. h Normalized fluorescence intensity of control and Tg(hsp70:GenEPi) zebrafish during the chemical modulation of GenEPi activity in 10 μM Yoda1, 10 μM Yoda1 and 10 μM RR, 10 μM RR, and wash out to E3 medium. Non-heat-shocked embryos which do not express GenEPi showed non-significant responses both in the presence or absence of Yoda1 or RR (paired data of n = 3 and n = 24 non-HS and HS transgenic zebrafish, respectively). Data were presented as means ± SEM. Two-way ANOVA test. i Representative image of a Tg(hsp70:GenEPi) zebrafish heart at 3dpf. GenEPi is expressed in both the endocardium (dashed line) and myocardium cells in the developing zebrafish heart. Scale bar, 20 μm. j Representative fluorescence intensity (F/F0) profile from the antrioventricular canal (AVC) of a Tg(hsp70:GenEPi) zebrafish heart which shows the two-phase GenEPi activation. k Representative fluorescence intensity (F/F0) profile from the same ROI in j at the AVC of the same Tg(hsp70:GenEPi) zebrafish heart after treatment with BDM which abolishes heart beating, showing absence of GenEPi responses. l Mean of 27 representative GenEPi responses during individual heart beating cycles at 1dpf. Normalization of the GenEPi signal was obtained by computing the ratiometric intensity of GenEPi to the average of 12 NLS-mCherry signals of individual heartbeats in Tg(kdrl:NLS-mCherry) zebrafish at 1dpf. Source data are provided as a Source Data file.

References

    1. Heisenberg CP, Bellaiche Y. Forces in tissue morphogenesis and patterning. Cell. 2013;153:948–962. - PubMed
    1. Campas O. A toolbox to explore the mechanics of living embryonic tissues. Semin. Cell Dev. Biol. 2016;55:119–130. - PMC - PubMed
    1. Freikamp A, Cost AL, Grashoff C. The Piconewton force awakens: quantifying mechanics in cells. Trends Cell Biol. 2016;26:838–847. - PubMed
    1. Coste B, et al. Piezo1 and Piezo2 are essential components of distinct mechanically activated cation channels. Science. 2010;330:55–60. - PMC - PubMed
    1. Wu J, Lewis AH, Grandl J. Touch, tension, and transduction - the function and regulation of piezo ion channels. Trends Biochem. Sci. 2017;42:57–71. - PMC - PubMed

Publication types

MeSH terms