. 2023 Aug;30(8):1973-1987.
doi: 10.1038/s41418-023-01192-3. Epub 2023 Jul 19.

CAMK2D serves as a molecular scaffold for RNF8-MAD2 complex to induce mitotic checkpoint in glioma

Affiliations

CAMK2D serves as a molecular scaffold for RNF8-MAD2 complex to induce mitotic checkpoint in glioma

You Heng Chuah et al. Cell Death Differ. 2023 Aug.

Abstract

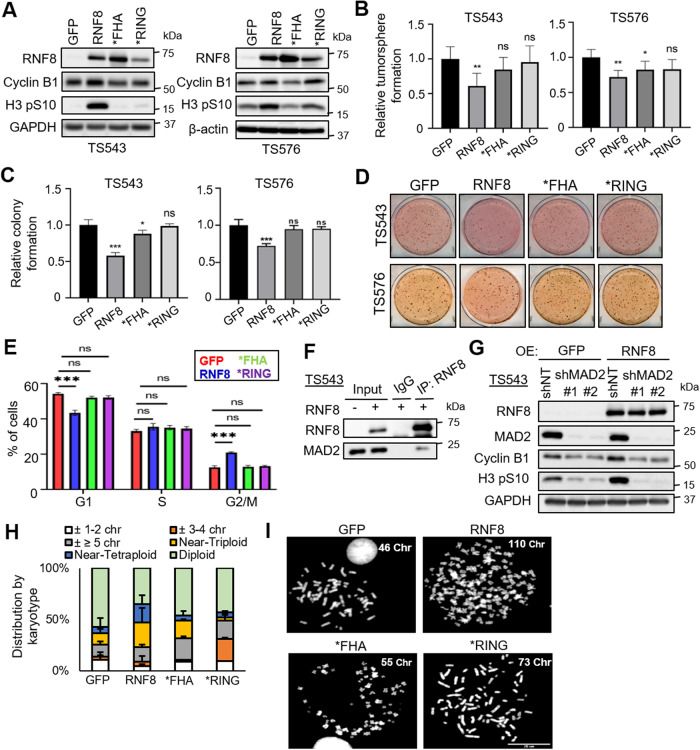
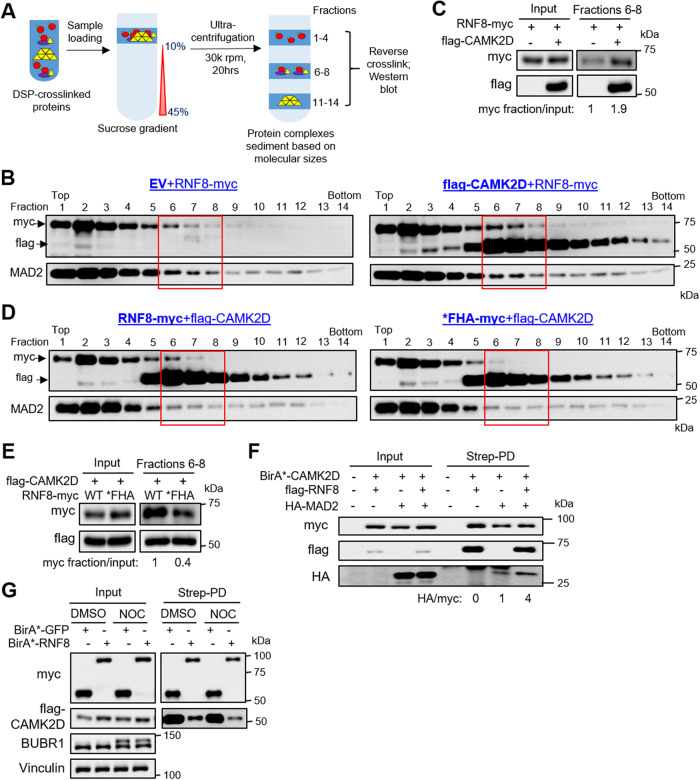
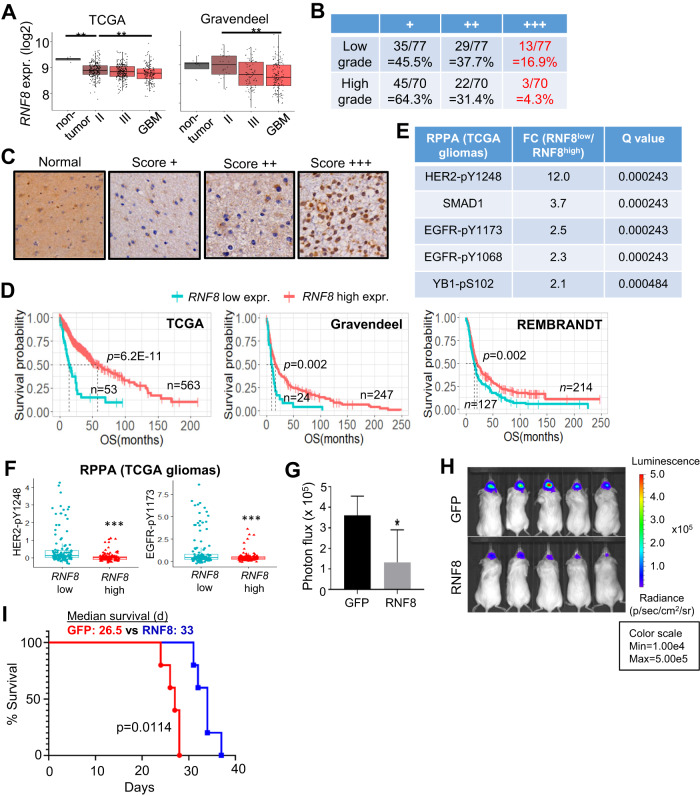
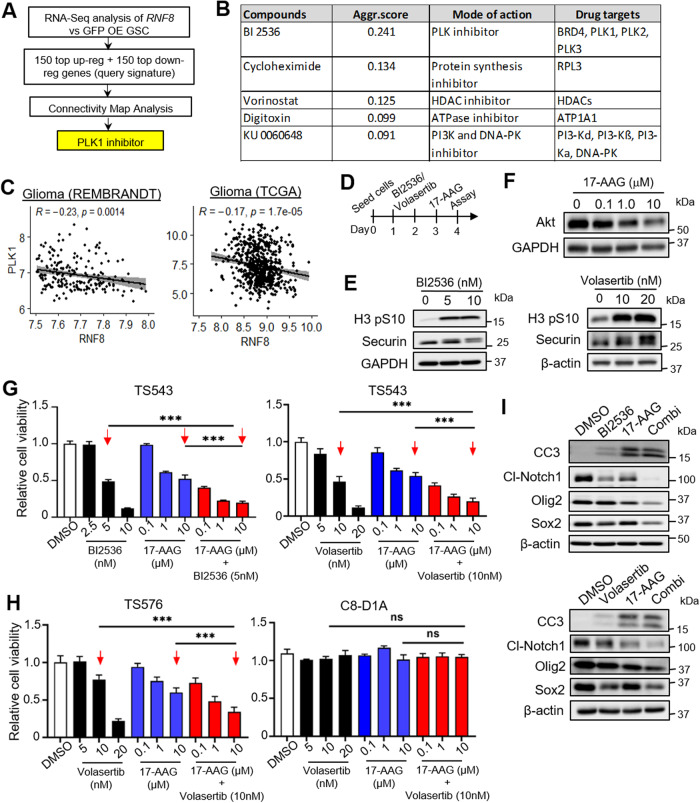
MAD2 is a spindle assembly checkpoint protein that participates in the formation of mitotic checkpoint complex, which blocks mitotic progression. RNF8, an established DNA damage response protein, has been implicated in mitotic checkpoint regulation but its exact role remains poorly understood. Here, RNF8 proximity proteomics uncovered a role of RNF8-MAD2 in generating the mitotic checkpoint signal. Specifically, RNF8 competes with a small pool of p31comet for binding to the closed conformer of MAD2 via its RING domain, while CAMK2D serves as a molecular scaffold to concentrate the RNF8-MAD2 complex via transient/weak interactions between its p-Thr287 and RNF8's FHA domain. Accordingly, RNF8 overexpression impairs glioma stem cell (GSC) mitotic progression in a FHA- and RING-dependent manner. Importantly, low RNF8 expression correlates with inferior glioma outcome and RNF8 overexpression impedes GSC tumorigenicity. Last, we identify PLK1 inhibitor that mimics RNF8 overexpression using a chemical biology approach, and demonstrate a PLK1/HSP90 inhibitor combination that synergistically reduces GSC proliferation and stemness. Thus, our study has unveiled a previously unrecognized CAMK2D-RNF8-MAD2 complex in regulating mitotic checkpoint with relevance to gliomas, which is therapeutically targetable.


Conflict of interest statement

The authors declare no competing interests.

Figures

Fig. 1
Fig. 1. RNF8 binds to MAD2 to promote MCC formation.
A Volcano plot showing the proteins which were enriched in BirA*-RNF8 compared to BirA*-GFP proximal proteomes. Western blot analysis of MAD2 and p31comet levels in the streptavidin pull down lysates (B) or myc immunoprecipitates (IP) (C) of HEK293T transfected with BirA*-RNF8 or GFP. D Western blot analysis of RNF8 levels in the MAD2 immunoprecipitates of HEK293T, with or without 200 ng/ml NOC (16 h). The band of interest is indicated by *. E Western blot analysis of MAD2 and flag-CDC20 levels in the flag IP from HEK293T cells co-transfected with flag-CDC20 and empty vector (EV)/RNF8-myc. Cells with nocodazole (NOC) treatment (200 ng/mL, 16 h) serve as the positive control. The MAD2/flag-CDC20 ratio was normalized to EV control. F Phos-tag SDS-PAGE analysis of wild-type or S102A HA-p31comet phosphorylation, with or without RNF8-myc overexpression. G Western blot analysis of endogenous MAD2 levels in the myc IP from HEK293T cell lysates overexpressing RNF8-myc, along with or without flag-p31comet or p31comet(QF) overexpression. The band of interest is indicated by *. MAD2/myc ratio was normalized to empty vector control. H Western blot analysis of H3 pS10 levels in the cell lysates of HEK293T overexpressing flag-tagged p31comet, p31comet(QF), or EV, along with myc-tagged RNF8. GAPDH serves as loading control. H3 pS10/GAPDH ratio was normalized to empty vector control. I Western blot analysis of endogenous MAD2 levels in the p31comet immunoprecipitates from HEK293T cell lysates transfected with different amount of RNF8-myc overexpressing plasmids. MAD2/p31comet ratio was normalized to empty vector control.
Fig. 2
Fig. 2. RNF8 associates with c-MAD2 stably via its RING domain without ubiquitinating MAD2.
A Structure of human RNF8 protein. B Western blot analysis of MAD2 levels in the myc IP from HEK293T cell lysates overexpressing myc-tagged RNF8, *FHA, *RING or EV. C Western blot analysis of HA-MAD2 levels in the streptavidin pull down lysates of HEK293T transfected with EV, HA-MAD2, -MAD2Δ or –MAD2L13A, along with BirA*-RNF8. D Western blot analysis of HA-MAD2∆C levels in the streptavidin pull down lysates from HEK293T cell lysates overexpressing BirA*-RNF8 or -*RING, along with HA-MAD2∆C overexpression. E Western blot analysis of flag-MAD2 levels in the myc IP from HEK293T cell lysates overexpressing EV, flag-MAD2, or –MAD2RQ, along with myc-tagged RNF8. F In silico docking of c-MAD2 (gray) and RNF8’s RING domain (yellow) with zinc (gray sphere) using the program HADDOCK. Interacting residues are highlighted in sticks and the interactions are shown as dotted black lines. G Western blot analysis of MAD2 levels in the myc IP from HEK293T cell lysates overexpressing myc-tagged RNF8, 3A, or 4A mutants. H Western blot analysis of HA levels in flag IP from HEK293T cell lysates overexpressing flag-tagged MAD2 and HA-tagged Ub, with RNF8 overexpression.
Fig. 3
Fig. 3. RNF8 overexpression impairs GSC mitotic progression that is dependent on its FHA and RING domains.
A Western blot analysis of RNF8 and SAC markers, including H3 pS10 and cyclin B1, in GSCs transduced with different RNF8 constructs. RNF8 serves as the positive control whereas GAPDH and β-actin serve as loading control respectively. B Tumorsphere formation of two GSC lines overexpressing GFP, RNF8, *FHA, or *RING (n = 6) (mean±SD). *P < 0.05; **P < 0.01. C, D Colony formation of two GSC lines overexpressing GFP, RNF8, *FHA, or *RING (n = 4) (mean ± SD). *P < 0.05; ***P < 0.001. D Representative images of (C). E Cell cycle analysis of TS543 overexpressing GFP, RNF8, *FHA or *RING, with 40 µM Z-VAD-FMK treatment (72 h) (n = 3) (mean±SD). ***P < 0.001. F Western blot analysis of MAD2 levels in the RNF8 IP from RNF8 overexpressing GSC TS543 lysates. G Western blot analysis of H3 pS10 and cyclin B1 levels of GSC TS543 with GFP or RNF8 overexpression, with or without MAD2 depletion. RNF8 and MAD2 serve as the positive controls, while GAPDH serves as the loading control. H, I Karyotyping analysis of GSC TS543 overexpressing different RNF8 constructs (n = 3). Near triploidy: 60–80 chromosomes; near tetraploidy: 81–110 chromosomes. Minimum of 100 spreads were analyzed per condition. I Representative karyotypes from GSCs overexpressing different RNF8 constructs (H). Scale bar 20 μm.
Fig. 4
Fig. 4. CAMK2D associates with RNF8’s FHA domain weakly/transiently via p-Thr287 to mediate RNF8-induced mitotic checkpoint.
A Volcano plot showing the proteins which are significantly depleted in *FHA vs RNF8 proximal proteomes (i.e., minus log2fold change (FC)). B Western blot analysis of endogenous CAMK2D levels in the streptavidin pull down lysates of HEK293T overexpressing BirA*-RNF8 or *FHA. CAMK2D/myc ratio was normalized to BirA*-RNF8 group. Western blot analysis of flag-CAMK2D levels in the streptavidin pull down lysates (C), or flag IP (D) of HEK293T co-transfected with flag-CAMK2D and BirA*-RNF8/*FHA. The band of interest is indicated by *. E Western blot analysis of flag levels in streptavidin pulldown lysates from HEK293T cell lysates overexpressing flag-CAMK2D or -CAMK2DT287A mutant, along with BirA*-RNF8. F Phos-tag SDS-PAGE analysis of flag-CAMK2D and -CAMK2DT287A mutant, along with co-expression of EV or myc-tagged RNF8/*FHA. The p-T287/flag ratio was normalized to empty vector control. G Western blot analysis of H3 pS10 levels in GFP or RNF8 overexpressing GSC TS543, with or without CAMK2D KD. RNF8 and CAMK2D serve as positive control whereas GAPDH serve as the loading control. H Western blot analysis of H3 pS10 levels in wildtype CAMK2D or CAMK2DED overexpressing GSC TS543, with or without RNF8 KD. Flag and RNF8 serve as the positive controls, while GAPDH serves as the loading control.
Fig. 5
Fig. 5. CAMK2D serves as a molecular scaffold for RNF8-MAD2 complex.
A Schematic diagram to illustrate the workflow for sucrose density gradient ultracentrifugation to assess RNF8 protein distribution in various fractions. B Western blot analysis of myc-RNF8, flag-CAMK2D, and MAD2 levels, with or without CAMK2D overexpression, in various fractions after sucrose density gradient ultracentrifugation of 293T cell lysates. C Western blot analysis of myc-RNF8 levels, with or without CAMK2D overexpression, in pooled fractions 6 to 8 from (B). The myc/input ratio was normalized to the EV control. D Western blot analysis of myc-RNF8/*FHA, flag-CAMK2D and MAD2 levels, with CAMK2D overexpression, in various fractions after sucrose density gradient ultracentrifugation of 293T cell lysates. E Western blot analysis of myc-RNF8/*FHA and MAD2 levels, with CAMK2D overexpression, in pooled fractions 6–8 from (D). The myc/input ratio was normalized to the RNF8 control. F Western blot analysis of flag-RNF8 and HA-MAD2 levels in the streptavidin pull down lysates of HEK293T overexpressing BirA*-CAMK2D, along with or without flag-RNF8 and HA-MAD2 overexpression. G Western blot analysis of flag-CAMK2D levels in the streptavidin pulldown lysates of BirA*-RNF8 or GFP-overexpressing HEK293T, with or without 200 ng/ml NOC (16 h).
Fig. 6
Fig. 6. GBM with high HER2-EGFR signaling tends to avoid high RNF8 expression as RNF8 overexpression impedes GBM tumorigenicity.
A Correlative analysis of RNF8 mRNA levels with glioma grades in two independent glioma patient cohorts. Wilcoxon-Mann-Whitney exact test. **P < 0.01. B, C Immunohistochemistry (IHC) scores of RNF8 in different grades of gliomas using glioma patient tissue microarray. C Representative images of the IHC scores of RNF8 in (B). D Correlative analysis of RNF8 mRNA levels with glioma patient survival in multiple glioma patient cohorts. OS: overall survival. Wald test. E Top 5 proteins that are upregulated in RNF8low vs RNF8high gliomas in the TCGA RPPA dataset using GlioVis (http://gliovis.bioinfo.cnio.es/). F RPPA analysis of HER2-pY1248 and EGFR-pY1173 in RNF8low versus RNF8high gliomas using TCGA cohort. ***P < 0.001, t-test. G, H In vivo bioluminescence-based imaging of post-orthotropic injection of TS543 overexpressing GFP or RNF8. H Representative images of the tumor-bearing NSG mice in (G) (n = 5) (mean±SD). *P < 0.05. I Kaplan Meier curves of mice implanted with GFP or RNF8 overexpressing TS543. Log rank test.
Fig. 7
Fig. 7. CMA using the RNF8 overexpression gene signature identifies PLK1i that synergizes with HSP90i to reduce GSC proliferation and stemness in vitro.
A CMA using a RNF8 overexpression query signature identifies PLK1 inhibitor. B Top 5 compounds identified with CMA by using the RNF8 overexpression query signature. C Correlative analysis of PLK1 and RNF8 mRNA levels in glioma patients. D Schematic diagram showing the drug treatment regimen to be used in (G–I). E Western blot analysis of H3 pS10 and securin levels in TS543 lysates upon treatment with DMSO or BI 2536/Volasertib at the indicated concentrations for two days. GAPDH and β-actin serve as loading controls. F Western blot analysis of Akt levels in TS543 lysates upon treated with DMSO or 17-AAG at the indicated concentrations for 1 day. GAPDH serves as loading control. G Cell viability assay of TS543 upon treatment with BI 2536/Volasertib, 17-AAG, or combination of BI 2536/ Volasertib and 17-AAG at the indicated concentrations (n = 6) (mean ± SD). ***P < 0.001. H Cell viability assay of TS576 and non-cancerous mouse astrocytes upon treatment with Volasertib, 17-AAG, or Volasertib/17-AAG combination at the indicated concentrations (n = 6) (mean ± SD). ***P < 0.001. I Western blot analysis of cleaved-caspase 3 (CC3) and select GSC stemness marker levels in TS543 lysates upon treatment with BI 2536/ Volasertib, 17-AAG, or combination of BI 2536/ Volasertib and 17-AAG. β-actin serves as loading control.

References

    1. Curtis NL, Ruda GF, Brennan P, Bolanos-Garcia VM. Deregulation of chromosome segregation and cancer. In: Jacks T, Sawyers CL, editors. Annu Rev Cancer Biol. Vol 4. Annual Review of Cancer Biology-Series. 42020. p. 257–78.
    1. Lara-Gonzalez P, Pines J, Desai A. Spindle assembly checkpoint activation and silencing at kinetochores. Semin Cell Dev Biol. 2021;117:86–98. doi: 10.1016/j.semcdb.2021.06.009. - DOI - PMC - PubMed
    1. Westhorpe FG, Tighe A, Lara-Gonzalez P, Taylor SS. p31(comet)-mediated extraction of Mad2 from the MCC promotes efficient mitotic exit. J Cell Sci. 2011;124:3905–16. doi: 10.1242/jcs.093286. - DOI - PMC - PubMed
    1. Kim DH, Han JS, Ly P, Ye QZ, McMahon MA, Myung K, et al. TRIP13 and APC15 drive mitotic exit by turnover of interphase- and unattached kinetochore-produced MCC. Nat Commun. 2018;9:4354. - PMC - PubMed
    1. Luna-Maldonado F, Andonegui-Elguera MA, Diaz-Chavez J, Herrera LA. Mitotic and DNA damage response proteins: maintaining the genome stability and working for the common good. Front Cell Dev Biol. 2021;9:700162. - PMC - PubMed

Publication types

MeSH terms