Controlled Clinical Trial
. 2023 Jul 19;13(1):11665.
doi: 10.1038/s41598-023-38258-8.

Measuring acute effects of subanesthetic ketamine on cerebrovascular hemodynamics in humans using TD-fNIRS

Affiliations
Controlled Clinical Trial

Measuring acute effects of subanesthetic ketamine on cerebrovascular hemodynamics in humans using TD-fNIRS

Adelaida Castillo et al. Sci Rep. .

Abstract

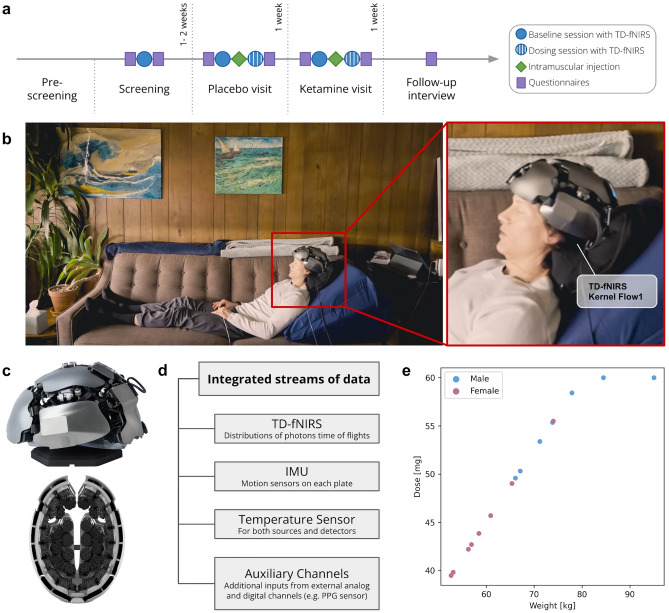
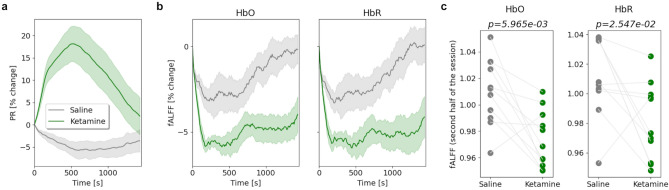
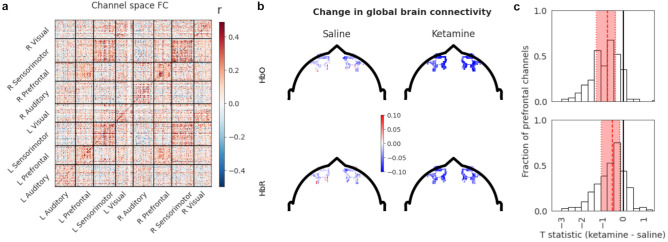
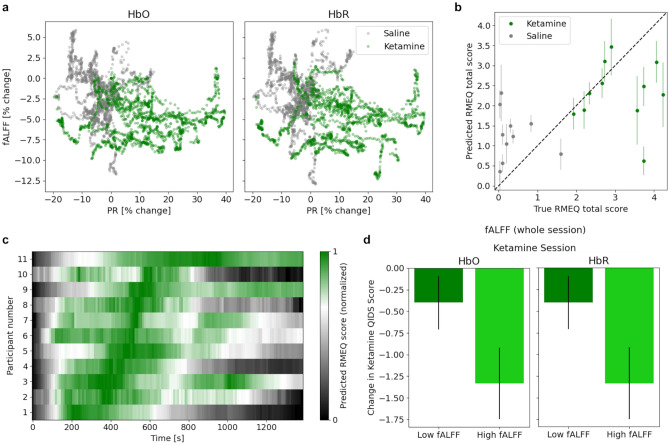
Quantifying neural activity in natural conditions (i.e. conditions comparable to the standard clinical patient experience) during the administration of psychedelics may further our scientific understanding of the effects and mechanisms of action. This data may facilitate the discovery of novel biomarkers enabling more personalized treatments and improved patient outcomes. In this single-blind, placebo-controlled study with a non-randomized design, we use time-domain functional near-infrared spectroscopy (TD-fNIRS) to measure acute brain dynamics after intramuscular subanesthetic ketamine (0.75 mg/kg) and placebo (saline) administration in healthy participants (n = 15, 8 females, 7 males, age 32.4 ± 7.5 years) in a clinical setting. We found that the ketamine administration caused an altered state of consciousness and changes in systemic physiology (e.g. increase in pulse rate and electrodermal activity). Furthermore, ketamine led to a brain-wide reduction in the fractional amplitude of low frequency fluctuations, and a decrease in the global brain connectivity of the prefrontal region. Lastly, we provide preliminary evidence that a combination of neural and physiological metrics may serve as predictors of subjective mystical experiences and reductions in depressive symptomatology. Overall, our study demonstrated the successful application of fNIRS neuroimaging to study the physiological effects of the psychoactive substance ketamine in humans, and can be regarded as an important step toward larger scale clinical fNIRS studies that can quantify the impact of psychedelics on the brain in standard clinical settings.


Conflict of interest statement

Authors AC, JD, RMF, FF, AG, WCH, SJ, JKH, ZMA, NM, KLP, JP, WCR, MS and MT were employed by Kernel during this study. FS provided scientific consulting for Kernel. The funder, Cybin, contributed to the conceptualization of this study and approved the final manuscript for submission.

Figures

Figure 1
Figure 1
Overview of study design and usage of whole head TD-fNIRS neuroimaging in a clinical environment. (a) Study Structure. Screening and dosing visits were conducted at the clinical site. The follow up interview was conducted by phone. (b) Pilot participant wearing the Kernel Flow1 TD-fNIRS system. The TD-fNIRS operator is located to the right outside the image, out of the view of the participant. (c) The Kernel Flow1 TD-fNIRS headset viewed from the outside (top) and inside (bottom). The headset consists of bilateral frontal, temporal, visual, and sensorimotor plates and a total of 52 modules (each with a dual-wavelength source and six detectors). (d) Shown are the parallel streams of data that were captured with the Flow1 system in this experiment. (e) Ketamine dose administered to participants. Each dot represents a participant.
Figure 2
Figure 2
Robust physiological measurements with the Kernel Flow1 TD-fNIRS system reveal significant differences between the ketamine and saline dosing sessions. (a) The signal from the Kernel Flow1 TD-fNIRS system (total photon counts from 850 nm laser averaged over well-coupled prefrontal channels) showed robust heartbeat signals (red) in line with the raw data recorded from an external PPG sensor (blue). Shown is a representative 15 s sample of data. (b) PR time-series extracted from the TD-fNIRS system (red) and the PPG device (blue) from a representative subject during the saline dosing session (left) and the ketamine dosing session (right). The time-series were smoothed for visualization purposes. (c) (Left) The PR computed from the fNIRS signal was highly correlated with the PPG-based PR (Pearson r = 1.00, p = 1.01 × 10−69; gray dashed line corresponds to the diagonal). (Right) Same as Left but for a representative PRV measure (Pearson r = 0.98, 2.62 × 10−33; SDNN represents the standard deviation of the NN intervals). Note that for this analysis, we made use of all available sessions (both saline/ketamine dosing sessions as well as the baseline runs recorded immediately prior; each dot corresponds to a single recording session). (d) Maximum change in PR over the course of the dosing session for all participants–the PR increased significantly more during the ketamine than the saline dosing session (paired t-test, p = 5.22 × 10−3). (e) PRV over the course of the dosing session for all participants–the PRV was significantly lower during the ketamine than the saline dosing session (paired t-test, p = 3.95 × 10−3). Here, PRV is measured by the root mean square of successive differences between normal heartbeats (RMSSD), a common measure of PRV.
Figure 3
Figure 3
Changes in whole-brain fALFF following ketamine administration. (a, b) Time-varying PR and fALFF were normalized by the initial value at a given session to obtain the percentage of change throughout the session. Shown are changes in PR (a) and whole-brain fALFF for HbO and HbR (b) during saline (gray) and ketamine (green) dosing sessions (mean ± SEM). (c) During each saline or ketamine session, whole-brain fALFF (i.e. averaged across the brain) was computed for the first half and second half of the sessions independently and was baseline normalized. Only during the second half of the sessions, fALFF values were significantly lower for the ketamine session compared to the saline session, for both HbO and HbR (paired t-test, p = 5.97 × 10−3 and p = 0.025 respectively).
Figure 4
Figure 4
Cortical functional connectivity derived from TD-fNIRS and its acute changes after ketamine vs. saline administration. (a) Group-level functional connectivity in channel space during the saline dosing session (only HbO is shown). L and R correspond to left and right hemispheres respectively. Sectors correspond to the different plates on the headset (“Methods”, Fig. 1c). Colorbar indicates the Pearson correlation coefficient used for FC calculations (“Methods”). (b) Global brain connectivity (GBC) of the prefrontal channels for saline (left) and ketamine (right) sessions after subtracting baseline GBC for the HbO (top) and HbR (bottom). Note the stronger negative values in the ketamine condition. (c) The distributions of the group-level T-statistic for ketamine vs saline for the HbO (top) and HbR (bottom). The distribution is shifted to the left, indicating a general decrease in GBC. Shown in red are the median and interquartile range.
Figure 5
Figure 5
Changes in the magnitude of whole-brain fALFF following ketamine administration. (a) Time-varying PR and fALFF (normalized by the initial value at a given session) exhibited a separation between ketamine (green cluster) and saline (gray cluster) sessions (note the ketamine cluster in the bottom right corner indicating an increase in the PR and decrease in fALFF). (b) By using a linear regression model with time-varying PR and fALFF (both HbO and HbR) as input features, we were able to predict the total RMEQ score. Shown are the model predictions on the validation set during each fold (mean ± SEM of the time-varying predictions within each session versus the reported RMEQ total score for the entire session). (c) We evaluated the trained model on the time-varying features to obtain time-varying RMEQ score predictions (on the validation set). Shown are the normalized prediction scores sorted by the peak time across participants. It appears that different participants may reach their peak of mystical experiences at different time points after ketamine administration. (d) GEE model revealed that the interaction term between session type (ketamine vs. saline) and whole-brain fALFF (whether it was high or low throughout the session) was a significant factor in the change in QIDS scores (HbO: p = 3.53 × 10−6, HbR: p = 4.76 × 10−7). Shown are the change in QIDS scores after the ketamine sessions when we performed a median split on the participants’ fALFF during their ketamine session.

References

    1. Berman RM, et al. Antidepressant effects of ketamine in depressed patients. Biol. Psychiatry. 2000;47:351–354. doi: 10.1016/S0006-3223(99)00230-9. - DOI - PubMed
    1. Gaynes BN, et al. What did STAR∗D teach us? Results from a large-scale, practical, clinical trial for patients with depression. Psychiatry Serv. 2009;60:7. doi: 10.1176/ps.2009.60.11.1439. - DOI - PubMed
    1. Read J, Williams J. Adverse effects of antidepressants reported by a large international cohort: Emotional blunting, suicidality, and withdrawal effects. CDS. 2018;13:176–186. doi: 10.2174/1574886313666180605095130. - DOI - PubMed
    1. Kelly K, Posternak M, Jonathan EA. Toward achieving optimal response: Understanding and managing antidepressant side effects. Dialogues Clin. Neurosci. 2008;10:409–418. doi: 10.31887/DCNS.2008.10.4/kkelly. - DOI - PMC - PubMed
    1. Munkholm K, Paludan-Müller AS, Boesen K. Considering the methodological limitations in the evidence base of antidepressants for depression: A reanalysis of a network meta-analysis. BMJ Open. 2019;9:e024886. doi: 10.1136/bmjopen-2018-024886. - DOI - PMC - PubMed

Publication types