. 2023 Jul;619(7970):595-605.
doi: 10.1038/s41586-023-06298-9. Epub 2023 Jul 19.

A spatially resolved timeline of the human maternal-fetal interface

Affiliations

A spatially resolved timeline of the human maternal-fetal interface

Shirley Greenbaum et al. Nature. 2023 Jul.

Abstract

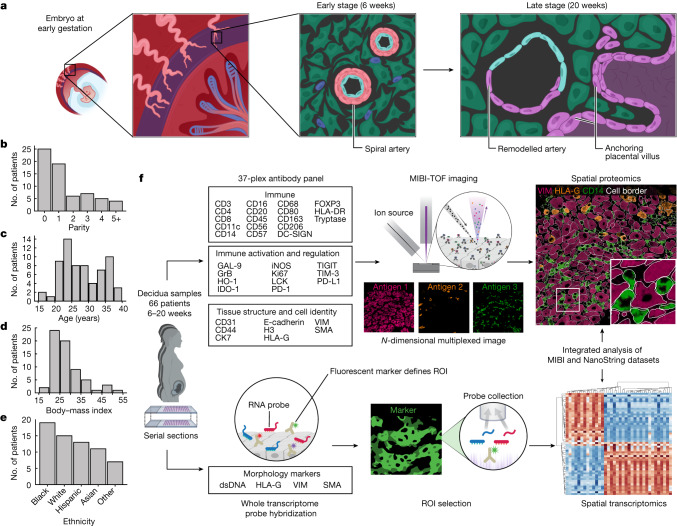
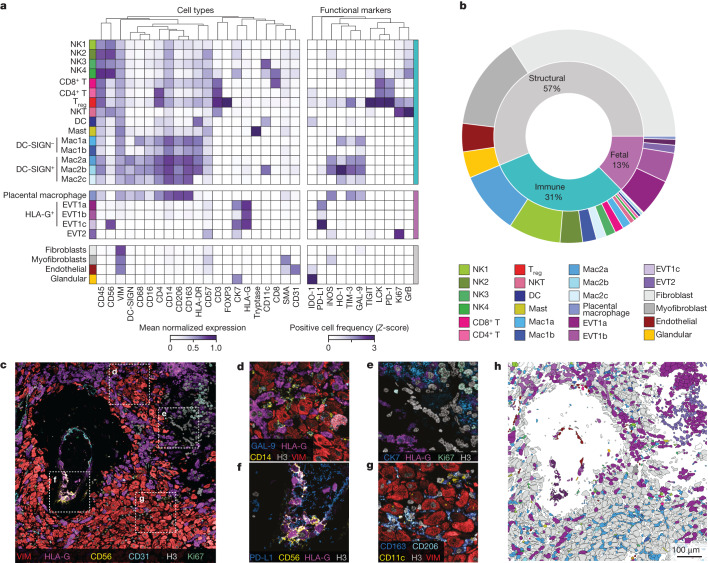
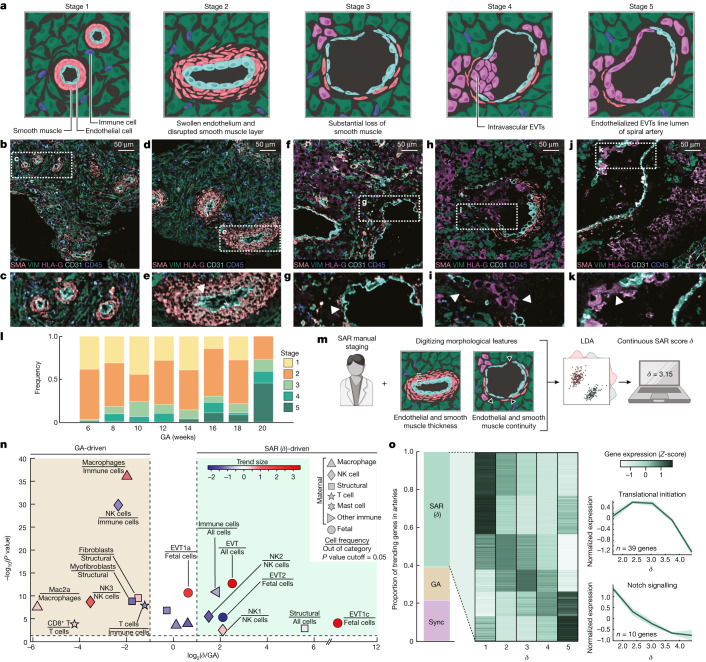
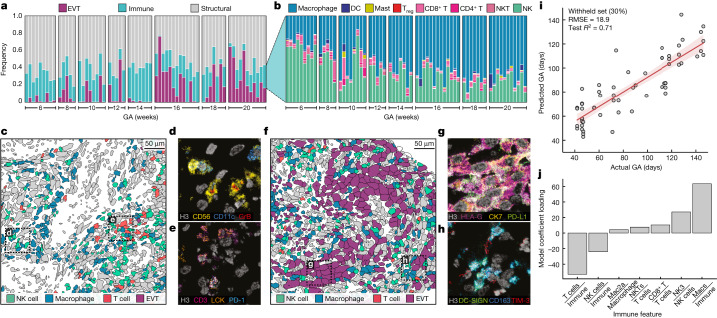
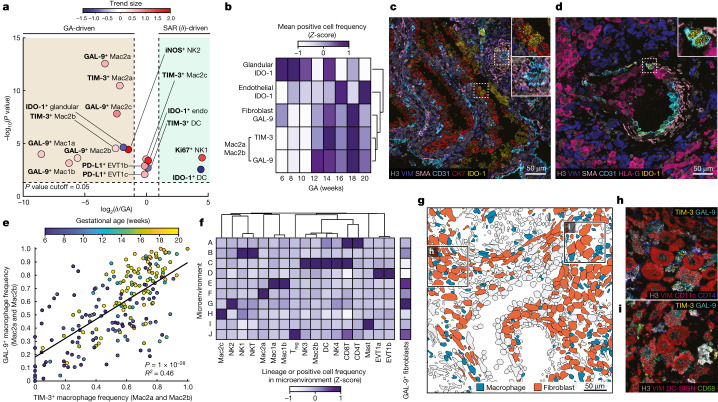
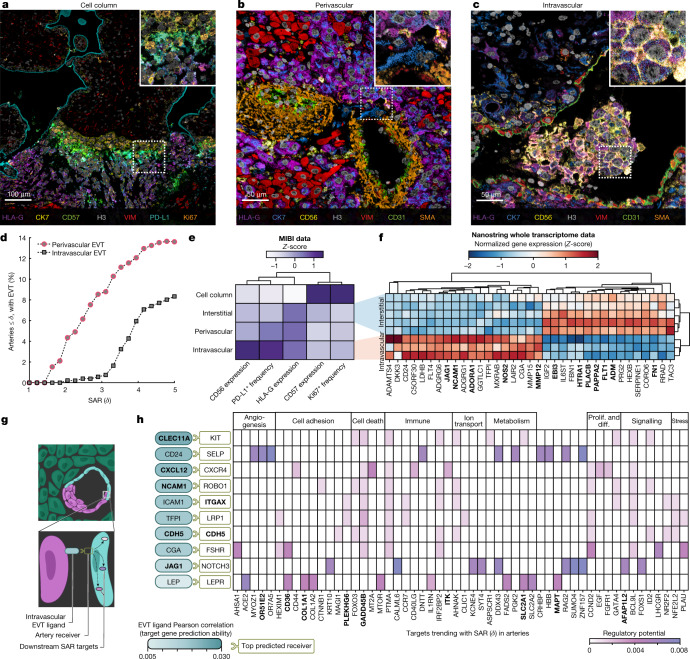
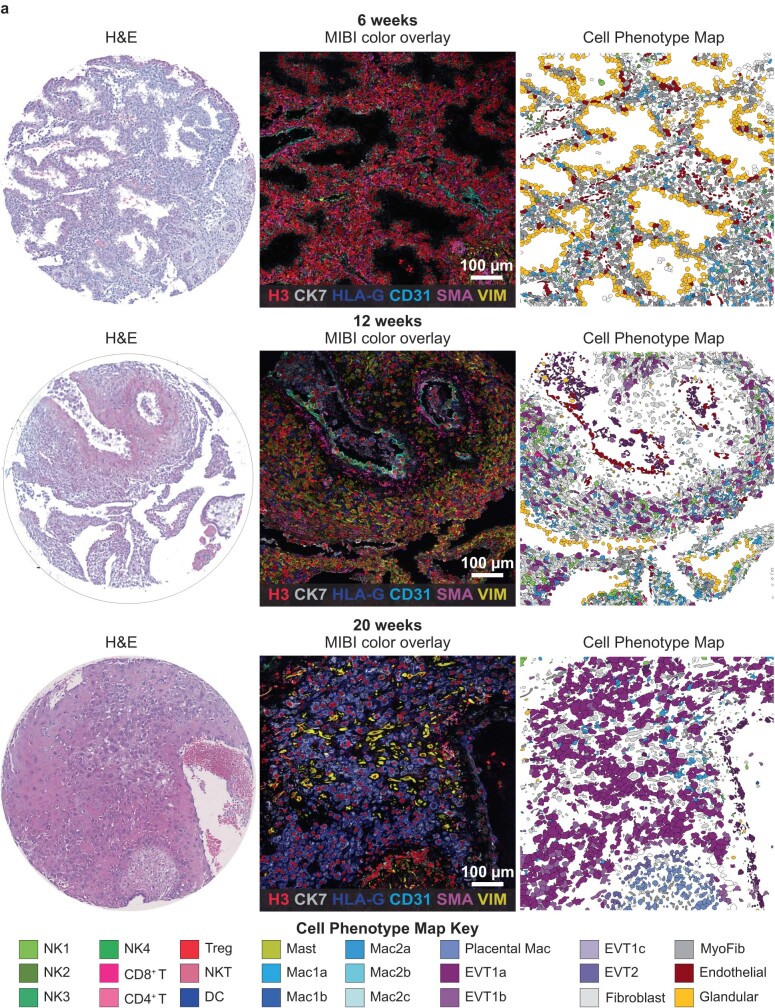
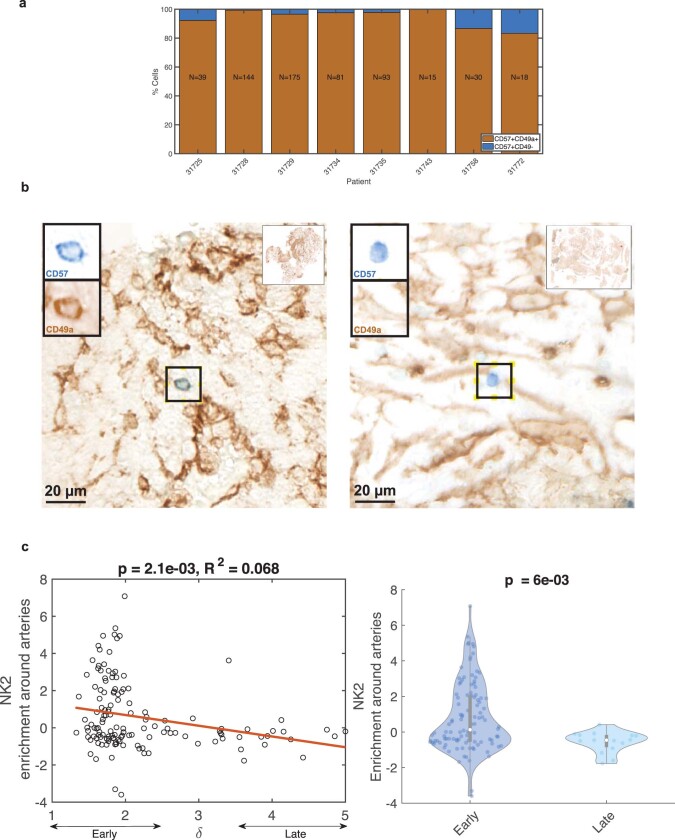
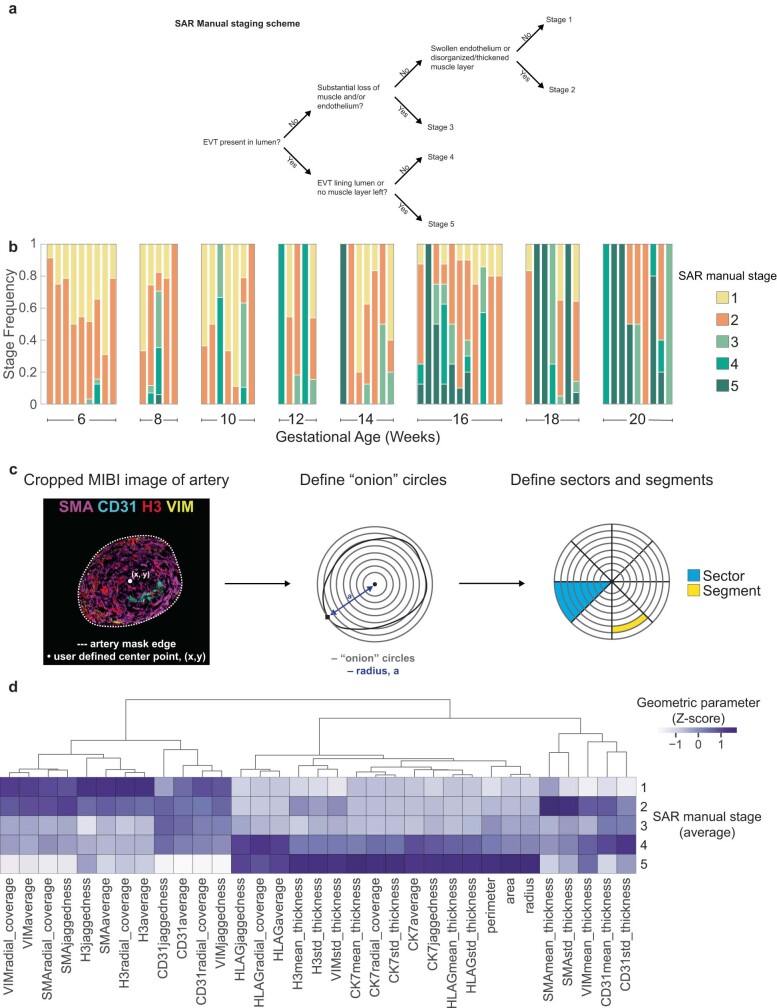
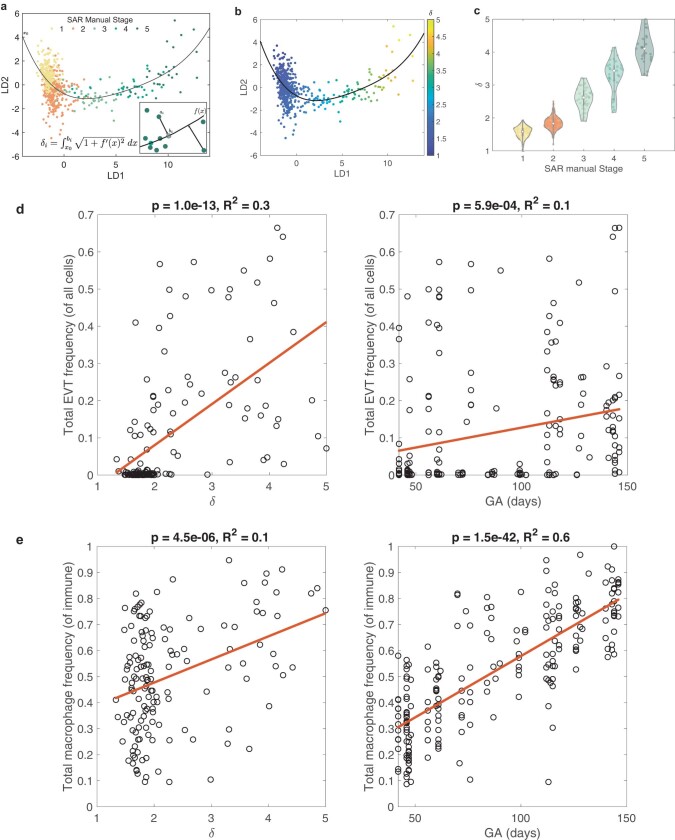
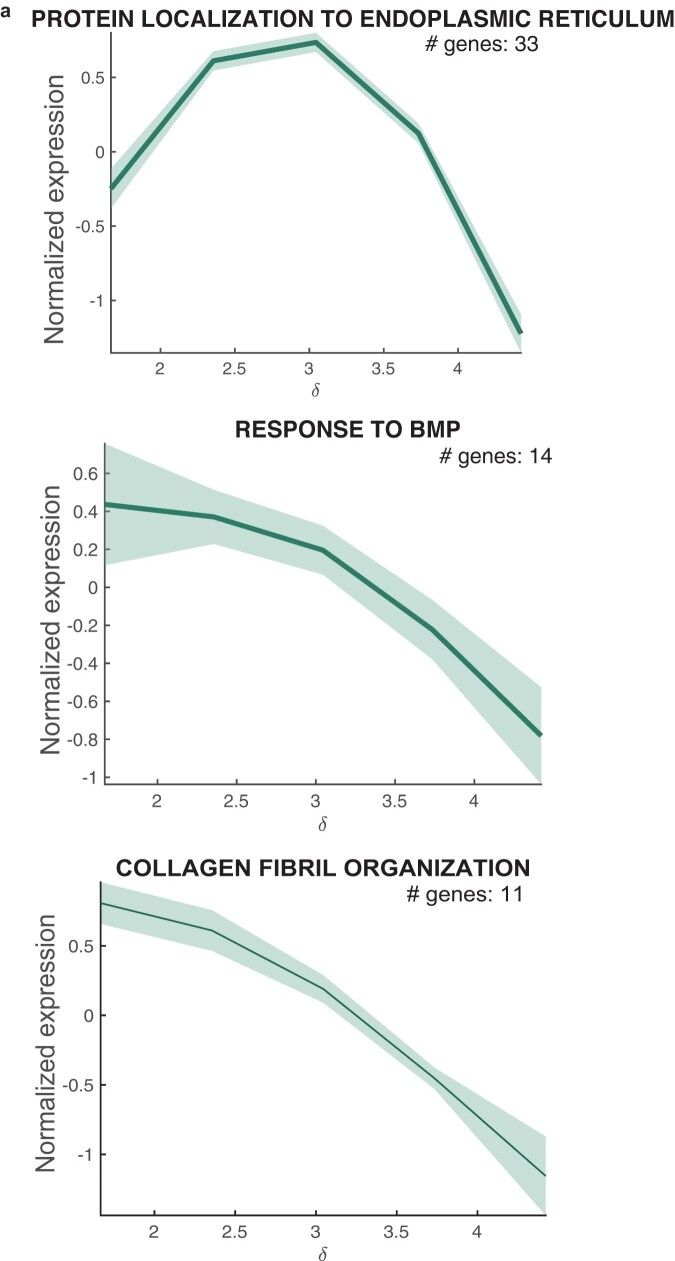
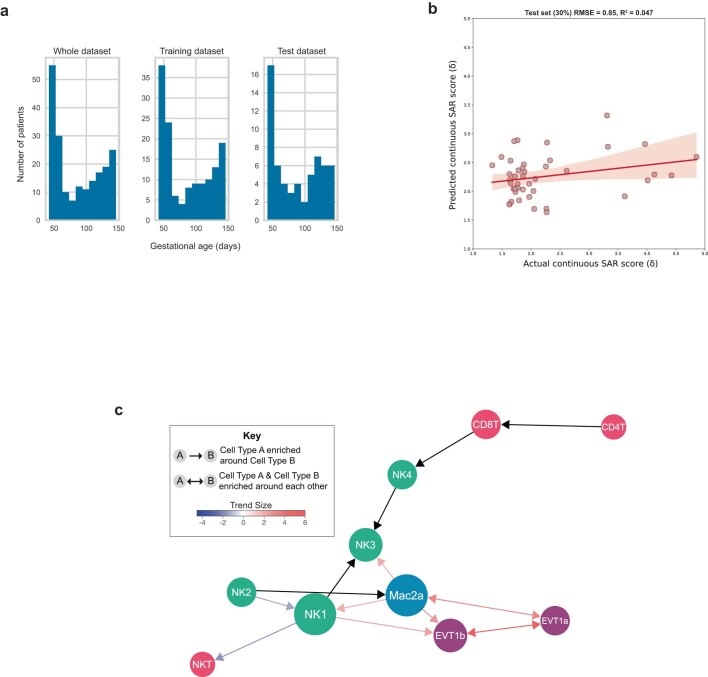
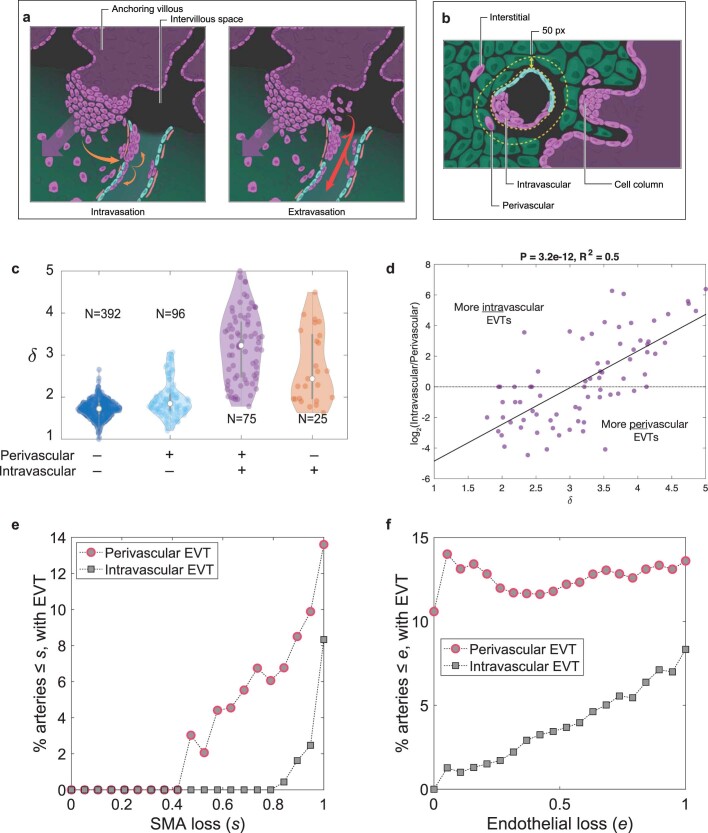
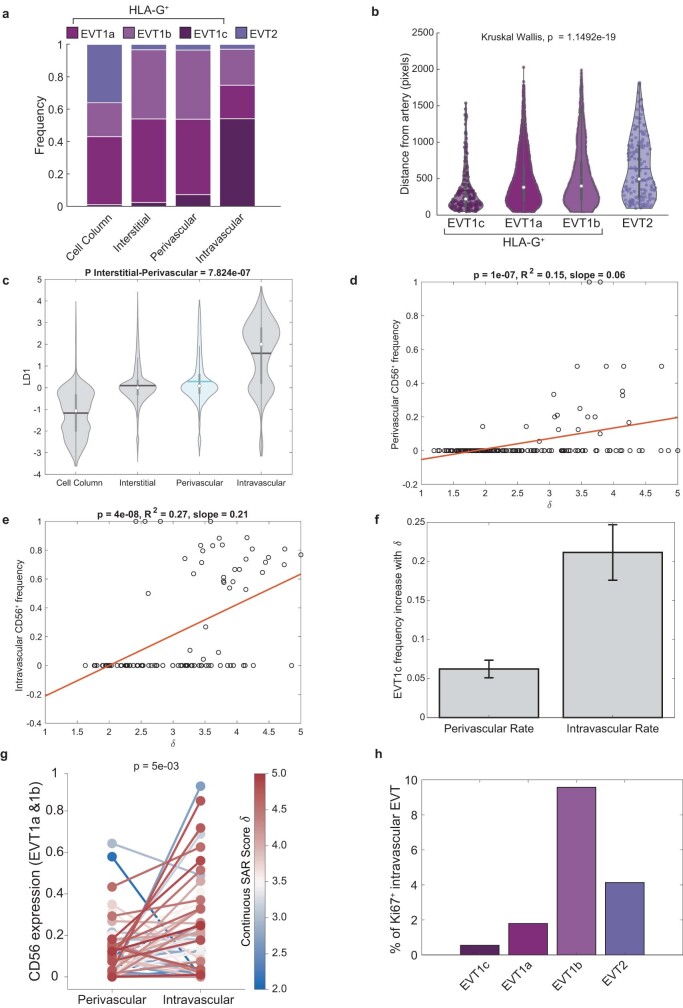
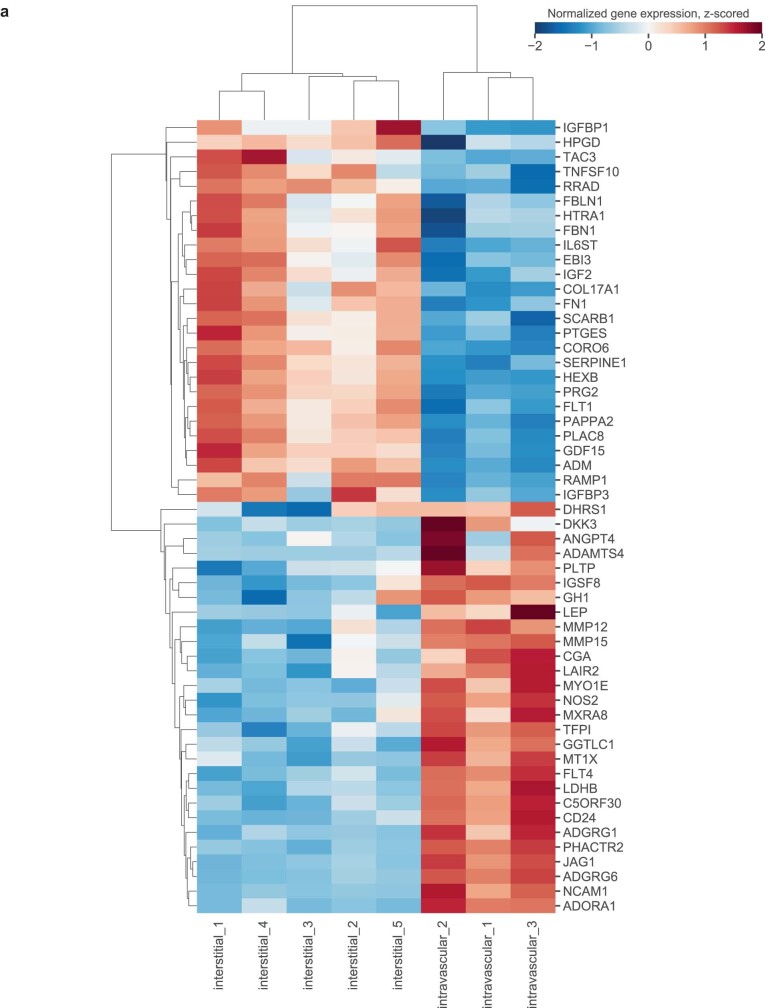
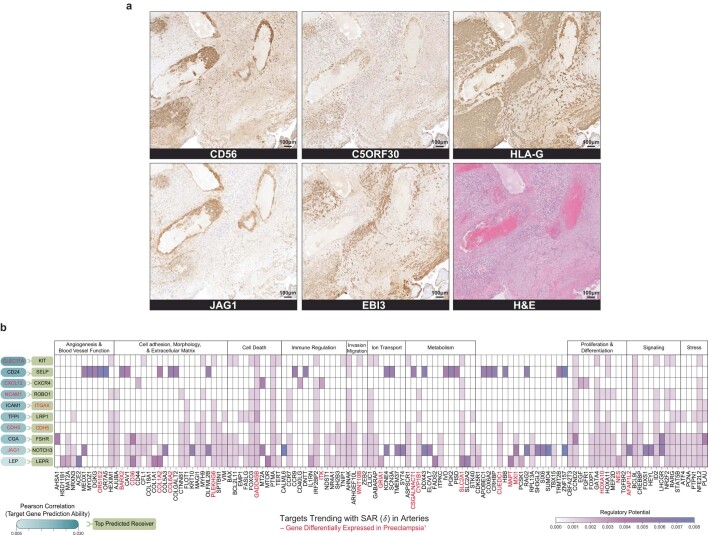
Beginning in the first trimester, fetally derived extravillous trophoblasts (EVTs) invade the uterus and remodel its spiral arteries, transforming them into large, dilated blood vessels. Several mechanisms have been proposed to explain how EVTs coordinate with the maternal decidua to promote a tissue microenvironment conducive to spiral artery remodelling (SAR)1-3. However, it remains a matter of debate regarding which immune and stromal cells participate in these interactions and how this evolves with respect to gestational age. Here we used a multiomics approach, combining the strengths of spatial proteomics and transcriptomics, to construct a spatiotemporal atlas of the human maternal-fetal interface in the first half of pregnancy. We used multiplexed ion beam imaging by time-of-flight and a 37-plex antibody panel to analyse around 500,000 cells and 588 arteries within intact decidua from 66 individuals between 6 and 20 weeks of gestation, integrating this dataset with co-registered transcriptomics profiles. Gestational age substantially influenced the frequency of maternal immune and stromal cells, with tolerogenic subsets expressing CD206, CD163, TIM-3, galectin-9 and IDO-1 becoming increasingly enriched and colocalized at later time points. By contrast, SAR progression preferentially correlated with EVT invasion and was transcriptionally defined by 78 gene ontology pathways exhibiting distinct monotonic and biphasic trends. Last, we developed an integrated model of SAR whereby invasion is accompanied by the upregulation of pro-angiogenic, immunoregulatory EVT programmes that promote interactions with the vascular endothelium while avoiding the activation of maternal immune cells.


Conflict of interest statement

M.A. and is a named inventor on patent US20150287578A1, which covers the mass spectrometry approach utilized by MIBI-TOF to detect elemental reporters in tissue using secondary ion mass spectrometry. M.A. is a board member and shareholder in IonPath, which develops and manufactures the commercial MIBI-TOF platform. All other authors declare no competing interests.

Figures

Fig. 1
Fig. 1. Study design and workflow.
a, Diagram of a human embryo in utero at 6 weeks of gestation. Left, the maternal–fetal interface consisting of decidua basalis (purple) with maternal spiral arteries (light pink) and fetal chorionic villi in the intervillous space (bottom right corner). Middle and right, early-stage (6 weeks) unremodelled spiral artery and progression to late-stage (20 weeks) remodelled artery and anchoring fetal villi. b, Cohort parity distribution. c, Cohort age distribution. d, Cohort distribution of body–mass index. e, Cohort ethnicity distribution. f, TMA construction and serial sections for multiomics workflow. Top, antibody panel, MIBI acquisition and spatial proteomics data extraction. Bottom, morphology marker panel and probe diagram, NanoString DSP ROI selection and spatial transcriptomics data extraction. The schematics in f were created using BioRender (https://biorender.com). Source Data
Fig. 2
Fig. 2. Multiplexed imaging of human decidua reveals the immune-tolerance-conducive composition of the maternal–fetal interface.
a, Cell lineage assignments showing mean normalized expression of lineage markers (left) and functional-marker-positive cell frequency (right, Z-score). Columns (markers) are hierarchically clustered. DC, dendritic cell. b, Cell lineage abundances across our cohort. c, MIBI field of view (FOV) colour overlay of a 20-week sample. Representative image of n = 33 FOVs. d, Inset of c showing interstitial fetal EVTs. e, Inset of c showing anchoring villous cell column to decidua interface. f, Inset of c showing intravascular EVTs. g, Inset of c showing decidual stromal cells (fibroblasts) and macrophages. h, Cell lineage assignments overlaid onto the cell-segmentation output to produce a cell phenotype map. Source Data
Fig. 3
Fig. 3. SAR progression significantly influences maternal–fetal interface composition.
a, Characteristics of SAR stages 1–5 manually assessed. b, MIBI colour overlay of manually assessed stage 1 arteries. Representative image of n = 70 FOVs. c, Inset of b showing stage 1 arteries. d, MIBI colour overlay of manually assessed stage 2 arteries. Representative image of n = 98 FOVs. e, Inset of d. Arrowhead indicates swollen endothelial cells. f, MIBI colour overlay of manually assessed stage 3 arteries. Representative image of n = 29 FOVs. g, Inset of f. Arrowhead indicates substantial loss of smooth muscle. h, MIBI colour overlay of one manually assessed stage 4 artery. Representative image of n = 21 FOVs. i, Inset of h. Arrowheads indicate intravascular EVTs. j, MIBI colour overlay of one manually assessed stage 5 artery. Representative image of n = 20 FOVs. k, Inset of j. Arrowhead indicates endothelialized EVTs lining the spiral artery lumen. l, Distribution of SAR manually assessed stages by GA. GA in days is binned to weeks for visualization. m, Schematic of calculating the continuous SAR remodelling score (δ). n, Volcano plot distinguishing GA-driven from SAR (δ)-driven cell-type frequencies. x axis, log2 ratio of R2 derived from linear regression against SAR (δ) and GA. y axis, –log10 of the P value for the better-fitting regression model. Points are colour-coded by the trend size observed in the better-fitting regression model. o, Left, proportion of genes in artery (2,932 in total) tissue where expression changes significantly correlate with SAR (δ) (1,785), GA (517) or both (Sync; 633). Centre, SAR (δ)-correlated genes in artery tissue showing mean normalized expression (Z-score) by SAR (δ) stage. Right, two SAR (δ)-trending gene ontology pathways showing normalized expression of genes in the GO pathway by SAR (δ). Data are presented as the mean gene expression ± s.e.m. Source Data
Fig. 4
Fig. 4. A lymphoid-to-myeloid shift in immune-compartment composition is tightly correlated with GA.
a, Frequency of EVT, immune and structural cell populations per individual, with individuals ordered by GA. GA in days is binned to weeks for visualization. b, Frequency of immune cell populations per individual by GA. NK, total NK cells. c, Representative cell phenotype map of immune composition in decidual tissue in an early (6 weeks GA) sample. d, Inset of c showing a MIBI colour overlay of NK cells with GrB expression. Representative image of n = 202 FOVs. e, Inset of c showing a MIBI colour overlay of T cells with PD-1 and LCK expression. Representative image of n = 145 FOVs. f, Representative cell phenotype map of immune composition in decidual tissue in a late (16 weeks GA) sample. Grey, other cell types. g, Inset of f showing a MIBI colour overlay of EVTs (EVT1a and EVT1b) with PD-L1 expression. Representative image of n = 131 FOVs. h, Inset of f showing a MIBI colour overlay of macrophages with TIM-3 expression. Representative image of n = 202 FOVs. i, Predicted versus actual GA in days for a ridge regression model trained on GA-associated immune features for a withheld test set (30%). Line, best fit; shaded region, one standard deviation. RMSE, root mean square error. j, Ridge regression model coefficient loadings for GA-associated immune features. Source Data
Fig. 5
Fig. 5. Coordinated upregulation of tolerogenic functional markers with GA.
a, Volcano plot distinguishing GA-driven from SAR (δ)-driven cell-type-specific functional marker positivity fraction. x axis, log2 ratio of trend size is a relative measurement of R2 derived from linear regression against GA or SAR (δ) and GA. y axis, –log10 of the P value for the better-fitting regression model. Points are colour coded by the trend size observed in the better-fitting regression model. b, Heatmap of changes in a subset of GA-driven functional markers as a function of GA in weeks. GA in days is binned to weeks for visualization. c, MIBI colour overlay of IDO-1 expression in glandular cells (top inset) and endothelial cells (bottom inset) in an early (6 weeks GA) sample. Representative image of n = 122 FOVs. d, MIBI colour overlay of IDO-1 expression in endothelial cells (inset) in spiral artery (SAR manually assessed stage 4) of a late (16 weeks GA) sample. Representative image of n = 106 FOVs. e, Per-image Mac2a and Mac2b TIM-3+ cell frequency versus Mac2a and Mac2b GAL-9+ frequency coloured by GA. f, Lineage composition of cellular microenvironments across the cohort, and frequency of GAL-9+ fibroblasts in each microenvironment. g, Cell phenotype map of macrophages and decidual fibroblasts. h, Inset of g. MIBI colour overlay of TIM-3+ and GAL-9+ Mac2b cells and fibroblasts. Representative image of n = 153 FOVs. i, Inset of g. MIBI colour overlay of TIM-3+ and GAL-9+ Mac1a, Mac1b and Mac2a cells and fibroblasts. Representative image of n = 148 FOVs. Source Data
Fig. 6
Fig. 6. Spatiotemporal EVT distributions suggest that intravasation is the predominant route of EVT invasion in superficial decidua.
a, MIBI overlay of anchoring villous and associated cell column EVT populations. Inset, cell column EVTs. Representative image of n = 60 FOVs. b, MIBI overlay of spiral arteries and associated perivascular EVT populations. Inset, perivascular EVT breaching artery wall. Representative image of n = 54 FOVs. c, MIBI overlay of remodelled spiral arteries and associated intravascular EVT populations. Inset, intravascular EVTs in a clump. Representative image of n = 23 FOVs. d, Percentage of arteries with scores less than or equal to a given SAR (δ) threshold by perivascular or intravascular EVTs present. Arteries were considered to have perivascular or intravascular EVT if ≥ 5 EVTs were present. e, Lineage and functional marker trends of EVT populations by anatomical location using MIBI data. Lineage marker (CD57, HLA-G and CD56) trends are mean expression values. Functional marker (Ki67 and PD-L1) trends are mean positive cell frequencies. Columns Z-scored and hierarchically clustered. f, Expression (Z-score) of top 35 DEGs by log(fold change) (adjusted P value < 0.05) between interstitial and intravascular EVT populations using NanoString whole transcriptome data. Genes also differentially expressed in preeclamptic decidua samples, are indicated in bold. g, Application of NicheNet algorithm to artery and intravascular EVT whole transcriptome data to predict EVT–artery interactions and downstream signalling targets. h, Outcome of ligand activity prediction according to NicheNet on DEGs on intravascular EVTs. Results are shown for the ten EVT ligands that best predict receivers expressed in arteries, ranked by Pearson’s correlation coefficient or the EVT ligand activity ranking metric. Ligands, receivers and targets also differentially expressed in preeclamptic decidua samples1 are indicated in bold. Prolif. and diff., proliferation and differentiation. Source Data
Extended Data Fig. 1
Extended Data Fig. 1. Representative H&E and MIBI images for cell phenotyping.
a. Serial sections with cell phenotype maps. Each cell colored by its phenotype assignment for GAs: 6, 12, 20 weeks. VIM, vimentin; SMA, smooth muscle actin; Placental Mac, Placental Macrophage; MyoFib, Myofibroblast. Representative images of n = 55 FOVs (6 weeks), n = 12 FOVs (12 weeks), n = 33 FOVs (20 weeks). Scale bar, 100 µm.
Extended Data Fig. 2
Extended Data Fig. 2. Validation of CD57+ NK2 population.
a. Bar plot of double positive cells (CD57+CD49a+) percent out of CD57+ cells per patient. b. Representative examples of double positive (CD57+CD49a+, left) and single positive (CD57+CD49a-, right) staining using dual color IHC for CD57 and CD49a on decidua samples, 595 cells in total. Representative images of n = 574 double positive cells and n = 21 single positive cells. Scale bar, 20 µm. c. Pairwise enrichment between NK2 cells and arteries. Left: mean enrichment per image by δ, n = 209 images. Red line – fitted linear regression, regression p-value. Right: Violin plot of NK2-artery enrichment scores by early (1 ≤ δ < 3) and late (3 ≤ δ < 5) remodeling stage. p-value Kruskal-Wallis. Early: n = 108, min = −3.6, max= 7.07, center = 0.13; Late: n = 15, min = −1.77, max=0.41, center = −0.45. Source Data
Extended Data Fig. 3
Extended Data Fig. 3. SAR manual and digitized staging.
a. Flowchart for manual staging of arteries. b. Bar plot of manually-determined artery stage frequencies per patient. c. Schematic of digitization of artery morphology features. d. Heatmap of quantified digitized morphological features, mean across SAR stages. Columns Z-scored and hierarchically clustered. Source Data
Extended Data Fig. 4
Extended Data Fig. 4. SAR trajectory.
a. Scatter of arteries in LDA space colored by manually-assigned stage. Polynomial fit: remodeling trajectory. Inset: matching each artery point ai to the SAR trajectory by finding the nearest point along trajectory bi. The continuous SAR score δ was then defined as the distance from origin x0 to bi along the trajectory curve. b. Scatter plot of arteries in LDA space colored by δ. c. Violins of artery δs by manual stage d,e. Scatter plots by δ (left) and GA (right) of EVT frequency out of all cells (d), macrophage frequency out of immune cells (e) Red lines, fitted linear regression, regression p-values on top. Source Data
Extended Data Fig. 5
Extended Data Fig. 5. SAR-trending GO pathways.
a. 3 SAR (δ)-trending GO pathways, showing normalized expression of genes in the pathway by SAR (δ): mean over genes +/− SEM. Source Data
Extended Data Fig. 6
Extended Data Fig. 6. Ridge regression for predicting GA.
a. Distribution of GA (in days) across the whole dataset, training (70%) set, and test (30%) set. b. Predicted versus actual δ for ridge regression trained on GA-associated immune features, for the withheld test set (30%). Line; best fit, shaded region; 1 SD. c. Pairwise spatial enrichment relationships, including: temporally coordinated with GA and GA/SAR synchronized. Trend size color coded: red indicates increasing spatial pairwise enrichment, blue indicates decreasing enrichment. Arrow length represents mean spatial enrichment (Z-score) across the entire dataset. Node size represents its number of pairwise relationships. Source Data
Extended Data Fig. 7
Extended Data Fig. 7. EVT distribution.
a. Two hypotheses for intravascular EVT invasion. (Left) Intravasation: orange arrows indicate movements of EVTs from the cell column of the anchoring villi into the decidua and through the wall of the artery into the lumen. (Right) Extravasation: red arrows indicate movement of EVTs from the fetal villi through the intervillous space into the artery. b. Anatomical locations of EVT populations in the decidua. c. Distribution of artery δs, based on the presence of perivascular and/or intravascular EVTs. [Violins left to right] min = 1, max = 2.65, center = 1.7; min = 1.19, max = 3, center = 1.84; min = 1.77, max = 5, center = 3.2; min = 1.6, max = 4.5, center = 2.4. d. Scatter plot of log2(Intravascular/Perivascular) ratio by δ, for arteries with both perivascular and intravascular EVTs present. Black line, fitted linear regression. Regression p-value on top. e. Percentage of arteries with ≤ a given SMA loss (s) threshold, by perivascular or intravascular EVTs present. Arteries were considered to have perivascular or intravascular EVT if the number of EVT in the appropriate compartment was ≥ 5. f. Percentage of arteries with scores ≤ a given endothelial loss (e) threshold, by perivascular or intravascular EVTs present. Arteries were considered to have perivascular or intravascular EVT if the number of EVT in the appropriate artery compartment was ≥ 5. Source Data
Extended Data Fig. 8
Extended Data Fig. 8. EVT Phenotype by Location.
a. Frequency of EVT populations by anatomical location. b. Violin plot of distance from artery (in pixels) by EVT type. EVT1c: N = 209, min = 12.8, max = 1536.7, center (median) = 173.9; EVT1a: N = 7123, min = 10, max = 2028.7, center = 363.6; EVT1b: N = 5908, min = 7.2, max = 1989.5, center = 376.45; EVT1c: N = 185, min= 9.4, max. = 1818.1, center = 475.6. c. Violin plot of the distribution of LD1 for EVTs, by anatomical location. Center lines inside violins indicate mean. Anchoring: N = 8906, min = −3.6, max = 3.9, center = −1; Interstitial: N = 38395, min = −3.4, max = 4.4, center = 0; Perivascular: N = 1097, min = −3.14, max = 4, center = 0.08; Intravascular: N=4040, min = −3.15, max = 4.6, center = 2. d-h: d,e Scatter plots of perivascular (d) and intravascular (e) EVT1c (CD56+) frequency by δ. Red lines, fitted linear regression, regression p-values on top. f. Bar plot of the EVT1c frequency increase rates (regression slopes from d,e). Error bars, 95% confidence interval for regression slopes. g. Paired-by-artery CD56 expression in EVT1a&b, between perivascular and intravascular compartments. Arteries with δ ≥ 2 included. p = 5e-03, one sided paired Wilcoxon signed rank test, z-statistic = 2.5 h. Proportion of Ki67+ intravascular EVT by type. Source Data
Extended Data Fig. 9
Extended Data Fig. 9. Differential gene in EVT.
a. Full heatmap for differentially expressed genes between intravascular and interstitial EVTs showing gene expression (Z-score), (logFC > 2, adj p-value <0.05 using Limma). Source Data
Extended Data Fig. 10
Extended Data Fig. 10. EVT- artery interactions.
a. IHC validation on decidua serial sections for protein counterparts for 3 differentially expressed genes (JAG1, C5ORF30, and EBI3) with controls: HLA-G, CD56, and H&E. 1 section per marker. Scale bar, 100 µm. b. Full NicheNet output: 10 EVT-ligands best predicting receivers expressed in arteries, ranked by Pearson correlation coefficient or the EVT ligand activity ranking metric. Genes differentially expressed in Preeclamptic decidua samples indicated in red. Source Data

Similar articles

Cited by

References

    1. Menkhorst E, Winship A, van Sinderen M, Dimitriadis E. Human extravillous trophoblast invasion: intrinsic and extrinsic regulation. Reprod. Fertil. Dev. 2016;28:406–415. doi: 10.1071/RD14208. - DOI - PubMed
    1. Vento-Tormo R, et al. Single-cell reconstruction of the early maternal–fetal interface in humans. Nature. 2018;563:347–353. doi: 10.1038/s41586-018-0698-6. - DOI - PMC - PubMed
    1. Pijnenborg R, Vercruysse L, Vercruysse M. The uterine spiral arteries in human pregnancy: facts and controversies. Placenta. 2006;27:939–958. doi: 10.1016/j.placenta.2005.12.006. - DOI - PubMed
    1. Burton GJ, Woods AW, Jauniaux E, Kingdom JCP. Rheological and physiological consequences of conversion of the maternal spiral arteries for uteroplacental blood flow during human pregnancy. Placenta. 2009;30:473–482. doi: 10.1016/j.placenta.2009.02.009. - DOI - PMC - PubMed
    1. Brosens I, Pijnenborg R, Vercruysse L, Romero R. The “Great Obstetrical Syndromes” are associated with disorders of deep placentation. Am. J. Obstet. Gynecol. 2011;204:193. doi: 10.1016/j.ajog.2010.08.009. - DOI - PMC - PubMed

MeSH terms