. 2023 Jul;619(7971):860-867.
doi: 10.1038/s41586-023-06324-w. Epub 2023 Jul 19.

KRAS(G12D) drives lepidic adenocarcinoma through stem-cell reprogramming

Affiliations

KRAS(G12D) drives lepidic adenocarcinoma through stem-cell reprogramming

Nicholas H Juul et al. Nature. 2023 Jul.

Abstract

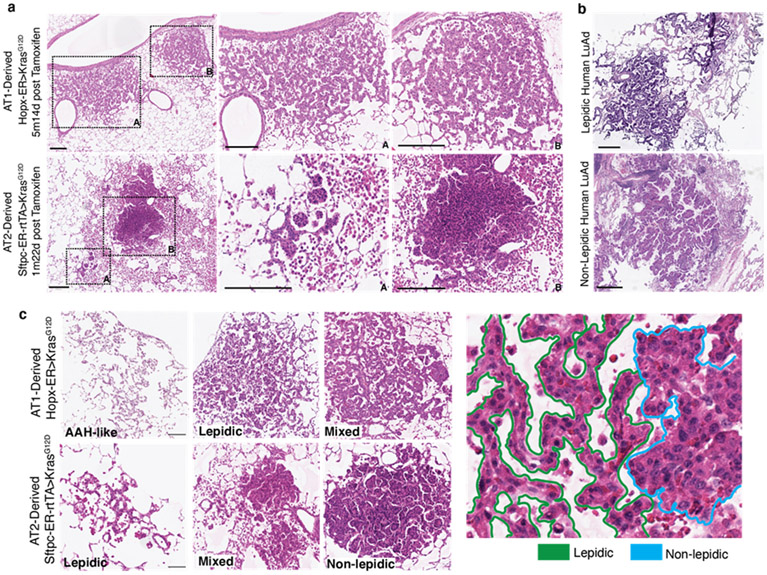
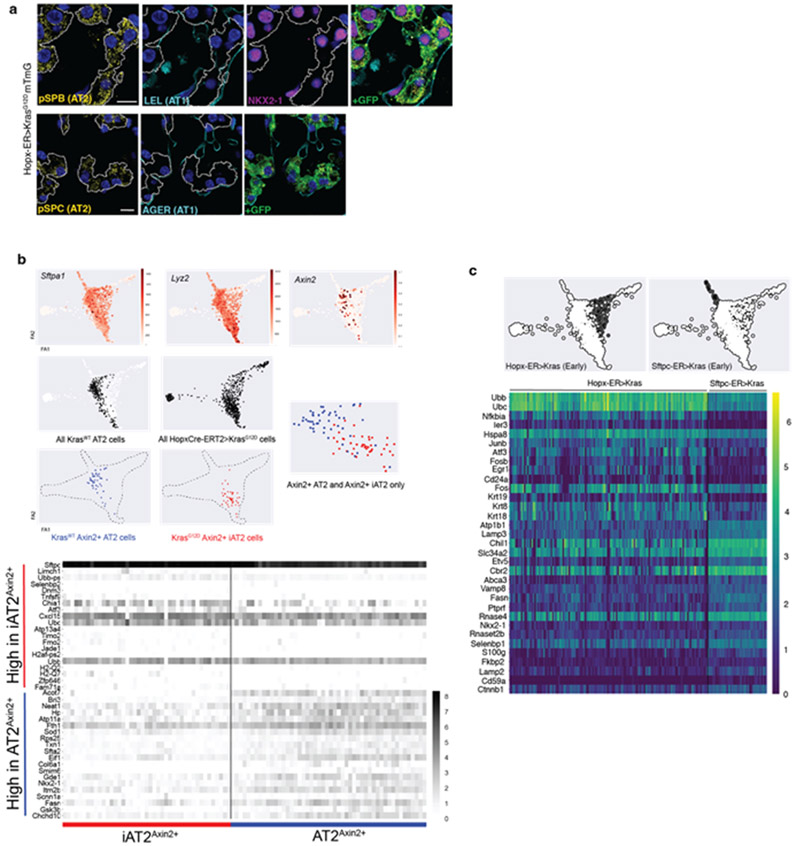
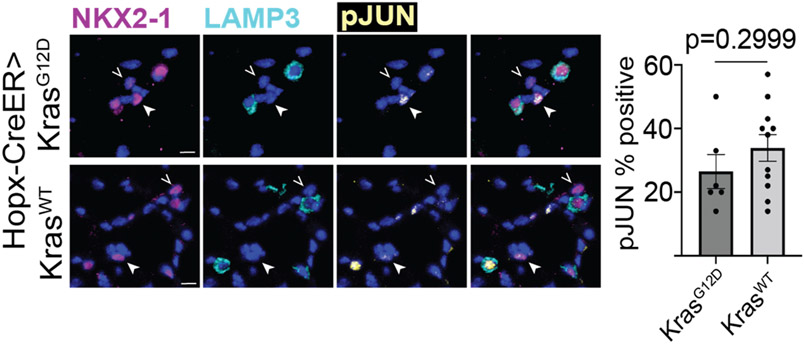
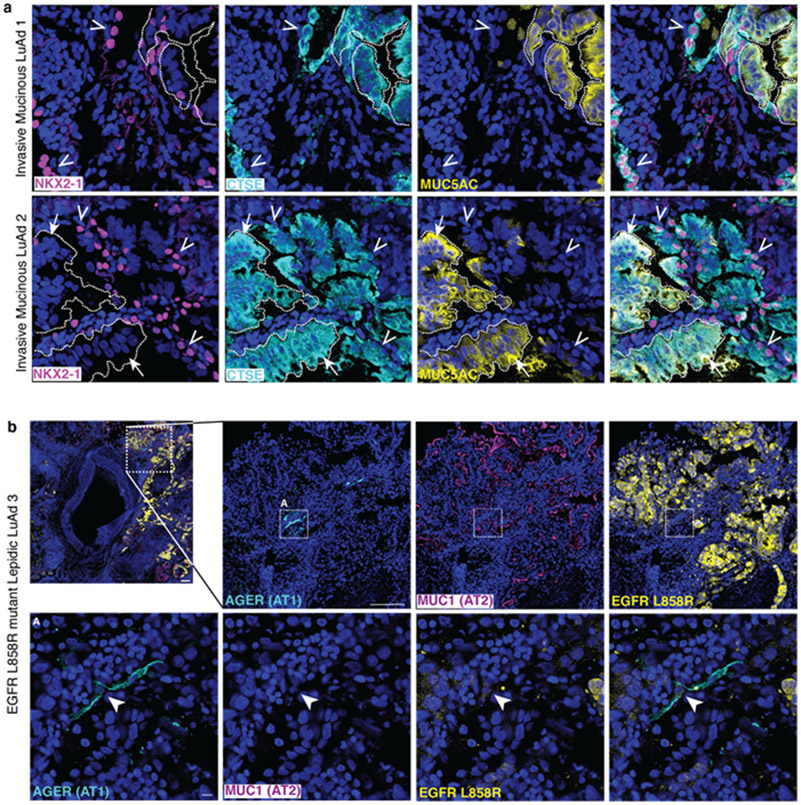
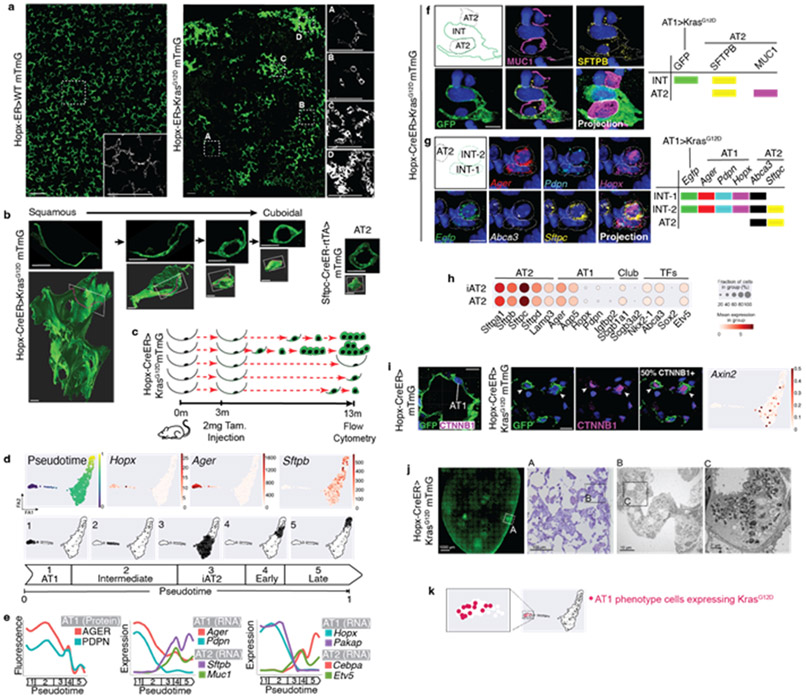
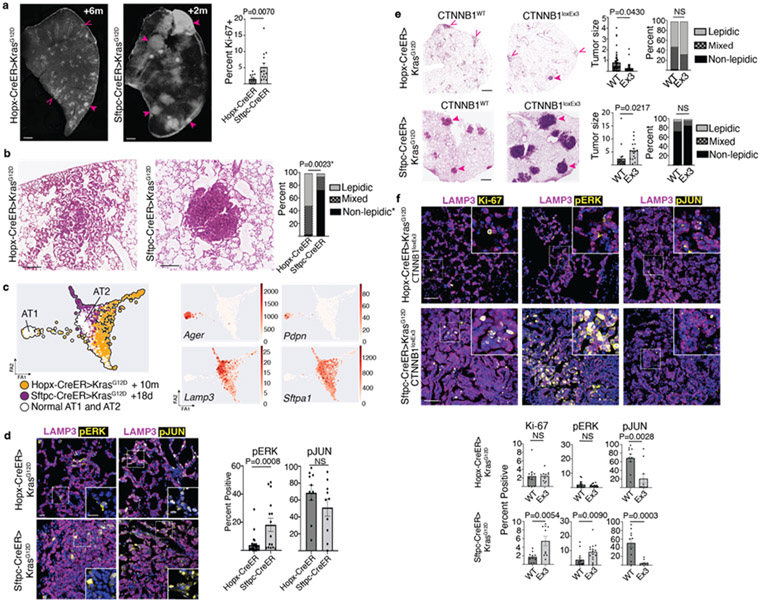
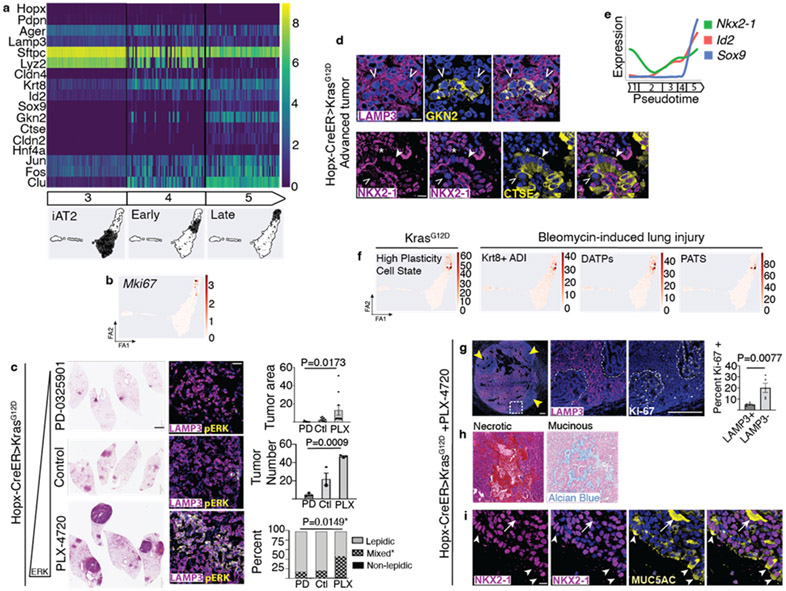
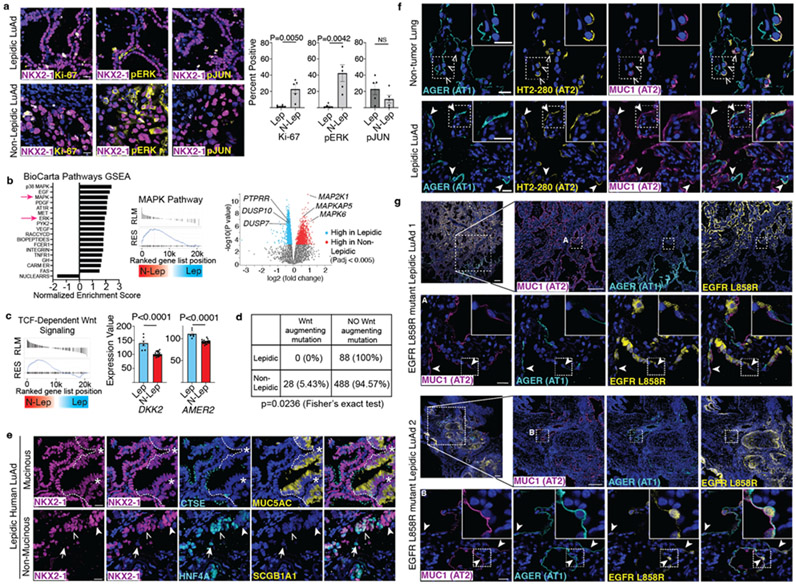
Many cancers originate from stem or progenitor cells hijacked by somatic mutations that drive replication, exemplified by adenomatous transformation of pulmonary alveolar epithelial type II (AT2) cells1. Here we demonstrate a different scenario: expression of KRAS(G12D) in differentiated AT1 cells reprograms them slowly and asynchronously back into AT2 stem cells that go on to generate indolent tumours. Like human lepidic adenocarcinoma, the tumour cells slowly spread along alveolar walls in a non-destructive manner and have low ERK activity. We find that AT1 and AT2 cells act as distinct cells of origin and manifest divergent responses to concomitant WNT activation and KRAS(G12D) induction, which accelerates AT2-derived but inhibits AT1-derived adenoma proliferation. Augmentation of ERK activity in KRAS(G12D)-induced AT1 cells increases transformation efficiency, proliferation and progression from lepidic to mixed tumour histology. Overall, we have identified a new cell of origin for lung adenocarcinoma, the AT1 cell, which recapitulates features of human lepidic cancer. In so doing, we also uncover a capacity for oncogenic KRAS to reprogram a differentiated and quiescent cell back into its parent stem cell en route to adenomatous transformation. Our work further reveals that irrespective of a given cancer's current molecular profile and driver oncogene, the cell of origin exerts a pervasive and perduring influence on its subsequent behaviour.


Figures

Extended Data Figure 1:
Extended Data Figure 1:. Histological features of AT1- and AT2-derived lung adenomas
(a) H&E stains of Hopx-ER>KRASG12D and Sftpc-ER-rtTA>KRASG12D mouse lungs at 5m14d and 1m22d after Kras induction, respectively, showing examples of the lepidic-predominant histology of AT1 derived adenomas (top) and the non-lepidic histology of AT2 derived adenomas (bottom). Note massive macrophage infiltration of the alveolar lumens in the lepidic AT1 tumors that extend multiple alveolar spaces beyond the solid AT2 tumors. (b) H&E stains showing examples of human lepidic and non-lepidic KRAS-driven LuAds. (c) Exemplary H&E stains of histological classifications of AT1- and AT2-derived tumors as quantified in the body of the manuscript. Scale bars, 200 μm (a, c) and 400 μm (b)
Extended Data Figure 2:
Extended Data Figure 2:. Comparison of AT2 and iAT2 cells and their resulting tumors.
(a) Co-staining of early-stage AT1 adenomas shows absence of AT1 (LEL, AGER) and presence of AT2 (SFTPB, SFTPC) markers as well as cuboidal morphologies. (b) Feature plots localizing Axin2+ AT2 and iAT2 in single cell RNA sequencing data demonstrating co-clustering (above) with a heatmap of differentially expressed genes between the two groups (below). (c) Heatmap of the most differentially expressed genes between AT2>Kras cells 18d after Kras induction and early-stage AT1>Kras cells. Note on PAGA that the early-stage AT1 and AT2 tumor populations are distinct from normal AT2 and iAT2 (AT1>Kras) cells and that their trajectories diverge from each other. Scale bars, 10 μm (a) LEL, Lycopersicon esculentum lectin
Extended Data Figure 3:
Extended Data Figure 3:. Phospho-JUN expression in AT1 phenotype cells in Hopx-CreER>KrasG12D and Hopx-CreER>KrasWT mice
Immunostaining of AT1 phenotype cells (NKX2-1+/LAMP3−) in Hopx-CreER>KrasG12D and Hopx-CreER>KrasWT mice for phosphorylated JUN with quantification of pJUN+ (arrowhead) and pJUN (open arrowhead) cells (n=2 WT mice and 4 KrasG12D mice, 3 25x fields per mouse). Scale bars, 10 μm
Extended Data Figure 4:
Extended Data Figure 4:. Heterogeneous molecular states in invasive mucinous LuAd and driver mutation-carrying squamous cell in human lepidic LuAd
(a) Co-staining of human invasive mucinous LuAd showing co-expression of MUC5AC and CTSE by NKX2-1 tumor cells (arrows). Non-mucinous tumor regions are molecularly diverse, containing NKX2-1+CTSE+ (open arrowheads), NKX2-1CTSE+, and NKX2-1+CTSE cells (n=2 individuals). (b) Co-staining of an EGFR L858R mutant human lepidic LuAd reveals an isolated squamous AGER+Muc1 cell in the tumor periphery that is faintly positive for the mutation-specific antibody (arrowhead). Scale bars, 20 μm (a, b lower row) 200 μm (b, upper row)
Figure 1:
Figure 1:. KrasG12D asynchronously reprograms AT1 cells into AT2Axin2 stem cells
(a) AT1 membrane marking (GFP, green) shows uniformly flat AT1 cells in control lung (left) and cells with variable morphologies 6m after Kras induction (right). (b) 2D sections (top) and 3D reconstructions (below) of Kras-activated AT1 cells at progressive stages of morphological transition and an AT2 cell (far right). (c) Schematic of scRNA sequencing experiment for Hopx-CreER>KrasG12D mTmG mouse showing asynchronous AT1-to-iAT2 transition and tumor initiation. (d) PAGA of 696 AT1-lineage cells 10m after Kras induction with pseudotemporal ordering and feature plots of representative genes. (e) Levels of AT1 protein markers (left), AT1 and AT2 cell type markers (middle) and transcription factors (right) over pseudotime. Multimodal appearance to AGER and PDPN expression as well as transient drops in expression of Sftpb, Muc1, Cebpa, and Etv5 between pseudotime groups 4 and 5 are an artifact of splining. (f, g) AT1-to-AT2 intermediates (INT) in intact lung by immunostaining and (g) multiplex in situ hybridization. (h) Dot plot comparing lung cell type marker expression in AT2 and iAT2 cells. (i) Representative images show absence of nuclear ß-catenin in AT1 cells (left) and presence in cuboidal Kras-induced AT1 cells (middle, arrowheads). Axin2 feature plot shows absence in AT1 and AT1-to-iAT2 intermediate cells with subsequent emergence at iAT2 stage. (j) Pre-fixation endogenous fluorescence, toluidine blue stained semi-thin section, and transmission electron microscopy images demonstrating lamellar bodies in AT1-derived tumor cells. (k) PAGA of Hopx-ER>KrasG12D mTmG mouse highlighting 13 AT1-phenotype cells with KrasG12D mutant transcripts 10 months after recombination. Scale bars, 100μm (a), 10μm (b, f, g, i), or as indicated (j). iAT2, induced AT2; m, months; INT-1, intermediate cell 1; INT-2, intermediate cell 2; m, months; PAGA, Partition-Based Graph Abstraction; Tam, tamoxifen; TFs, transcription factors.
Figure 2:
Figure 2:. AT1 derived lung adenomas are histologically, molecularly, and functionally distinct from AT2 derived adenomas
(a) Lung lobe sections 6m after Kras induction in AT1 cells (left) or 2m after induction in AT2 cells (middle) with non-solid (open arrowheads) and solid (closed arrowheads) tumors, and quantitation of tumor cell proliferation (right) (n=3 mice per group, five tumors per mouse) (b) Representative close-up H&E stain of an AT1-derived mixed histology adenoma and an AT2-derived solid adenoma with quantification of histology (n=3 mice per group, 9-18 tumors per mouse). (c) PAGA of scRNA-seq profiles of indicated populations with feature plots of AT1 and AT2 markers - 722 Hopx-CreER>KrasG12D, 305 Sftpc-CreER>KrasG12D, and 428 KrasWT cells. (d) Co-staining for LAMP3 (purple) and pERK (left, yellow) or pc-JUN (right, yellow) in AT1 (top) and AT2 (bottom) derived adenomas with quantitation. (n=4 mice for Sftpc-CreER, n=5 mice for Hopx-CreER; 2-5 tumors per mouse; 1-3m after tamoxifen for Sftpc-CreER and 4-6 months after tamoxifen for Hopx-CreER). (e) H&E stain of lungs with AT1 (top) and AT2 (bottom) derived tumors in controls (WT) or with concomitant activation of Wnt signaling (loxEx3) at 4m after Kras induction with quantitation of tumor size and histology (n=2 mice per genotype for Sftpc-CreER, n=11 mice per genotype for Hopx-CreER; 2-10 tumors per mouse; 2m or 4-6m after Kras induction for Sftpc-ER and Hopx-ER mice, respectively). Open arrowheads denote lepidic tumors, closed arrowheads denoted non-lepidic tumors. (f) Representative images and quantitation of proliferation (Ki67), pERK and pJUN in AT1 (top) and AT2 (bottom) derived tumors with (Ex3) and without (WT) activation of Wnt signaling (n= 2 littermate-paired mice per genotype, 5 tumors per mouse, total of 2,041-12,069 tumor cells per group, 2m and 4m after Kras induction for Sftpc-ER and Hopx-ER mice, respectively). Tumor size is represented as 1x105 μm2. Scale bars, 500 μm (a), 200 μm (b), 10 μm (d), 1mm (e), 20 μm (f) d, days; m, months; ns, not significant; PAGA, Partition-Based Graph Abstraction; pERK, phosphorylated ERK; pJUN, phosphorylated c-JUN/JUND; scRNA-seq, single cell RNA sequencing. Data are mean±s.e.m. P values calculated by Student’s unpaired t test.
Figure 3:
Figure 3:. ERK drives AT1 adenoma growth, molecular and histological progression
(a) Single cell profiles over pseudotime reveal emergence of cell-to-cell molecular heterogeneity at Early tumor stage with progressive increase in ERK target genes, lung progenitor and gastric markers. (b) Feature plot shows strong enrichment of Mki67 at Late tumor stage. (c) ERK pathway modulation in Hopx-CreER>KrasG12D mice with representative H&E stains, pERK staining, and quantitation of tumor area, number and histology (n=3 mice per group, 3m post tamoxifen with continual chow provision, ten largest tumors per group for tumor area). (d) Co-staining shows a cluster of GKN2 expressing cells within a LAMP3+ AT1-derived adenoma (above) and AT1-derived tumor cells with normal (arrowhead), reduced (open arrowhead) and absent (asterisk) NKX2-1 expression all positive for CTSE. (e) Maintenance of Nkx2-1 with induction of distal lung embryonic progenitor markers Sox9 and Id2 at Late tumor stage. (f) Gene scores derived from marker genes for high plasticity state in advanced AT2-derived Kras LuAd and for AT2-to-AT1 transitional intermediates in lung injury show enrichment in the same cluster of cells bridging Early and Late AT1 tumor stages. (g) Large ERK-activated AT1 LuAd with loss of Lamp3 in clusters correlating with increased proliferation, with quantitation. (n=5 areas LAMP3−/+). (h) Representative ERK-activated AT1 LuAds with central necrosis (left) or mucinous transformation (right). (i) Co-staining shows MUC5AC in the cytoplasm of NKX2-1+ tumor cells (arrowheads) and filling a lumen (arrow). Scale bars, 10 μm (d, i), 2mm and 20 μm (f), 200 μm (h). PD, PD-0325901 compounded chow; PLX, PLX-4720 compounded chow; Ctl, control chow. Data are mean±s.e.m. P values calculated by ordinary one-way ANOVA (f) and Student’s t test (g).
Figure 4:
Figure 4:. Human lepidic LuAds share histological and molecular features with mouse AT1 derived LuAds
(a) Representative images of human lepidic (top) and non-lepidic (bottom) LuAd stained for proliferation (Ki-67), pERK and pc-JUN (n=5 individuals per group). (b) GSEA evaluating BioCarta pathways of cDNA microarray data from Zabeck et al. of lepidic and non-lepidic LuAds shows enrichment of MAPK and ERK activity in non-lepidic tumors (n=6 lepidic and 21 non-lepidic LuAds) (left). GSEA plot of the BioCarta MAPK pathway (center). Volcano plot of differentially expressed genes in the lepidic and non-lepidic groups highlighting members of the peptidyl-tyrosine dephosphorylation GO, PTPRR, DUSP10, and DUSP7, as well as constituents of MAPK signaling MAP2K1, MAPKAP5, MAPK6. (c) GSEA evaluating for canonical Wnt signaling revealed enrichment in the non-lepidic group (left) while several Wnt inhibitors, including DKK2 and AMER2, were more highly differentially expressed in the lepidic group (right). (d) A comprehensive mutation analysis by Caso et al. into lepidic and non-lepidic tumors reveals a lack of Wnt augmenting mutations in lepidic tumors with a significant number of Wnt augmenting mutations in non-lepidic human LuAd. (e) Human lepidic mucinous (top) and non-mucinous (bottom) LuAd both contain NKX2-1+ cells co-expressing intestinal markers (CTSE, HNF4A, left side of image at top and open arrowhead on bottom panel). The non-mucinous tumor also contains NKX2-1+HNF4A (solid arrowhead) and NKX2-1HNF4A+ (arrow) cells. Mucinous (MUC5AC+) region is NKX2-1Lo (asterisk). (e) Co-staining for AT1 (AGER) and AT2 (MUC1, HT2-280) membrane antibodies shows co-exclusive marking of AT1 and AT2 cells (open arrowheads) in non-tumor human lung (top) but co-expression of AT1 and AT2 markers by squamous cells in human lepidic LuAd (bottom, closed arrowheads). (f) Co-staining of AT1 (AGER), AT2 (MUC1) and driver mutation (EGFR L858R) antibodies in human lepidic LuAd showing ubiquitous oncogene and AT2 marker staining of the tumor but also flat cells in the periphery positive for the driver mutation that co-express both AT1 and AT2 markers (arrowheads) (n=2 individuals). Scale bars, 20 μm (a, e, f, g rows 2 and 4) and 200 μm (g rows 1 and 3) GO, gene ontology; GSEA, Gene Set Enrichment Analysis; Lep, lepidic; N-Lep, non-lepidic; NS, not significant; pERK, phosphorylated ERK; pJUN, phosphorylated c-JUN/JUND Data in bar graphs of a and c are mean±s.e.m. P values calculated by Student’s t test except where indicated otherwise.

Comment in

References

    1. Siegel RL, Miller KD, Fuchs HE & Jemal A Cancer statistics, 2022. CA Cancer J Clin 72, 7–33 (2022). 10.3322/caac.21708 - DOI - PubMed
    1. Desai TJ Developmental Insights into Lung Cancer. Annual review of cancer biology 5, 351–369 (2021). 10.1146/annurev-cancerbio-070820-032858 - DOI
    1. Desai TJ, Brownfield DG & Krasnow MA Alveolar progenitor and stem cells in lung development, renewal and cancer. Nature 507, 190–194 (2014). 10.1038/nature12930 - DOI - PMC - PubMed
    1. Lin C et al. Alveolar type II cells possess the capability of initiating lung tumor development. PLoS One 7, e53817 (2012). 10.1371/journal.pone.0053817 - DOI - PMC - PubMed
    1. Xu X et al. Evidence for type II cells as cells of origin of K-Ras-induced distal lung adenocarcinoma. Proc Natl Acad Sci U S A 109, 4910–4915 (2012). 10.1073/pnas.1112499109 - DOI - PMC - PubMed

Publication types

MeSH terms

Substances