. 2023 Jul;619(7971):876-883.
doi: 10.1038/s41586-023-06329-5. Epub 2023 Jul 19.

Extreme dynamics in a biomolecular condensate

Affiliations

Extreme dynamics in a biomolecular condensate

Nicola Galvanetto et al. Nature. 2023 Jul.

Abstract

Proteins and nucleic acids can phase-separate in the cell to form concentrated biomolecular condensates1-4. The functions of condensates span many length scales: they modulate interactions and chemical reactions at the molecular scale5, organize biochemical processes at the mesoscale6 and compartmentalize cells4. Understanding the underlying mechanisms of these processes will require detailed knowledge of the rich dynamics across these scales7. The mesoscopic dynamics of biomolecular condensates have been extensively characterized8, but their behaviour at the molecular scale has remained more elusive. Here, as an example of biomolecular phase separation, we study complex coacervates of two highly and oppositely charged disordered human proteins9. Their dense phase is 1,000 times more concentrated than the dilute phase, and the resulting percolated interaction network10 leads to a bulk viscosity 300 times greater than that of water. However, single-molecule spectroscopy optimized for measurements within individual droplets reveals that at the molecular scale, the disordered proteins remain exceedingly dynamic, with their chain configurations interconverting on submicrosecond timescales. Massive all-atom molecular dynamics simulations reproduce the experimental observations and explain this apparent discrepancy: the underlying interactions between individual charged side chains are short-lived and exchange on a pico- to nanosecond timescale. Our results indicate that, despite the high macroscopic viscosity of phase-separated systems, local biomolecular rearrangements required for efficient reactions at the molecular scale can remain rapid.


Conflict of interest statement

Competing interests

The authors declare no competing interests.

Figures

Extended Data Fig. 1.
Extended Data Fig. 1.. Dependence of phase separation on solution conditions and droplet fusion dynamics.
a. Phase separation is most pronounced in a charged-balanced mixture of H1 and ProTα. The extent of droplet formation was assessed using turbidity at 350 nm in TEK buffer with 50 mM KCl and at 120 mM KCl at a constant concentration of H1 (10 μM and 20 μM, at 50 mM and 120 mM KCl, respectively) and varying amounts of ProTα. At both salt concentrations, maximum phase separation was observed at a stoichiometric ratio of 1.2:1 for ProTα:H1, where the charges of the two proteins balance. b. Lohman-Record plot(Record, Anderson, and Lohman 1978) of the ionic strength dependence of the dilute (cdilute) over dense-phase protein concentration (cdense). If we treat the ratio cdilute/cdense as an effective equilibrium constant for the partitioning of H1 and ProTα between the dilute and dense phases, its logarithm approximates the free energy difference between the heterodimer in the dilute phase (Extended Data Fig. 2) and in the dense phase. The slope of a graph of these values versus the logarithm of the ionic strength (or salt concentration) can then be interpreted in terms of the number of ions released(Record, Anderson, and Lohman 1978) upon the transfer of a ProTα-H1 dimer into the dense phase (since Log(cdilute/cdense) diverges close to the critical point, we only included data points up to 120 mM KCl). The resulting value of 2.5±0.7 ions (uncertainty from error of the fit) is small compared to the ~18 ions released upon ProTα-H1 dimerization(Borgia et al. 2018; Sottini et al. 2020), in accord with the small number of additional charge-charge interactions of ProTα in the dense phase compared to the heterodimer obtained from the simulations (Fig. 3e). Note that cdilute = 35±5 μM at an ionic strength of 165 mM, which explains why no phase separation was observed in the NMR experiments of ProTα and H1 reported previously(Borgia et al. 2018). Even at the highest protein concentrations used there, the signal is expected to be dominated by the dilute phase, and in case droplets did form, their volume fraction was presumably too small to be apparent by eye. We chose to work at an ionic strength of 128 mM in the present work as a compromise between physiologically relevant salt concentrations and experimental feasibility, especially regarding sample consumption. c. The droplet relaxation time upon droplet fusion (measured in dual-trap optical tweezers(Alshareedah, Kaur, and Banerjee 2021), see Fig. 1c) is proportional to the radius of the final droplet, which indicates that the viscoelasticity of the dense phase on the millisecond timescale is dominated by the viscous (rather than the elastic) component(Alshareedah, Kaur, and Banerjee 2021). In this case, the slope of the fit (dashed line) is(Leal 2007; Jeon et al. 2018) (2λ+3)(19λ+16)/[40λ+1]·ηs/σ, where λ=ηm/ηs is the ratio of macroscopic (or bulk) viscosity in the droplet over the solvent viscosity (ηs = 0.001 Pa s), and σ is the interfacial tension. With the resulting value of 2.4·103 s/m for the slope and ηm = 0.3 Pa s, we estimate σ ≈ 1.2·10−4 N/m.
Extended Data Fig. 2.
Extended Data Fig. 2.. The ProTα-H1 dimer is the dominant population in the dilute phase.
Single-molecule transfer efficiency histogram of ProTαC (labeled at position 56 and 110) in the dilute phase at 128 mM ionic strength (TEK buffer including 120 mM KCl). The phase-separated mixture was centrifuged, so that the dense phase coalesced into a single large droplet and no small droplets remained in the dilute phase. The dilute phase was aspirated and transferred into a sample chamber for single-molecule measurements. In the fit (lines), the centers of the Gaussian peak functions were constrained to the transfer efficiencies measured for unbound ProTα and the ProTα-H1 dimer (Fig. 2f) to within experimental uncertainty. The shaded peak near a transfer efficiency of zero originates from molecules lacking an active acceptor dye.
Extended Data Fig. 3.
Extended Data Fig. 3.. Polarization-resolved fluorescence probing rotational effects.
a. Donor and acceptor emission autocorrelations (green and red, respectively; parallel vs perpendicular channels) and donor-acceptor crosscorrelation (purple; sum of correlations of respective parallel and perpendicular channels) of the FRET-active subpopulation of labeled ProTαC in the dense phase when a polarizing beam splitter is used show an asymmetry of the branches for positive and negative lag-times, τ, in the positively correlated component (correlation time of 30 ns). In contrast, this component is more symmetric when a 50-50 beam splitter is used (b), indicating that the component is caused by residual polarization anisotropy. (c-h) Time-resolved anisotropy decays, r(t), measured for double-labeled ProTαC unbound (c, d), in the dimer (e,f), and in the dense phase (g,h) with pulsed interleaved excitation using (c, e, g) photons from donor-only bursts (transfer efficiency < 0.1, excitation at 532 nm) or (d, g, h) acceptor photons from bursts with transfer efficiency > 0.2 (excitation at 635 nm). Data were fitted with the function rt=r0(1Arotet/τfast+Aslow)et/τslow (dashed black lines)(Lipari and Szabo 1980) with r0=0.4. No significant amplitude Aslow for a slow component is present for free ProTαC (c, d), and only a small amplitude in the dimer (e, f). In the dense phase (g, h), a distinct slow decay component is observed in the anisotropy decay, which is well described with the decay time τslow = 30 ns from the correlated component of the nsFCS (a, b). This agreement further supports the role of residual rotation as the source of the latter. (i, j) Time-resolved anisotropy decays for free Cy3B in the dilute (i) and dense phase (j). The dilute-phase decay was fit with a single exponential, rt=r0et/τ, and the resulting value of τ=0.53ns was used to obtain the hydrodynamic radius of Cy3B based on the Stokes-Einstein-Debye relation, τ=(ηeff43πRprobe3)/kbT. With the viscosity of water (0.0010Pas), we obtain 0.80 nm for the radius of Cy3B, within the range of the previously reported values (0.76 nm ± 0.04)(Gilboa et al. 2019). (j) The anisotropy decay in the dense phase was fit with a sum of two exponentials, rt=r0(1Aslowet/τfast+Aslowet/τslow). The effective viscosities obtained from the fast and slow components, τfast and τslow, are reported in Fig. 1e, and we assign the fast component to the rotational diffusion of the dye virtually unaffected by attractive protein interactions. Note that despite the slow rotational component of Cy3B, almost no partitioning of the dye into the droplets was observed (partition constant <1.05 from confocal fluorescence microscopy images).
Extended Data Fig. 4.
Extended Data Fig. 4.. ProTα labeled at positions 2 and 56 (ProTαN) shows behavior similar to ProTα labeled at positions 56 and 110 (ProTαC, Fig. 2).
a. Single-molecule transfer efficiency histograms of ProTαN at 128 mM ionic strength (TEK buffer including 120 mM KCl) as a monomer free in solution (top), in the 1:1 complex with H1 (middle), and within droplets (bottom) measured with continuous-wave excitation. Note the greater compaction in the dense phase compared to the ProTα-H1 dimer than for ProTαC. b. 2D histograms of relative donor and acceptor fluorescence lifetimes versus FRET efficiency for all detected bursts measured with pulsed excitation of ProTαN. The straight line shows the dependence expected for fluorophores separated by a static distance; curved lines show the dependences for fluorophores that rapidly sample a distribution of distances (self-avoiding walk (SAWν)(Zheng et al. 2018), see Methods; upper line: donor lifetime; lower line: acceptor lifetime). c. nsFCS probing chain dynamics based on intramolecular FRET in double-labeled ProTαN; data show donor–acceptor fluorescence cross-correlations with fits (black lines). Reconfiguration times, τr, are averages of n = 3 independent measurements (uncertainties discussed in Methods).
Extended Data Fig. 5.
Extended Data Fig. 5.. Full FCS curves with logarithmic binning.
Donor and acceptor autocorrelations (green, red) and donor-acceptor crosscorrelations (purple; same color scheme as in Fig. 2h, which shows the same data and fits but on a linear scale and normalized to an amplitude of 1 at ±3 μs) of ProTαC (labeled at position 56 and 110) in 128 mM ionic strength (TEK buffer with 120 mM KCl) as an unbound monomer in solution (a), in the 1:1 complex with H1 (b), and within ProTα-H1 droplets (c). For each sample, the three correlations are fitted globally (black solid lines, see Methods) with shared correlation times for translational diffusion (τD), triplet blinking (τT), dye rotation (τrot), and conformational dynamics (τcd); photon antibunching (τab) is fitted individually. τcd was then converted to the reconfiguration time of the chain, τr, as previously described(Gopich et al. 2009) (we note that the conversion from τcd to τr does not entail a large change in timescale, and τcd and τr differ by less than 20% in all cases investigated here). τD, τT, τrot, τr, and τab are shown in the panels if the corresponding term was included in the fit function (Eq. 6), and they point to their respective timescales. The value of τr reported here is the mean of three measurements, as in Fig. 2h, and corresponds to the distance correlation time between the dyes at position 56 and 110.(Gopich et al. 2009) τT in the donor-acceptor cross correlation in (B) shows a small negative amplitude, possibly indicating a slight contribution of slower distance dynamics on the microsecond timescale. Note that the deviation between fit and measurement in (c) for the translational diffusion component is caused by sample scanning, which was required to improve statistics inside the droplets.
Extended Data Fig. 6.
Density profiles of protein, water, all components (protein, water, and ions; left), and ions (right) along the Z axis (see inset on the right) of the simulation box. The water density in the dense phase (central part of the slab, 15 nm < Z < 30 nm) is ~80.7% of the water density in the bulk regions (Z < 2.5 nm and Z > 40.0 nm). The number density of ions in the dense phase (15 nm < Z < 30 nm) is ~88.4% of the value close to the box edges (Z < 1.5 nm and Z > 41.0 nm). With respect to only the water density in the respective phases, the ion concentration is ~10% higher in the dense phase than in the dilute phase.
Extended Data Fig. 7.
Extended Data Fig. 7.. Equilibration of dense phase simulation, stability of H1 globular domain in simulations, and robustness to cutoff variation.
a. Protein density in the central part of the slab simulation as a function of time, calculated in 50-ns blocks. The first 1.5 μs of the simulation (shaded band) were treated as equilibration and omitted from further analysis. b. Stability of the H1 globular domains (GDs), quantified as the backbone RMSD between simulated and experimental structure (PDB 6HQ1)(Martinsen et al. 2022), over the course of dimer (left) and dense-phase simulations (middle). The fraction of partially unfolded domains (< 10% with RMSD > 0.4 nm) is in line with the experimental stability previously determined in dilute solution(Martinsen et al. 2022). Note that the backbone RMSD of 0.2-0.4 nm for the folded domain can be attributed to the flexibility of the loops in the structure, illustrated by superposition of two structures with RMSD = 0.4 nm (right). c. Histograms of the number of H1 chains simultaneously interacting with a single ProTα chain (left) and vice versa (middle) using different distance cutoffs (see legend; 1.0 nm(Abraham et al. 2015) was used in Fig. 3c). Note that the number of ProTα chains interacting with a single H1 chain is always ~1.2 times the number of H1 chains interacting with a single ProTα chain, as expected from charge balance (Extended Data Fig. 1a). d. Average number of contacts that each residue of ProTα makes in the heterodimer with H1 (gray) and in the dense phase (purple) with different distance cutoffs (1.0 nm — approximately the Bjerrum length — was used in the Fig. 3e). As expected, the increase of the number of contacts with the cutoff is more pronounced in the dense phase than in the dimer, reflecting the higher protein density in the condensate. Owing to the computational costs of the distance calculations for each residue (10,752 distances in total), only 500 ns of the dense-phase trajectory (2.0 to 2.5 μs) were used for cutoff variation (in contrast to Fig. 3e, where the complete trajectory was used). e. Distribution of the lifetimes of contacts formed by ProTα residues in the dimer (gray) and in the dense phase (purple) using different upper bounds for the contact definition (see Methods; 0.8 nm(Best, Hummer, and Eaton 2013) was used in Fig. 3f). Owing to the computational costs of the lifetime calculations, only 500 ns of the dense-phase trajectory (1.5 to 2.0 μs) and only one dimer simulation was used for cutoff variation (in contrast to Fig. 3f, where the complete trajectory was used). While the increased cutoff leads to a slight increase in the absolute value of the lifetimes, the reported trends are consistent: the distributions of longer-lived contacts are very similar for the dimer and dense-phase simulations, and the number of short-lived contacts is larger in the dense phase. f. Root-mean-square displacement (RMSD) of the 112 individual ProTα residues with different contact lifetimes (see legend) vs their average frequency of contact formation.
Extended Data Fig. 8.
Extended Data Fig. 8.. Contact lifetime heatmaps.
Average lifetime of residue-residue contacts from 6 simulations of the ProTα-H1 dimer (a) and the dense-phase simulation (b). Numbers along the bottom and left denote the residue numbers of ProTα and H1, respectively. Orange rectangles denote the globular domain (GD) of H1 (residues 22 to 96). Frequency of contacts (i.e. the number of newly formed contacts by one ProTα per nanosecond) calculated from dimer and dense phase simulations are shown in (c), and (d), respectively. Blue and red bars at the top and on the right side of the plots denote positively and negatively charged residues of ProTα and H1, respectively. In general, the N-terminal part of ProTα makes fewer contacts than the rest of the chain both in the dimer and dense phase simulations (see also Fig 3e), and the lifetime of those contacts is on average shorter, especially in the dense-phase simulation. As is obvious from (d), contacts between oppositely charged residues are most frequent. White regions in a and c correspond to reside-residue combinations that were never formed during the simulations. White regions are particularly frequent in the GD, since it remains folded during the dimer simulations (Extended Data Fig. 7b). Some of the GD residues make relatively long-lived contacts, but those contacts are infrequent. In contrast to the dimer simulations, some residues of the GD do form contacts with ProTα residues in the dense phase simulation, since a small fraction of partially unfolded GDs are populated (Extended Data Fig. 7b), as expected from the low equilibrium stability of the GD(Martinsen et al. 2022; Borgia et al. 2018). e-h. Residue type-specific contact lifetime heatmaps. Average lifetimes of residue-residue contacts in the ProTα-H1 dimer (e) and the dense-phase simulations (f) classified by residue types. Excess population of contacts for specific residue pairs in the ProTα-H1 dimer (g) and in the dense-phase simulation (h) (see Methods for details). i. Numbers of contacts for specific residue types in ProTα (red) and H1 (blue). Residue pairs that are never observed (white squares) and extremely long-lived pairs (dark blue) in (e) correspond to residue types that are infrequent in the ProTα and H1 sequence (compare with i). In the dense phase, Arg forms contacts that are on average longer-lived than any other residue (F), in line with the phase separation-promoting role of Arg(Boeynaems et al. 2017; Qamar et al. 2018; Paloni, Bussi, and Barducci 2021; Vernon et al. 2018; Wang et al. 2018). The excess populations (see Methods) of contacts for specific residue pairs suggest that the interactions between charged residues are the most favorable interactions both in the dimer and in the dense-phase simulations. Note that the oppositely charged residues Glu (most abundant residue in ProTα) and Lys (most abundant residue in H1) form the largest number of contacts (g,h) but have lifetimes comparable to other residue pairs (e,f).
Extended Data Fig. 9.
Extended Data Fig. 9.. Lifetime of non-attractive collisional contacts and competitive substitution between residues.
a. We used the transition path times of residue-residue contact breaking as an estimate for the lifetime of non-attractive collisional contacts between two residues. The duration of a contact between two residues was estimated from the time when the distance between any two heavy atoms of the two residues falls below 0.38 nm to the first time when no distance between any two heavy atoms of those residues is below 0.80 nm (see Methods). The transition path time for the breaking of a given contact was estimated as the time from the last time when the distance between any two heavy atoms of the two residues is below 0.38 nm to the first time it reaches 0.8 nm (A). The timescale expected for non-attractive collisions in the dense-phase simulation (shaded area in Fig. 3f) was estimated as the time that includes 95% of all transition path times in the dense-phase simulation. b. Comparison between the contact lifetimes and the transition path times in ProTα-H1 dimer and the dense phase (see legend). The areas under the curves correspond to the total numbers of contact events per chain per nanosecond. c. A fingerprint of rapid exchange or competitive substitution between charged side chains in the dense phase. Average number of contacts at the time when the contact between two residues is broken plotted as a function of the average number of contacts that those two residues make with other residues during the time being in contact. Given the large number of contact events in the dense phase simulation, only every 20’000th data point is plotted. The definition of a contact is identical to the one described in Methods, but the average number of contacts per residue is larger than the one shown in Fig. 3e since in this case the bonds between neighboring residues were also recorded as contacts. The significantly lower value of the slope of a linear fit in the dimer simulation suggests that multiple contacts tend to be broken simultaneously in this case owing to the concerted motions of parts of the protein chains. In contrast, owing to the high local density of potential interaction partners in the dense phase and the competition for contacts, less contacts are broken simultaneously, as the interaction partners are often rapidly substituted (Fig. 3h), resulting in the greater slope in the dense phase simulation.
Extended Data Fig. 10.
Extended Data Fig. 10.. Mean square displacement (MSD) curves from molecular dynamics simualtions simulations reveal subdiffusion.
a. ProTα center-of-mass diffusion of ProTα in the dense phase (purple, average of 96 chains) compared to ProTα in the ProTα-H1 dimer (gray, average of 6 chains). In the dimer, at all timescales investigated, the diffusion of ProTα is Brownian, whereas in the dense phase, we observe subdiffusive behavior at timescales equal to or shorter than the chain reconfiguration time (shaded bands indicate full-length chain reconfiguration time ± uncertainty), as expected in the presence of cooperative dynamics of the network(Guenza 2002) (MSDs are only shown for the time range where the standard deviation σMSD < 0.5·MSD). b,c. Comparison between the diffusion of residue 1 of ProTα, of the central residue 58, and of the ProTα center of mass in the dimer (b) and the dense phase (c). The residues of an ideal chain are expected to show subdiffusive behavior in a time window between tKuhn, the time a residue needs to diffuse over the Kuhn length of the chain, and the time the entire chain takes to diffuse a distance corresponding to its own size(Sokolov 2012), which, for a Rouse chain(Doi and Edwards 1988), approximately corresponds to the chain reconfiguration time, τr. Below tKuhn, the individual residues are expected to diffuse independently of the chain. Building on the ideal chain model, in (f) we report the diffusion exponent for times below 2 ns (approximately tKuhn), where the single-residue behavior is largely unaffected by the slowdown due to chain reconfiguration. d,e. Same data as in (b,c), but in linear scale to highlight the transition at timescales >τr, where the diffusion of the entire chain dominates the diffusion of the individual residues. The yellow and orange vertical lines indicate the MSD traveled by the residue in excess of the MSD of the center of mass of the chain. Dashed lines indicate the slope expected for Brownian dynamics. f. Diffusion of individual ProTα residues (1-112) is examined in terms of their mean squared displacement, MSD(t) = 6Dtα, for timescales shorter than tKuhn (see b,c), where D is the diffusion coefficient, t is the lag time, and α = 1 for Brownian diffusion. Diffusion of the residues in the ProTα-H1 dimer is close to Brownian and does not correlate with the average contact lifetime of the corresponding residues, whereas in the dense phase, the diffusion of the residues is more subdiffusive (α < 1) and shows a negative correlation with their average contact lifetime. The residues in the dense phase with low average contact lifetime show less subdiffusive behavior but form a larger number of contacts per unit time (compare with Fig. 3g).
Fig. 1.
Fig. 1.. Mesoscopic and microscopic properties of ProTα-H1 droplets.
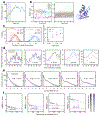
a, Phase diagram from coexistence measurements of dense and dilute phase as a function of salt concentration (each condition n ≥ 3). The total protein density (bottom axis) is based on the measured ProTα concentrations (top axis) and the charge-balanced 1.2:1 ratio at which ProTα and H1 were mixed (Extended Data Fig. 1a). Phenomenological fit with a binodal curve based on Voorn-Overbeek theory(Lin et al. 2019) (solid line). Structural representations of ProTα and H1 are depicted in red and blue, respectively. b, Fluorescence recovery after photobleaching the center of a droplet doped with labeled ProTα. c, Time series of two droplets fusing (scale bar 2 μm; Extended Data Fig. 1c). d, (left) Fluorescence image and representative trajectory of a bead (500 nm diameter) diffusing in a droplet. (right) Mean squared displacement (MSD) from five representative trajectories (gray) and their average (red). e, Probe-size-dependent effective viscosity from measurements of rotational (Extended Data Fig. 3i,j) and/or translational diffusion of Cy3B, dextran, ProTα, and polystyrene beads within droplets using particle tracking (MSD, see d), time-resolved fluorescence anisotropy (Extended Data Fig. 3i,j), single-focus fluorescence correlation spectroscopy (FCS), or two-focus FCS (2f-FCS). The shaded band indicates the range estimated for the correlation length, ξ, in the dense phase. The dashed line shows the dependence expected from the theory of depletion interactions(Tuinier, Dhont, and Fan 2006). Data presented as mean values (n = 20 different beads for tracking, n = 3 different droplets for FCS). Averages and error bars for hydrodynamic radii from the providers or the literature (see Methods); effective viscosity: standard error of the fit for anisotropy; standard deviations for nanorheology and FCS. See Methods for details, the range shown for ξ, and hydrodynamic radius of ProTα. All measurements except a were performed in TEK buffer at 120 mM KCl (ionic strength 128 mM).
Fig. 2.
Fig. 2.. Single-molecule spectroscopy in the dilute and dense phases.
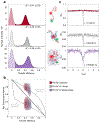
a, Photon time traces in the dilute phase (100 μW laser power) and b, in the ProTα-H1 droplets (30 μW laser power in scanning mode, see c) doped with picomolar concentrations of double-labeled ProTα. c, Single-molecule measurements were performed by positioning the confocal volume in the dilute phase or inside droplets that are stationary at the bottom of the sample chamber. d, Configurations of double-labeled ProTα (red) in the dense phase rapidly sampling different dye-dye distances, with FRET efficiency-dependent fluorescence illustrated in red and green along with a molecular trajectory from MD simulations (e). The scale bar indicates the magnitude of the reconfiguration time, τr, in the dense phase. f, Single-molecule transfer efficiency histograms of ProTαC (ProTα labeled at positions 56 and 110) as a monomer in solution (top), in the heterodimer with H1 (middle), and within droplets (bottom, continuous-wave excitation with scanning, see c). Uncertainties represent the accuracy due to instrument calibration (see Methods). g, 2D histograms of relative donor and acceptor fluorescence lifetimes versus transfer efficiency(Schuler et al. 2016) for all detected bursts (pulsed excitation). The straight line shows the dependence for fluorophores at a fixed distance; curved lines show the dependences for broad distance distributions (self-avoiding walk polymer(Zheng et al. 2018), see Methods; upper line: donor lifetime; lower line: acceptor lifetime). h, Nanosecond fluorescence correlation spectroscopy probing chain dynamics in double-labeled ProTαC free (top), in the ProTα-H1 dimer (middle), and in the dense phase (bottom); data are donor–acceptor fluorescence cross-correlations with fits (black lines, see Extended Data Fig. 5) normalized to 1 at their respective values at 3 μs to facilitate direct comparison. Resulting reconfiguration times, τr, are averages of three independent measurements (fits and uncertainties discussed in Methods). All measurements were performed in TEK buffer at 120 mM KCl (ionic strength 128 mM).
Fig. 3.
Fig. 3.. Large-scale molecular dynamics simulations of ProTα-H1 phase separation.
a, All-atom explicit solvent simulation of 96 ProTα (red) and 80 H1 molecules (blue) in slab geometry(Zheng et al. 2020), including water (light blue spheres), K+ ions (blue spheres), and Cl ions (red spheres). The zoom-in highlights a ProTα molecule (red) and four H1 interaction partners (shades of blue, see Supplementary Videos 1–3). b, Time correlation functions of the distance between residues 5 and 58 (ProTαN) and residues 58 and 112 (ProTαC) from simulations of ProTα unbound (left), in the heterodimer (middle), and in the dense phase (right), with single-exponential fits (dashed lines). c, Histograms of the number of H1 molecules simultaneously interacting with a single ProTα (red) and vice versa (blue). Right: Contributions of each interaction partner to the total number of residue-residue contacts. d, Distance distributions between ProTα residues 58 and 112 in the different conditions (see legend). e, Average number of contacts each residue of ProTα makes in the dimer (gray) and dense phase (purple), with the average total number of contacts indicated. Only ~11% of all ProTα contacts in the dense phase are with other ProTα chains. f, Distribution of the lifetimes of contacts made by ProTα in the heterodimer (gray) and the dense phase (purple). Areas under the curves correspond to the total number of new contacts formed per chain in one nanosecond. Shaded band: contact lifetimes expected for non-attractive collisions (see Extended Data Fig. 9a,b). g, Root-mean-square displacement (RMSD) of the 112 individual ProTα residues within 50 ns vs their average frequency of contact formation (color scales: average contact lifetimes; horizontal dashed lines: average RMSD at 50 ns for the center of mass of ProTα in the dimer (gray) and dense phase (purple), a lower bound for the RMSD of the individual residues; numbers of residues with similar RMSD histogrammed on the right). h, Example of rapid exchange between salt bridges in the dense phase, illustrated by two time trajectories of the minimum distance between the residue pairs involved (left) and corresponding snapshots from the simulation (right) (see Supplementary Video 3).
Fig. 4.
Fig. 4.. The complex hierarchy of length- and timescales in phase-separated droplets.
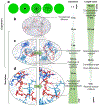
a, Cartoon of a FRAP experiment reflecting (b) translational diffusion of protein molecules inside droplets. c, Chain reconfiguration is linked to the rapid exchange between interaction partners on the submicrosecond timescale. d, Intricate networks of competing contacts among residues exchange in nanoseconds (intact salt bridges with inter-charge distance <0.5 nm shown as yellow dotted lines, broken salt bridges as magenta dotted lines). Images in half oval frames are snapshots of the same view at different times.

Similar articles

Cited by

References

    1. Abascal JLF, and Vega C. 2005. ‘A general purpose model for the condensed phases of water: TIP4P/2005’, J. Chem. Phys, 123: 234505. - PubMed
    1. Abraham MJ, Murtola T, Schulz R, Pall S, Smith JC, Hess B, and Lindahl E. 2015. ‘GROMACS: High performance molecular simulations through multi-levelvparallelism from laptops to supercomputers’, SoftwareX, 1-2: 19–25.
    1. Ahmed R, and Forman-Kay JD. 2022. ‘NMR insights into dynamic, multivalent interactions of intrinsically disordered regions: from discrete complexes to condensates’, Essays Biochem, 66: 863–73. - PMC - PubMed
    1. Alberti S, Gladfelter A, and Mittag T. 2019. ‘Considerations and Challenges in Studying Liquid-Liquid Phase Separation and Biomolecular Condensates’, Cell, 176: 419–34. - PMC - PubMed
    1. Alberts Bruce. 2022. Molecular biology of the cell (W. W. Norton & Company: New York: ).