. 2023 Jul;619(7971):851-859.
doi: 10.1038/s41586-023-06253-8. Epub 2023 Jul 19.

p53 governs an AT1 differentiation programme in lung cancer suppression

Affiliations

p53 governs an AT1 differentiation programme in lung cancer suppression

Alyssa M Kaiser et al. Nature. 2023 Jul.

Abstract

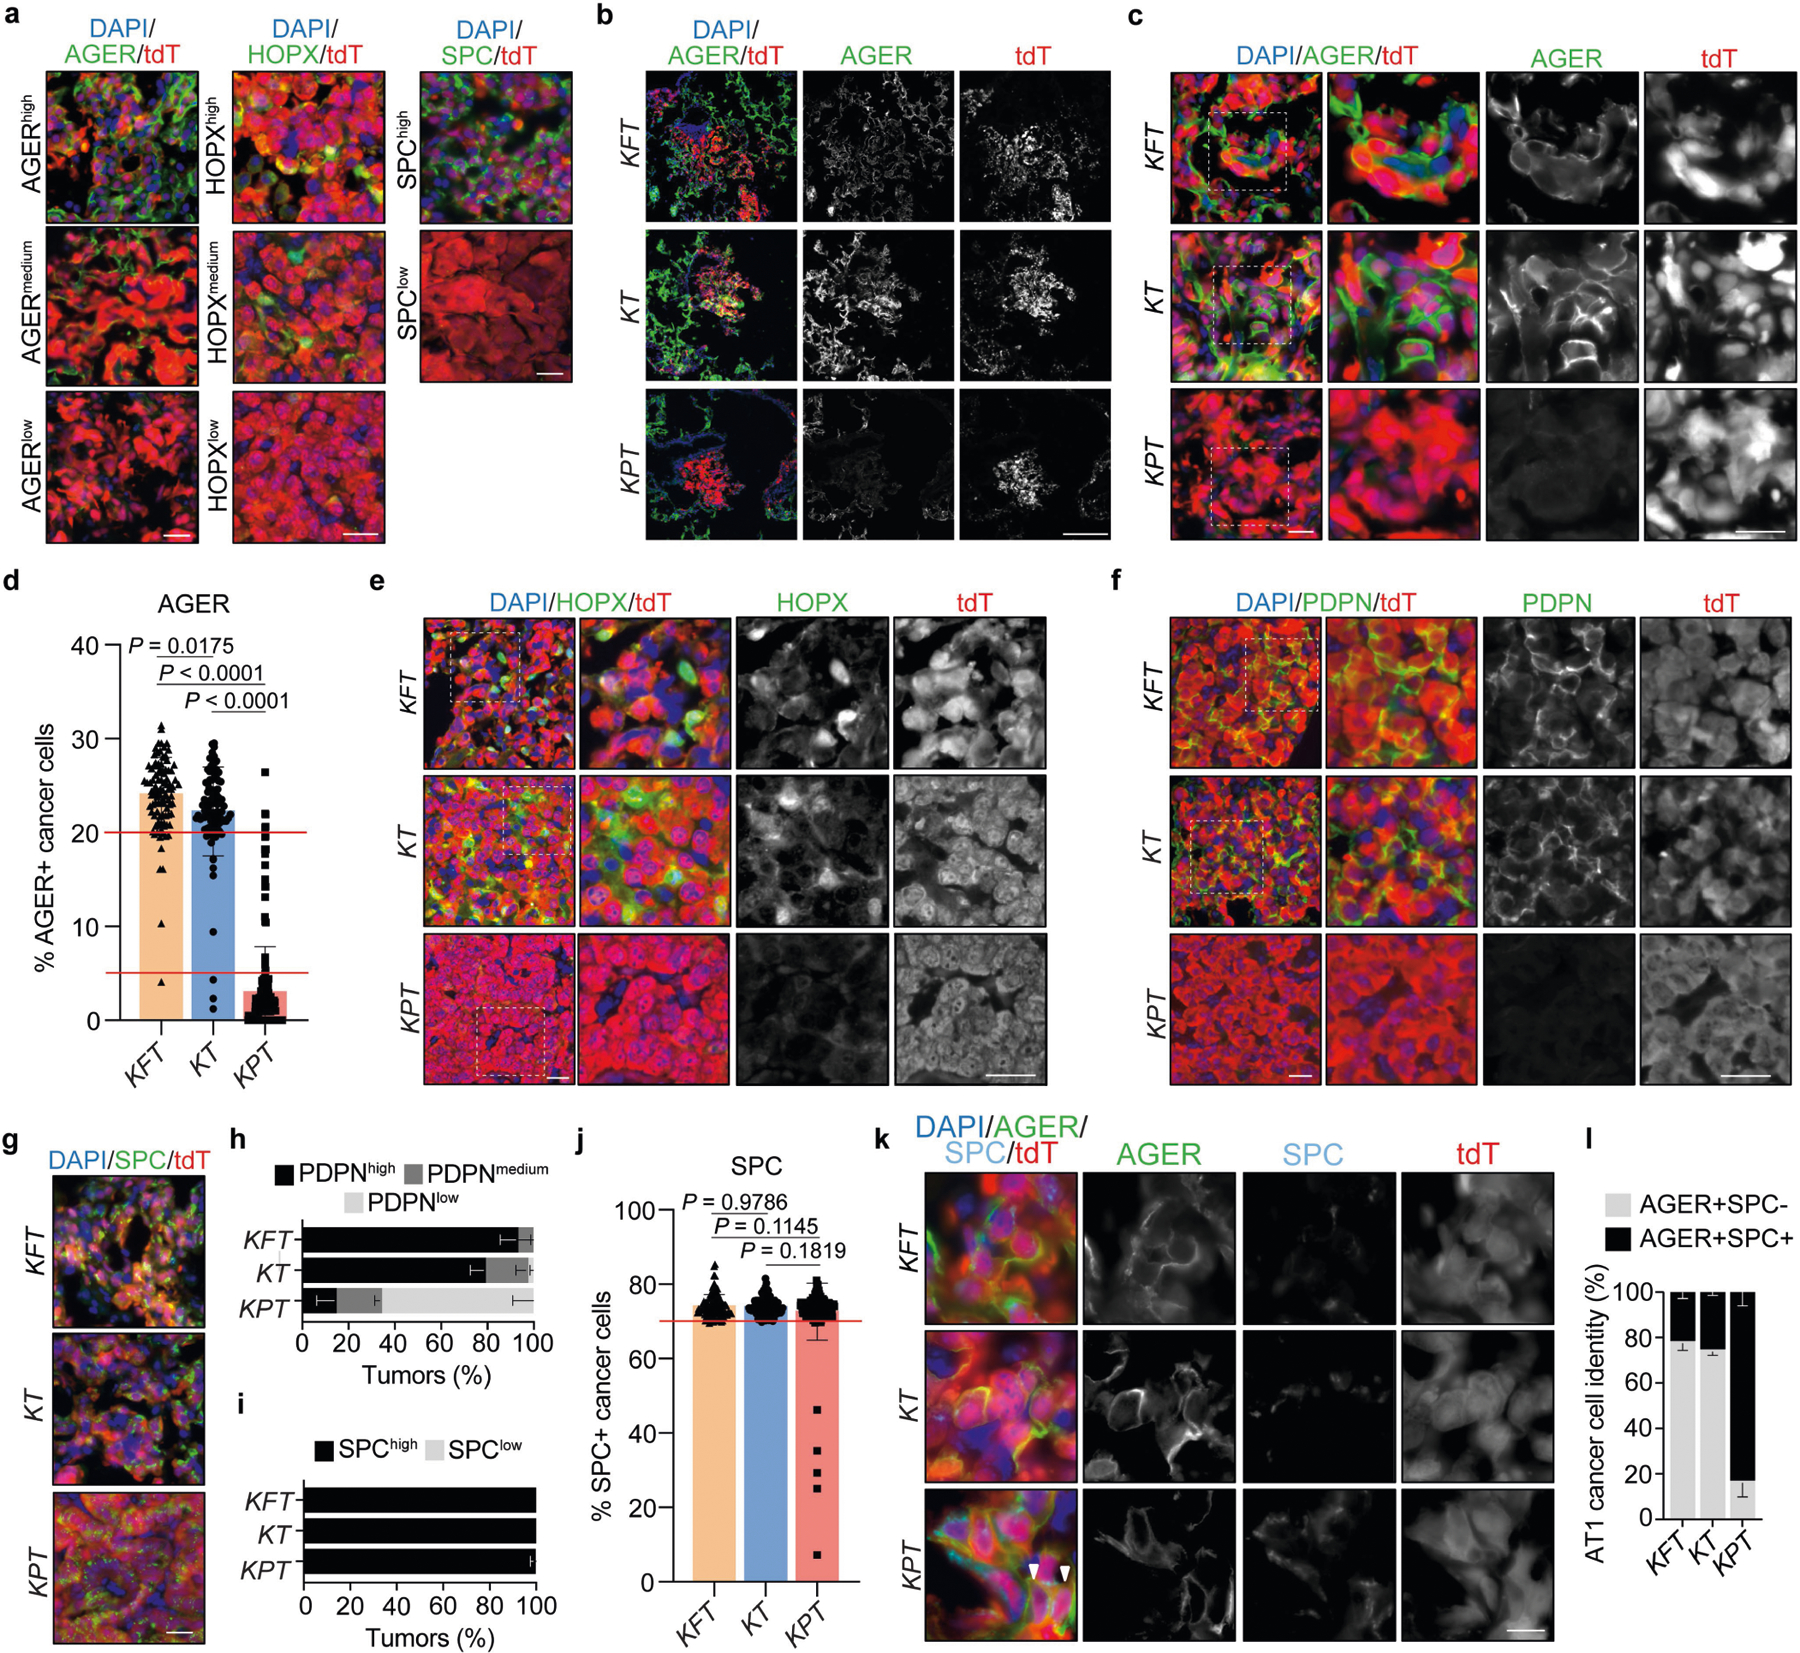
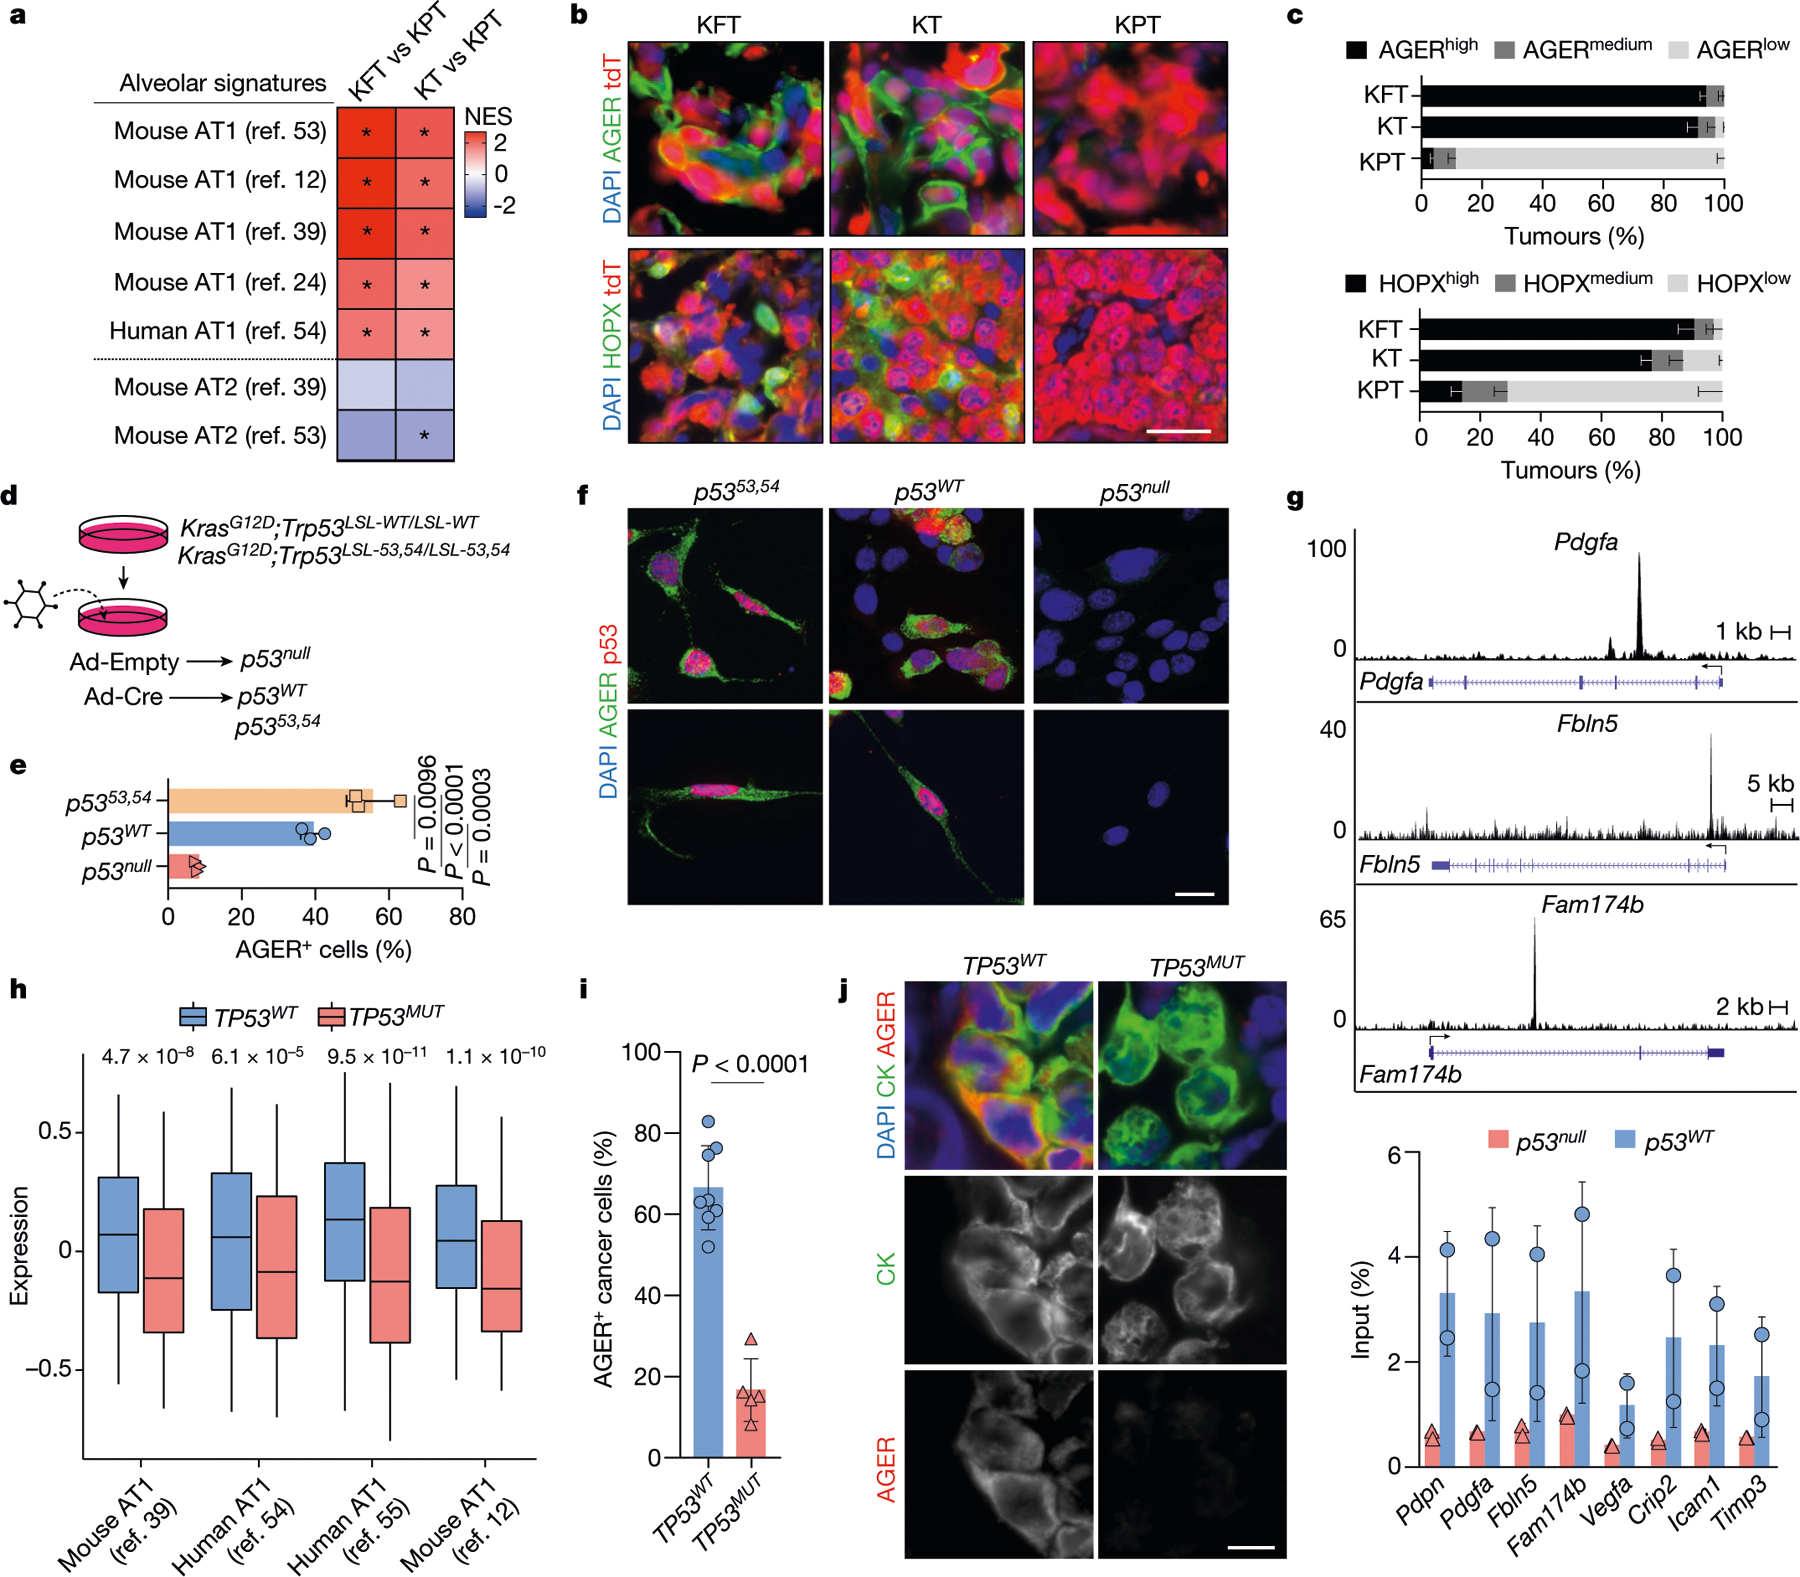
Lung cancer is the leading cause of cancer deaths worldwide1. Mutations in the tumour suppressor gene TP53 occur in 50% of lung adenocarcinomas (LUADs) and are linked to poor prognosis1-4, but how p53 suppresses LUAD development remains enigmatic. We show here that p53 suppresses LUAD by governing cell state, specifically by promoting alveolar type 1 (AT1) differentiation. Using mice that express oncogenic Kras and null, wild-type or hypermorphic Trp53 alleles in alveolar type 2 (AT2) cells, we observed graded effects of p53 on LUAD initiation and progression. RNA sequencing and ATAC sequencing of LUAD cells uncovered a p53-induced AT1 differentiation programme during tumour suppression in vivo through direct DNA binding, chromatin remodelling and induction of genes characteristic of AT1 cells. Single-cell transcriptomics analyses revealed that during LUAD evolution, p53 promotes AT1 differentiation through action in a transitional cell state analogous to a transient intermediary seen during AT2-to-AT1 cell differentiation in alveolar injury repair. Notably, p53 inactivation results in the inappropriate persistence of these transitional cancer cells accompanied by upregulated growth signalling and divergence from lung lineage identity, characteristics associated with LUAD progression. Analysis of Trp53 wild-type and Trp53-null mice showed that p53 also directs alveolar regeneration after injury by regulating AT2 cell self-renewal and promoting transitional cell differentiation into AT1 cells. Collectively, these findings illuminate mechanisms of p53-mediated LUAD suppression, in which p53 governs alveolar differentiation, and suggest that tumour suppression reflects a fundamental role of p53 in orchestrating tissue repair after injury.


Figures

Extended Data Fig. 1 |
Extended Data Fig. 1 |. p5353,54 suppresses late-stage lung adenocarcinoma better than wild-type p53.
(a) Representative Western blot for p53 and GAPDH in p53LSL-wt/p53LSL-wt (n = 3) and p53LSL-53,54/LSL-53,54 (n = 3) LUAD cell lines infected with adenoviral (Ad)-Empty or Ad-Cre for 48 h. Samples were run on the same gel. For gel source data, see Supplementary Figure 1. LSL, lox-stop-lox. (b) RT-qPCR of a panel of p53 target genes in p53LSL-wt/p53LSL-wt (n = 3) and p53LSL-53,54/LSL-53,54 (n = 3) cell lines infected with Ad-Empty or Ad-Cre for 48 h. (c) Schematic for the 24-week lung cancer study. Histology cohort: KFT (n = 6), KT (n = 5), and KPT (n = 5) mice. (d) Representative histological H&E images of 24-week lungs from KFT (n = 6) and KT (n = 5) mice. Scale bar, 100 μm. (e) Quantification of 24-week lung tumor burden, number, and size (n = 112, 268 and 1,429 tumors for KFT, KT, and KPT cohorts, respectively). (f) Histopathological analysis of tumor patterns in 24-week KFT (n = 8), KT (n = 8), and KPT (n = 5) mice. Chart displays the percentage of mice that displayed tumors of a given pattern. NE, neuroendocrine; AAH, atypical adenomatous hyperplasia. (g) Histopathological analysis of tumor pleomorphism (see Methods) in 24-week KFT (n = 8), KT (n = 8), and KPT (n = 5) mice. The chart displays the percentage of mice that displayed tumors of a given score. (h) Histopathological analysis of mitotic activity in the most advanced lesion in 24-week KFT (n = 8), KT (n = 8), and KPT (n = 5) mice. HPF, high powered field. (i) Representative Ki67 IHC in tumors from 24-week KFT (n = 4) and KT (n = 4) mice. Scale bar, 50 μm. ( j) Percentage Ki67-positive nuclei in (n = 20) tumors in 24-week KFT (n = 4) and KT (n = 4) mice. All data are mean ± s.d. P values were calculated by two-tailed Student’s t-test (b, j) and Kruskal-Wallis test with multiple comparisons (two-stage linear step-up procedure of Benjamini, Krieger, and Yekutieli) (e, h).
Extended Data Fig. 2 |
Extended Data Fig. 2 |. p5353,54-mediated tumor suppression is dependent upon its expression in AT2 cells.
(a) Schematic for the 10-week AT2 cell-of-origin tumor study. (b) Representative histological H&E images of lungs from 10-week KFT (n = 8), KT (n = 8), and KPT (n = 5) mice. Images below are a higher magnification view of the image above. Scale bars: top, 5 mm; middle, 500 μm; bottom, 50 μm. (c) Representative Ki67 and phosphohistone H3 (pHH3) IHC in tumors from 10-week KFT (n = 4), KT (n = 4), and KPT (n = 4) mice. Scale bar, 50 μm. (d) Percentage Ki67-positive nuclei in (n = 20) tumors in 10-week KFT (n = 4), KT (n = 4), and KPT (n = 4) mice. (e) Percentage pHH3-positive nuclei in (n = 20) tumors in 10-week KFT (n = 4), KT (n = 4), and KPT (n = 4) mice. (f) Schematic for the 10-week cancer cell autonomy study. Histology cohort: KT;p53LSL-53,54/+ (KFT-LSL) (n = 8) and KT;p53LSL-wt/+ (KT-LSL) (n = 8) mice. The results of this study demonstrate that p5353,54 expression in AT2 cells results in enhanced tumor suppression. (g) Quantification of lung tumor burden, number, and size (n = 83 and 213 tumors for KFT-LSL and KT-LSL cohorts, respectively). (h) Representative Ki67 IHC in tumors from KFT-LSL (n = 4) and KT-LSL (n = 4) mice. Scale bar, 50 μm. (i) Percentage Ki67-positive nuclei in (n = 20) tumors from KFT-LSL (n = 4) and KT-LSL (n = 4) mice. ( j) Representative IF of HOPX or PDPN and tdTomato (tdT) in KFT-LSL (n = 3) mice and KT-LSL (n = 3) mice. Scale bar, 20 μm. (k) HOPX and PDPN quantification in (n = 50 [KFT-LSL] and 100 [KT-LSL]) tumors in KFT-LSL (n = 3) mice and KT-LSL (n = 3) mice (see Methods). Tumors were binned based on the percentage AT1 marker positivity of tdTomato+ cells. Low = 0–5%, medium = 5–20%, high = 20–100%. All data are mean ± s.d. P values were calculated by ordinary one-way ANOVA with Tukey’s multiple comparisons test (d-e), two-tailed Mann Whitney U test (g), and two-tailed Student’s t-test (i).
Extended Data Fig. 3 |
Extended Data Fig. 3 |. p5353,54 and wild-type p53 induce transcriptional and epigenetic profiles distinct from p53-deficient programs.
(a) FACS-sorting and library preparation schematic (see Methods). RIN, RNA integrity number. (b) Unsupervised hierarchical clustering of RNA-sequencing samples from KFT (n = 4), KT (n = 3), and KPT (n = 4) mice. (c) Heatmap of the 5,065 differentially expressed genes (DEGs, P-adjusted ≤ 0.05) between p53-proficient (KFT and KT) and p53-deficient (KPT) cells. DEGs identified in the analysis of KFT vs. KPT cells and KT vs. KPT cells are shown. (d) Significantly enriched gene ontology (GO) biological process terms in p5353,54 hyperactivated genes, identified by PANTHER. (e) GO term analysis by PANTHER of genes upregulated in KT or KPT cells. (f) GSEA shows enrichment of the indicated GO biological process term in KT cells relative to KPT cells. NES, normalized enrichment score. (g) Percentage of all called peaks that are differentially accessible in the ATAC-sequencing experiments. (h) Principal component analysis of the KT (n = 4) vs. KPT (n = 4) ATAC-sequencing samples. (i) Peak annotation of differentially accessible regions in KT vs. KPT ATAC-sequencing experiment. UTR, untranslated region. ( j) Principal component analysis of the KFT (n = 2) vs. KT (n = 2) ATAC-sequencing samples. (k) Peak annotation of differentially accessible regions in KFT vs. KT ATAC-sequencing experiment. P values were calculated by GSEA (f).
Extended Data Fig. 4 |
Extended Data Fig. 4 |. p5353,54 and wild-type p53 activate AT1 cell transcriptional and epigenetic programs.
(a) Expanded version of GSEA shown in Fig. 2a of alveolar epithelial cell signatures (Supplementary Table 6). Normalized enrichment score (NES) > 0 indicates the signature is enriched in KFT or KT cells relative to KPT cells. *Indicates gene sets significantly enriched (P ≤ 0.05). (b) GSEA shows enrichment of the indicated AT1 signatures in specific genotypes. (c) AT1 cells (HOPX+) as a ratio of all alveolar epithelial cells (NKX2–1+) (n = 600) at homeostasis in p5353,54/53,54 (n = 3), p53+/+ (n = 3), and p53−/− (n = 3) mice (no oncogenic Kras). (d) Proliferating (BrdU+) cells as a ratio of all alveolar epithelial cells (NKX2–1+) (n = 600) at homeostasis in p5353,54/53,54 (n = 3), p53+/+ (n = 3), and p53−/− (n = 3) mice (no oncogenic Kras). (e) GSEA shows enrichment of non-alveolar cell signatures (Supplementary Table 6) in KPT cells. NES < 0 indicates the signature is enriched in KPT cells. *Indicates gene sets significantly enriched (P ≤ 0.05). (f) (Top) Plot from Fig. 1j showing differentially accessible regions (P-adjusted ≤ 0.05) at AT1-associated gene promoters (± 1kb from the transcription start site, Angelidis_Mouse_AT1 signature, denoted by red/blue dots). (Bottom) Plot from Fig. 1k showing differentially accessible regions (P-adjusted ≤ 0.05) at AT1-associated gene promoters (Angelidis_Mouse_AT1 signature). (g) Counts per million (CPM) indicating AT1 gene expression in KT (n = 3) and KPT (n = 4) RNA-sequencing samples. All data are mean ± s.d. P values were calculated by GSEA (a, b, e), ordinary one-way ANOVA with Tukey’s multiple comparisons test (c, d) and using the DESeq2 R package (two-tailed Wald test adjusted for multiple testing using the procedure of Benjamini and Hochberg) (g).
Extended Data Fig. 5 |
Extended Data Fig. 5 |. Single-cell analyses show that p53 promotes AT1 cancer cell formation.
(a) Uniform Manifold Approximation and Projection (UMAP) plot of single-cell multiome (scRNA and scATAC) profiles of cancer cells (n = 6,929) collected from 10-week KFT (n = 2), KT (n = 2), and KPT (n = 2) mice. (b) Dot plot showing the RNA expression of alveolar epithelial cell signatures (Supplementary Table 6, AT1 and AT2 signatures are derived from the Mouse Cell Atlas) and markers in all cells across clusters. Sig = signature, Trans. sig. = transitional cell signature. (c) Dot plot showing the computed gene activity from ATAC data of alveolar epithelial cell signatures (Supplementary Table 6, AT1 and AT2 signatures are derived from the Mouse Cell Atlas) and markers in all cells across clusters. (d) Heatmap showing expression of AT2 and AT1 markers (log-transformed transcripts per million rescaled across all cells) in all cells. (e) Feature plots show the RNA expression/computed gene activity of (top) AT2 cell signatures and markers and (bottom) AT1 cell signatures and markers in all cells (Supplementary Table 6, AT1 and AT2 signatures are derived from Mouse Cell Atlas). (f) Feature plot shows the RNA expression of GO lung differentiation term genes (Supplementary Table 6) in all cells. (g) ATAC-sequencing tracks showing chromatin accessibility at Sftpc (AT2 gene), Ager (AT1 gene), and Cldn4 (transitional cell gene) in all cells split by clusters. (g) UMAP plot from (a) split by KFT (n = 1,200), KT (n = 4,318), and KPT (n = 1,411) cells. (i) Relative proportions of all clusters split by genotype. ( j) Relative proportions of AT1-like cancer cells in each genotype. KFT was set to 1.0.
Extended Data Fig. 6 |
Extended Data Fig. 6 |. p53 promotes an AT1 differentiation program in LUAD.
(a) Representative IF of tdTomato (tdT) and AGERhigh/medium/low, HOPXhigh/medium/low, and SPChigh/low tumors. Scale bar, 20 μm. (b) Uncropped images from Fig. 2b of AGER and tdTomato in 10-week KFT (n = 4), KT (n = 3), and KPT (n = 3) mice. Scale bar, 200 μm. (c) Expanded view of images from Fig. 2b of AGER and tdTomato in 10-week KFT (n = 4), KT (n = 3), and KPT (n = 3) mice. Scale bars, 20 μm. (d) Percentage tdTomato+ cancer cells positive for AGER in individual (n = 100 [KFT ], 100 [KT], and 200 [KPT ]) tumors in KFT (n = 4), KT (n = 3), and KPT (n = 3) mice. Red lines; break points for high, medium, and low staining. (e) Expanded view of images from Fig. 2b of HOPX and tdTomato in 10-week KFT (n = 4), KT (n = 3), and KPT (n = 3) mice. Scale bars, 20 μm. (f) Representative IF of PDPN and tdTomato in 10-week KFT (n = 4), KT (n = 3), and KPT (n = 3) mice. Scale bars, 20 μm. (g) Representative IF of SPC and tdTomato in 10-week KFT (n = 4), KT (n = 3), and KPT (n = 3) mice. Scale bar, 20 μm. (h) PDPN quantification in (n = 100 [KFT ], 100 [KT], and 200 [KPT ]) tumors in KFT (n = 4), KT (n = 3), and KPT (n = 3) mice (see Methods). The graph shows the percentage of tumors that are classified as AT1 marker high, medium, and low. Low = 0–5%, medium = 5–20%, high = 20–100%. (i) SPC quantification in (n = 100 [KFT ], 100 [KT], and 200 [KPT ]) tumors in 10-week KFT (n = 4), KT (n = 3), and KPT (n = 3) mice (see Methods). The graph shows the percentage of tumors that are classified as AT2 marker high and low. Low = 0–70%, high = 70–100%. ( j) Percentage tdTomato+ cancer cells positive for SPC in individual (n = 100 [KFT ], 100 [KT], and 200 [KPT ]) tumors in KFT (n = 4), KT (n = 3), and KPT (n = 3) mice. Red lines; break points for high and low staining. (k) Representative IF of AGER, SPC, and tdTomato in 10-week KFT (n = 3), KT (n = 3), and KPT (n = 3) mice. Arrowheads indicate AGER+ cells in KPT mice that co-stain with SPC. Scale bar, 10 μm. (l) Quantification of SPC-positivity of AGER+ cancer cells (n = 150) in 10-week KFT (n = 3), KT (n = 3), and KPT (n = 3) mice. The percentage of AGER+tdTomato+ cells that co-stained with SPC were quantified. All data are mean ± s.d. P values were calculated by ordinary one-way ANOVA with Tukey’s multiple comparisons test (d, j).
Extended Data Fig. 7 |
Extended Data Fig. 7 |. p53 directly promotes AT1 identity in vitro and in vivo.
(a) PDPN quantification as a percentage of p53+ (n = 600) cells from p5353,54 (n = 3) and p53wt (n = 3) LUAD cell lines or as a percent of DAPI+ (n = 600) cells in p53null (n = 3) LUAD cell lines. (b) Representative IF of PDPN and p53 from p5353,54 (n = 3), p53wt (n = 3), and p53null (n = 3) LUAD lines. Scale bar, 20 μm. (c) GSEA shows enrichment of AT1 cell signatures (Supplementary Table 6) in p53wt LUAD cells. NES > 0 indicates the signature is enriched in p53wt cells. *Indicates gene set is significantly enriched (P ≤ 0.05). (d) GSEA shows enrichment of alveolar signatures in specific genotypes. (e) Schematic for in vivo p53 restoration experiments. (f) Representative IF of PDPN and p53 from p5353,54-restored (n = 3) and p53wt-restored (n = 3) mice. Scale bar, 20 μm. (g) PDPN quantification as a percentage of p53+CYTOKERATIN (CK)+ tumors (n = 150) from p5353,54-restored (n = 3) and p53wt-restored (n = 3) mice or as a percent of CK+ tumors (n = 150) from p53null (n = 3) mice. (h) Representative IF of PDPN, p53, and CK in tumors from p5353,54-restored (n = 3), p53wt-restored (n = 3), and p53null (n = 3) mice. Scale bar, 20 μm. (i) GSEA shows p53 restoration induces AT1-associated gene expression profiles (Supplementary Table 6). Gene expression data comprised p53null (n = 8) and p53restored (n = 10) lung tumor samples. NES > 0 indicates signature enrichment in p53restored cells. *Indicates gene sets significantly enriched (P ≤ 0.05). ( j) Percentage of genes in each AT1 signature that fulfill the stated conditions. The P values indicate the enrichment of p53 bound genes in each signature. (k) ChIP-seq tracks show p53 binding at AT1-associated genes. All data are mean ± s.d. P values were calculated by ordinary one-way ANOVA with Tukey’s multiple comparisons test (a, g), by GSEA (c, d, i), and ChIP enrichment analysis ( j).
Extended Data Fig. 8 |
Extended Data Fig. 8 |. p53 promotes AT1-like identity in human LUAD.
(a) (Left) AT1 marker expression in human (left) TP53WT (n = 249) and TP53MUT (n = 280) LUADs (TCGA), (middle) TP53WT (n = 78) and TP53MUT (n = 38) LUADs (GSE13213), and (right) TP53WT (n = 34) and TP53MUT (n = 73) lung squamous cell carcinomas (LUSC, E-MTAB-8615). Center line, median; boxes, interquartile range (IQR); whiskers, 25% quantile – 1.5*IQR & 75% quantile + 1.5*IQR; points, outliers. (b) Representative IF of AGER, HT1–56, and SPC in (n = 3) normal human lung samples. Scale bar, 50 μm. (c) Representative IF of HT1–56 and CYTOKERATIN (CK, cancer cells) in TP53WT (n = 8) and TP53MUT (n = 5) human LUADs. Scale bar, 5 μm. (d) Percentage of CK+ (n = 1,300) cells positive for HT1–56 in TP53WT (n = 8) and TP53MUT (n = 5) human LUADs. (e) Representative IF of SPC and CK in TP53WT (n = 5) and TP53MUT (n = 5) human LUADs. Scale bar, 5 μm. (f) Percentage of CK+ (n = 1,000) cells positive for SPC in TP53WT (n = 5) and TP53MUT (n = 5) human LUADs. (g) Representative IF of AGER, HT1–56, and CK in TP53WT (n = 8) and TP53MUT (n = 5) human LUADs. Scale bar, 20 μm. (h) Representative IF of CLDN4 and CK in TP53WT (n = 5) and TP53MUT (n = 5) human LUADs. Scale bar, 5 μm. (i) Percentage CK+ (n = 1,000) cells positive for CLDN4+ in TP53WT (n = 5) and TP53MUT (n = 5) human LUADs. ( j) Representative IF of AGER and p53 in TP53knockout (KO) A549 cells transfected with an empty vector or a P53 expression vector (n = 3). Scale bar, 20 μm. (k) AGER quantification as a percentage of p53+ (n = 300) cells in (n = 3) A549 lines transfected with P53 or as a percentage of DAPI+ (n = 300) cells in (n = 3) A549 lines transfected with empty vector. All bar graphs are mean ± s.d. P values were calculated by two-way ANOVA test (a, see Methods) and two-tailed Student’s t-test (d, f, i, k).
Extended Data Fig. 9 |
Extended Data Fig. 9 |. p53 is activated in transitional and AT1-like cells.
(a) t-distributed stochastic neighbor embedding (tSNE) plot of (n = 3,891) cells across all clusters across all genotypes (KT [n = 1,071], KPT [n = 2,614], and normal AT2 [T, n = 206] cells) and all timepoints. (b) t-SNE plots of cancer cells split by both genotype and timepoint. (c) Proportion of cells in each cluster split by genotype and timepoint. (d) Heatmap showing expression of AT2, transitional (cluster 5), and AT1 cell markers (log-transformed TPMs rescaled across all cells) in all cells in (a). (e) (left) t-SNE plot of 2-week KT cells from the scRNA-sequencing dataset color-coded by cluster shows the predominance of clusters 1 and 2, which resemble AT2 cells. (Right) Feature plots showing the expression of AT2 markers (Sftpc and Sftpd), p53, and a panel of p53 target genes in 2-week KT cells. (f) Dot plot showing the expression of transitional (cluster 5) and AT1 cell markers in all cells in (a) split by genotype (T, KT, and KPT). (g) Relative proportions of cluster 3 and 5 cells in KT and KPT tumors. (h) Representative IF of CLDN4 and tdTomato in 10-week KFT (n = 4), KT (n = 3), and KPT (n = 3) mice. Scale bars, 50 μm (top) & 20 μm (bottom). (i) Quantification of CLDN4+ (n = 100 [KFT ], 100 [KT], and 200 [KPT ]) tumors (see Methods) in 10-week and 24-week KFT (n = 4), KT (n = 3), and KPT (n = 3) mice. Data are mean ± s.d. ( j) t-SNE plots split by genotype shown in Fig. 3a with the cluster 5 sub-clusters color-coded. (k) Relative composition of subclusters 5A, 5B, and 5C split by genotype and timepoint. (l) GSEA shows enrichment of an injury-induced transitional cell signature (Supplementary Table 6) in KPT mice. P values were calculated by GSEA (l).
Extended Data Fig. 10 |
Extended Data Fig. 10 |. p53 restricts transitional cancer cell formation and promotes their differentiation into AT1-like cells.
(a) Expanded view from Fig. 3g of p19ARF, CLDN4 and tdTomato in tumors from 10-week KFT (n = 4), KT (n = 3), and KPT (n = 3) mice. Scale bars, 20 μm. (b) Quantification of p19ARF staining in (n = 100 [KFT ], 100 [KT], and 200 [KPT ]) CLDN4+ cancer cells in 10-week KFT (n = 4), KT (n = 3), and KPT (n = 3) mice. (c) Expanded view from Fig. 3g of HNF4A and CLDN4 in tumors from 10-week KFT (n = 4), KT (n = 3), and KPT (n = 3) mice. Scale bars, 20 μm. (d) Quantification of HNF4A staining in (n = 100 [KFT ], 100 [KT], and 200 [KPT ]) CLDN4+ cancer cells in 10-week KFT (n = 4), KT (n = 3), and KPT (n = 3) mice. (e) Expanded view from Fig. 3g of phosphorylated-ERK (pERK) and CLDN4 in tumors from 10-week KFT (n = 4), KT (n = 3), and KPT (n = 3) mice. Scale bars, 20 μm. (f) Quantification of pERK staining in (n = 100 [KFT ], 100 [KT], and 200 [KPT ]) CLDN4+ cancer cells in 10-week KFT (n = 4), KT (n = 3), and KPT (n = 3) mice. (g) Representative IF of CLDN4, p19ARF, HNF4A, and pERK in tumors from 10-week KPT (n = 3) mice. Scale bar, 20 μm. (h) Copy number variations (CNVs) (red, amplifications; blue, deletions) inferred from the scRNA-sequencing data. (i) (Left) Frequency of CNVs across tumor progression or (right) across clusters. ( j) Partition based graph abstraction of indicated clusters. (k) Cell-cell transitions estimated by CellRank based on pseudotime. (l) Scatter plots displaying the expression trend of programs identified in Fig. 3d. (m) Expression of cluster 3 markers in cluster 5 cells. Center line is the median with the upper and lower quartiles shown. Bar graphs are mean ± s.d. P values were calculated by two-tailed Pearson correlation test (df = 851) (l) and two-tailed Mann Whitney U test (m).
Extended Data Fig. 11 |
Extended Data Fig. 11 |. p53 promotes AT1 differentiation after lung injury.
(a) (Left) Representative IF of AGER and p53 in p53LSL-wt/LSL-wt transitional (TIGIT+) LUAD cells 1 and 3 days after Ad-Empty (p53null) or Ad-Cre (p53wt) treatment. Scale bar, 20 μm. (Right) AGER quantification as a percent of DAPI+ (n = 200) p53null cells or p53+ (n = 200) p53wt cells 1 (top) and 3 (bottom) days post-adenoviral treatment. (b) Plot from Fig. 3h depicting an expression score of transitional cell markers. (c) Transitional cell marker induction across cancer clusters. (d) Enriched gene sets in cluster 5 markers identified by Enrichr. (e) (Left) tdTomato+ (n = 600) cells that are SPC+ in control SpcT (n = 3) and SpcPT (n = 3) mice. (Right) SPC+ (n = 600) cells that are tdTomato+ in the same cohort. (f) Representative IF of SPC and tdTomato in control SpcT (n = 3) and SpcPT (n = 3) mice. Scale bar, 20 μm. (g) Expanded view of Fig. 4c, d of AGER/tdTomato or CLDN4/tdTomato in 4-day BHT-treated SpcFT (n = 3), SpcT (n = 3), and SpcPT (n = 3) mice. Scale bar, 20 μm. (h) Representative IF of BrdU and SPC in 4-day BHT-treated SpcFT (n = 3), SpcT (n = 3), and SpcPT (n = 3) mice. Scale bar, 20 μm. (i) tdTomato+ (n = 600) cells that are (left) AGER+, (left-middle) CLDN4+, or (right-middle) SPC+ in 2-day BHT-treated SpcT (n = 3) and SpcPT (n = 3) mice. (Right) Proliferating (BrdU+) SPC+ (n = 600) cells in the same cohort. ( j) tdTomato+ (n = 600) cells that are SPC+ in 4-day BHT-treated SpcFT (n = 3), SpcT (n = 3), and SpcPT (n = 3) mice. (k) Representative IF of SPC and tdTomato in 4-day BHT-treated SpcFT (n = 3), SpcT (n = 3), and SpcPT (n = 3) mice. Scale bar, 20 μm. (l) ChIP-sequencing tracks of p53 binding at AT1 genes in transitional cells after injury. Data are mean ± s.d. P values were calculated by two-tailed Student’s t-test (e, i) and ordinary one-way ANOVA with Tukey’s multiple comparisons test ( j).
Extended Data Fig. 12 |
Extended Data Fig. 12 |. p53 promotes alveolar lineage fidelity during lung injury repair.
(a) Expression of the top 100 markers (by P-adjusted value) for each cluster. (Right) Representative genes. (b) Expression of indicated marker/signatures (Supplementary Table 6) across clusters. (c) UMAP from Fig. 4g colored by pseudotime. (d) UMAP from Fig. 4g colored by CytoTRACE score. (e) p53 pathway signature expression (Supplementary Table 6) across clusters. (f) (Left) UMAP from Fig. 4g split by genotype. (Middle) p53 expression across clusters. (Right) p53 pathway signature expression (Supplementary Table 6). (g) Overlap of p53 and p53 target gene expression from (f). (h) (Top-left) Expression of Dclk1 or (right, bottom) liver and LUAD cluster (cluster 5B/C, 10, 11, or 12) programs (Supplementary Table 6) in SpcT (n = 332) and SpcPT (n = 189) transitional cells from BHT injury scRNA-sequencing data. (i) Top enriched Hallmark gene sets in genes upregulated in SpcPT compared to SpcT transitional cells. ( j) CLDN4+tdTomato+ (n = 100) cells that are VIMENTIN-positive in 4-day BHT-treated SpcT (n = 3) and SpcPT (n = 3) mice. (k) Expanded view from Fig. 4k of CLDN4, VIMENTIN, and tdTomato in 4-day BHT-treated SpcT (n = 3) and SpcPT (n = 3) mice. Scale bar, 20 μm. (l) SpcPT transitional cell signature (Supplementary Table 6) expression in scRNA-sequencing data from KT (n = 1,071) and KPT (n = 2,614) LUAD cells. (m) Representative IF of CLDN4 and VIMENTIN in tumors from 10-week KT (n = 3) and KPT (n = 3) mice. Scale bar, 5 μm. (n) Expanded view of (m). Scale bar, 20 μm. (o) CLDN4-positive (n = 100) tumor cells that are VIMENTIN-positive in 10-week KT (n = 3) and KPT (n = 3) mice. Bar graphs are mean ± s.d. Box plots: center line, median; box limits, upper/lower quartiles; whiskers, 2.5–97.5 percentile; points, outliers. P values were calculated by two-tailed non-parametric Wilcoxon rank sum test (h, bar graph) and two-tailed Student’s t-test (h [box plots], j, l, o).
Fig. 1 |
Fig. 1 |. The p5353,54 super tumour suppressor promotes lung cell identity.
a, Allelic series of p53 mutants. p5353,54 is a hypermorphic transactivation domain 2 (TAD2) mutant allele. DBD, DNA-binding domain; fl, flox; TET, tetramerization domain; WT, wild type. b, Schematic of the lung cancer study. Histology cohort: KFT (n = 7), KT (n = 8) and KPT (n = 5) mice. RNA-seq cohort: KFT (n = 4), KT (n = 3) and KPT (n = 4) mice. ATAC-seq cohorts: (1) KT (n = 4) and KPT (n = 4) mice; and (2) KFT (n = 2) and KT (n = 2) mice. c, Lung tumour burden, number and size (n = 56, 311 and 617 tumours for KFT, KT and KPT cohorts, respectively). Data are the mean ± s.d. d, Principal component (PC) analysis of KFT, KT and KPT RNA-seq samples. e, Hyperactivated genes (n = 676) in KFT cells relative to KT cells (>1.2 fold change (FC);Methods). f, Top enriched terms in p5353,54-hyperactivated genes (Metascape). g, Gene set enrichment analysis (GSEA) of gene ontology (GO) terms comparing KT and KPT cells. ES, enrichment score; FDR, false discovery rate; NES, normalized ES. h, Representative immunohistochemistry of NKX2–1 staining in 10-week old KFT (n = 3), KT (n = 3) and KPT (n = 3) mice. Scale bar, 20 μm. i, Quantification of NKX2–1 staining from h in n = 1,500 cells from KFT (n = 3), KT (n = 3) and KPT (n = 3) mice. Red line indicates the median. j, Left, differential accessibility versus log2(mean reads per region) in KT and KPT cells. Right, top TF motifs enriched in differentially accessible regions (log2(FC) > 2). k, Left, Differential accessibility versus log2(mean reads per region) in KT and KFT cells. (Right) TF motifs enriched in differentially accessible regions. l, Top, Venn diagram defining p5353,54 hyperaccessible regions (Methods). Bottom, Top terms enriched in genes associated with p5353,54 hyperaccessible regions. P values were calculated using one-way analysis of variance (ANOVA) with the Kruskal–Wallis test with multiple comparisons (two-stage linear step-up procedure of Benjamini, Krieger and Yekutieli) (c), GSEA (g), or ordinary one-way ANOVA with multiple comparisons (Tukey’s multiple comparisons test) (i).
Fig. 2 |
Fig. 2 |. p53 promotes an AT1 cell differentiation programme in mouse and human LUAD.
a, GSEA shows enrichment of alveolar cell signatures (Supplementary Table 6). NES > 0 indicates that the signature is enriched in KFT or KT cells relative to KPT cells. Asterisk indicates that the gene set is significantly enriched (P ≤ 0.05). Mouse and human alveolar signatures were taken from previously published studies,,,53,54. b, Representative immunofluorescence (IF) images of AT1 cell markers and a cancer cell marker (tdTomato (tdT)) in 10-week-old KFT (n = 4), KT (n = 3) and KPT (n = 3) mice. c, AT1 cell marker quantification in n = 100 (KFT), 100 (KT) and 200 (KPT) tumours in 10-week-old KFT (n = 4), KT (n = 3) and KPT (n = 3) mice. Tumours were binned on AT1 cell marker positivity of tdT+ cells (Methods). Low, 0–5%; medium, 5–20%; high, 20–100%. d, Schematic of mouse LUAD cell line experiments. e, AGER quantification as a percentage of p53+ (n = 600) cells from p5353,54 (n = 3) and p53WT (n = 3) LUAD cell lines or of DAPI+ (n = 600) cells in p53null (n = 3) LUAD cell lines. f, Representative IF images of AGER and p53 from p5353,54 (n = 3), p53WT (n = 3) and p53null (n = 3) LUAD cells. g, Top, ChIP–seq tracks of p53 at AT1-associated genes. Bottom, ChIP–qPCR of p53 at AT1 cell genes in p53WT (n = 2) and p53null (n = 2) LUAD cell lines. h, AT1 cell signature expression in TP53WT (n = 249) and mutant TP53 (TP53MUT; n = 280) human LUADs (The Cancer Genome Atlas (TCGA)-LUAD cohort). Centre line, median; boxes, interquartile range (IQR); whiskers, 25% quantile – 1.5× IQR and 75% quantile + 1.5× IQR. Mouse and human alveolar signatures were taken from previously published studies,,,. i, Percentage of cytokeratin+ cancer cells that are AGER+ (n = 1,300) in TP53WT (n = 8) and TP53MUT (n = 5) human LUAD samples. j, Representative IF images of AGER and cytokeratin (CK) in TP53WT (n = 8) and TP53MUT (n = 5) human LUAD samples. Scale bar, 5 μm. Bar graphs are mean ± s.d. P values were calculated using GSEA (a), ordinary one-way ANOVA with Tukey’s multiple comparisons test (e), two-way ANOVA test (h; Methods) or two-tailed Student’s t-test (i). Scale bars, 5 μm ( j) or 20 μm (b,f).
Fig. 3 |
Fig. 3 |. p53 activation in a transitional cell state drives AT1 cell differentiation.
a, t-distributed stochastic neighbour embedding (tSNE) plots of scRNA-seq data. KT (n = 1,071) and KPT (n = 2,614) cells from all time points (2, 12, 20 and 30 weeks) are shown with previously defined clusters. b, Expression of Trp53 and p53 target genes in all KT cells. c, Proportions of early (<30 week) and late (30 week) KT and KPT cells in subclusters 5A, 5B and 5C. d, Hierarchical clustering of all cluster 5 cells identifies 3 subclusters. Top, genotype and time point composition of each cluster. Left, expression programme term chosen through functional annotation of programme genes. Right, top significant genes in each programme. e, For each programme identified in d, an aggregate score measuring the expression of all genes in the programme was calculated for each cluster 5 cell. Violin plots show the score for each cell along the previously described LUAD time course. DEG, differentially expressed gene. f, Violin plots of Cdkn2a and Hnf4a expression in cells from clusters 5A, 5B and 5C from KT and KPT mice. g, Representative IF images of CLDN4 and markers of clusters 5B/5C (p19(ARF), HNF4A and pERK) in tumours from 10-week-old KFT (n = 4), KT (n = 3) and KPT (n = 3) mice. Scale bar, 20 μm. h, PC analysis plot of the cancer cell subpopulations (clusters 3, 5 and 11) from KT and KPT mice across all time points. i, PC analysis plot from h coloured by CytoTRACE score. The CytoTRACE score shows the putative differentiation potential of cells. Least differentiated indicates that cells have the highest plasticity. j, Cell–cell transitions estimated using CellRank, based on CytoTRACE scores, reveals distinct trajectories from clusters 5A to 3 and from clusters 5B to 5C to 11. For the violin plots, the thicker dashed line indicates the median, the thinner dashed lines indicate the upper and lower quartiles.
Fig. 4 |
Fig. 4 |. p53 participates at multiple steps in alveolar regeneration after injury.
a, Schematic of the lung injury mouse models. Control cohort: SpcT (n = 3) and SpcPT (n = 3) mice. Treatment with BHT for both the 2 day and 4 day cohorts: SpcFT (n = 3), SpcT (n = 3) and SpcPT (n = 3) mice. scRNA-seq cohort: SpcT (n = 2) and SpcPT (n = 2) mice. b, SPC+ (n = 600) AT2 cells that are BrdU+ in SpcFT (n = 3), SpcT (n = 3) and SpcPT (n = 3) mice treated with BHT for 4 days. c, Left, representative IF images of CLDN4 and tdT staining of samples from SpcFT (n = 3), SpcT (n = 3) and SpcPT (n = 3) mice treated with BHT for 4 days. Right, tdT+ (n = 600) cells that are CLDN4+ in the same cohorts. d, Left, representative IF images of AGER and tdT in 4-day BHT-treated SpcFT (n = 3), SpcT (n = 3) and SpcPT (n = 3) mice. Right, tdT+ (n = 600) cells that are AGER+ in the same cohorts. Arrowheads indicate examples of AGER+tdT+ cells. e, Representative haematoxylin and eosin images of 4-day BHT-treated SpcT (n = 3) and SpcPT (n = 5) mice. Scale bar, 20 μm. f, Injury scoring of 4-day BHT-treated SpcT (n = 3) and SpcPT (n = 5) mice (Methods). g, Uniform manifold approximation and projection (UMAP) plot of tdT+ alveolar epithelial (n = 2,445) cells from scRNA-seq. h, p53 target gene expression across SpcT cells. i, Cluster frequency by genotype. j, Gene and cellular programme expression (Supplementary Table 6) in transitional SpcT (n = 332) and SpcPT (n = 189) cells. k, Representative IF images of CLDN4, VIM and tdT in 4-day BHT-treated SpcT (n = 3) and SpcPT (n = 3) mice. l, Model of p53 action. Bar graphs are mean ± s.d. For the box plots, centre line is the median; box limits, the upper and lower quartiles; whiskers, 2.5–97.5 percentile; points, outliers. P values were calculated using ordinary one-way ANOVA with Tukey’s multiple comparisons test (bd), two-tailed Student’s t-test (f,j (bottom)) or two-tailed, non-parametric Wilcoxon rank sum test ( j, top). Scale bars, Scale bar, 5 μm (k) or 20 μm (c,d).

Similar articles

Cited by

References

    1. The Cancer Genome Atlas Research Network Comprehensive molecular profiling of lung adenocarcinoma. Nature 511, 543–550 (2014). - PMC - PubMed
    1. Tammemagi MC, McLaughlin JR & Bull SB Meta-analyses of p53 tumor suppressor gene alterations and clinicopathological features in resected lung cancers. Cancer Epidemiol. Biomarkers Prev 8, 625–634 (1999). - PubMed
    1. Jiao XD, Qin BD, You P, Cai J & Zang YS The prognostic value of TP53 and its correlation with EGFR mutation in advanced non-small cell lung cancer, an analysis based on cBioPortal data base. Lung Cancer 123, 70–75 (2018). - PubMed
    1. Steels E et al. Role of p53 as a prognostic factor for survival in lung cancer: a systematic review of the literature with a meta-analysis. Eur. Respir. J 18, 705–719 (2001). - PubMed
    1. Vaughan AE & Chapman HA Regenerative activity of the lung after epithelial injury. Biochim. Biophys. Acta 1832, 922–930 (2013). - PubMed

MeSH terms