. 2023 Aug;620(7973):366-373.
doi: 10.1038/s41586-023-06357-1. Epub 2023 Jul 19.

A cell-type-specific error-correction signal in the posterior parietal cortex

Affiliations

A cell-type-specific error-correction signal in the posterior parietal cortex

Jonathan Green et al. Nature. 2023 Aug.

Abstract

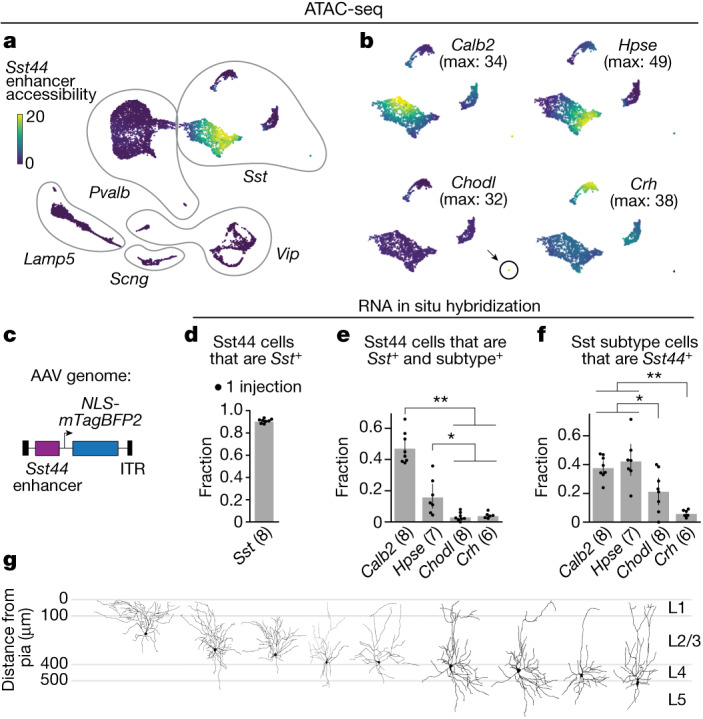
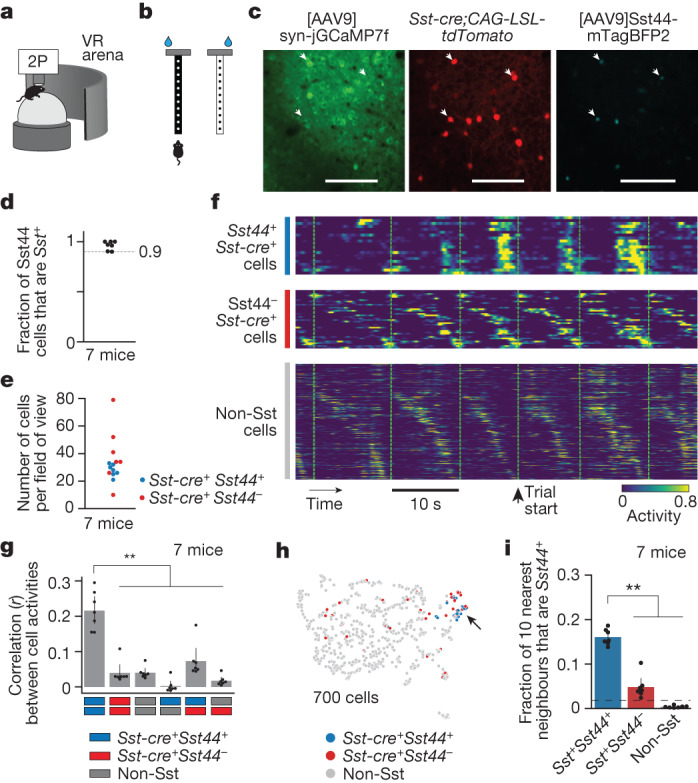
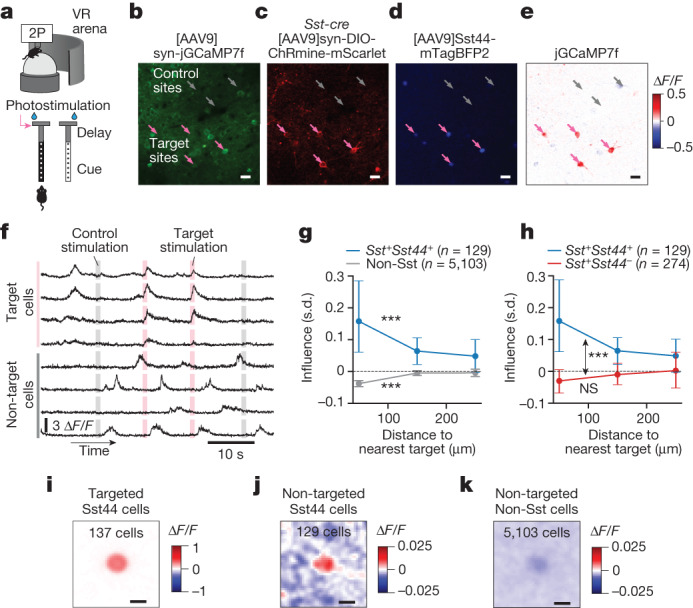
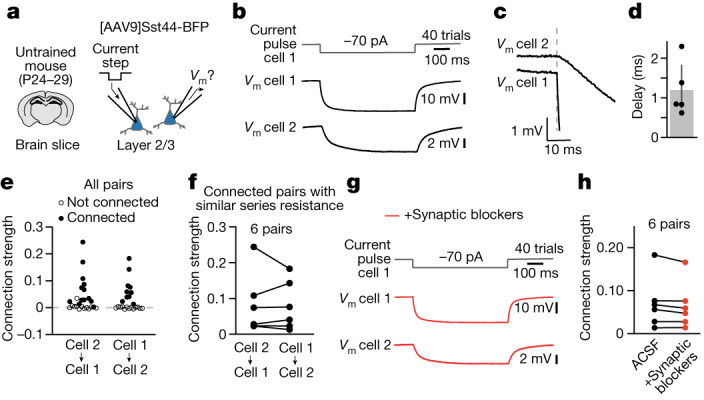
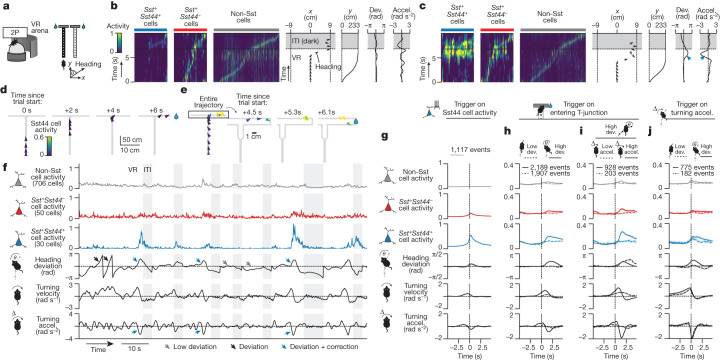
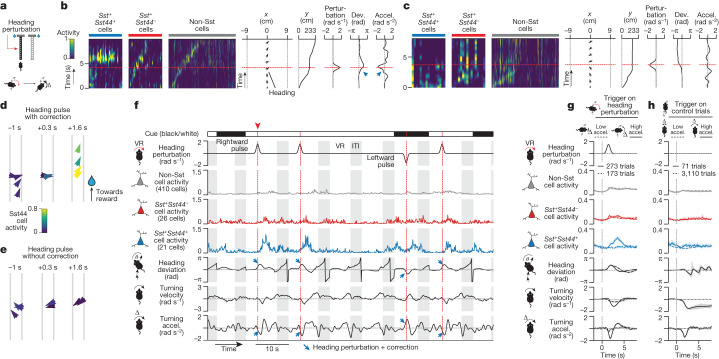
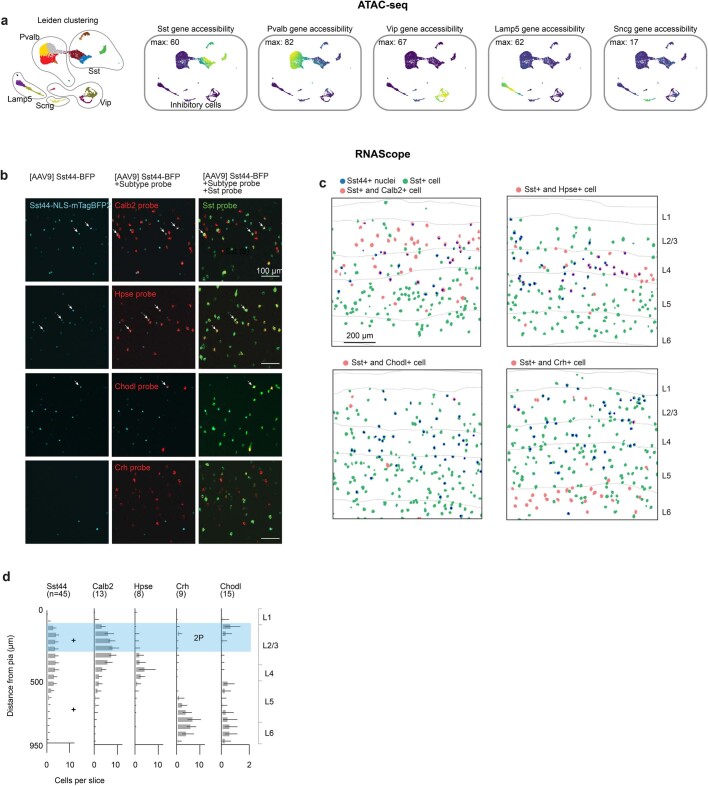
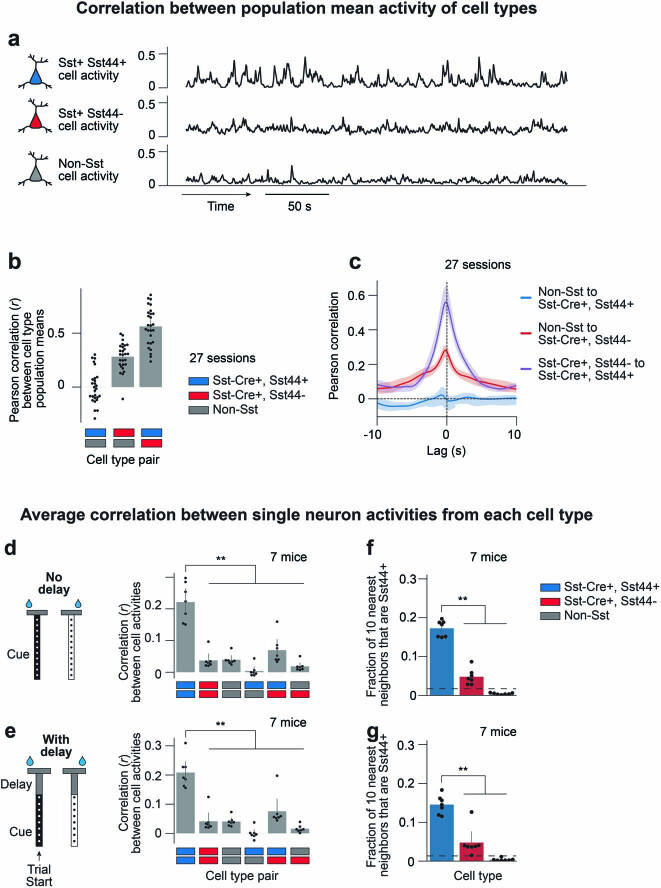
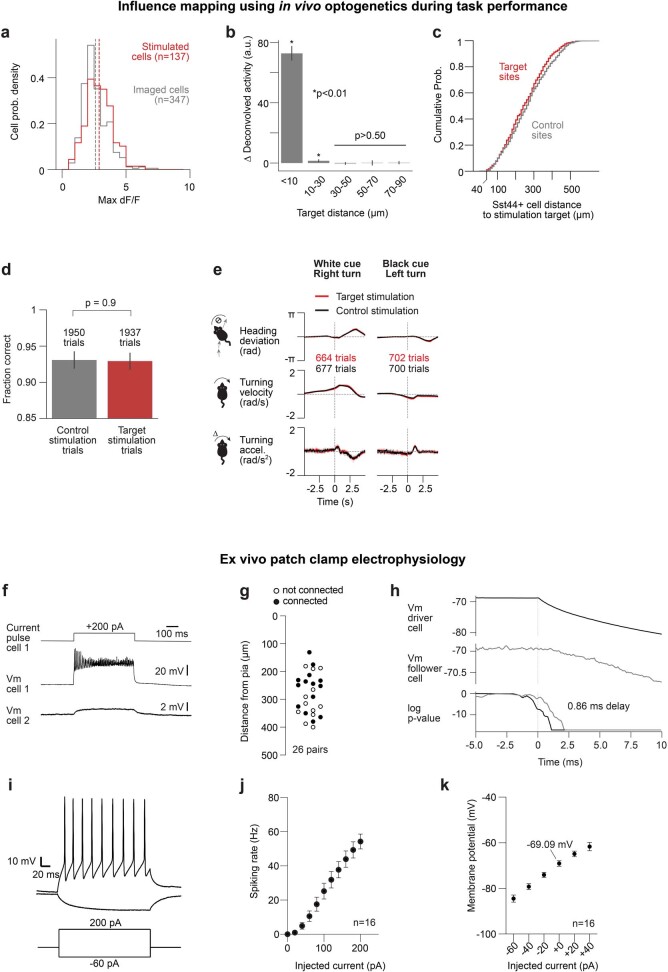
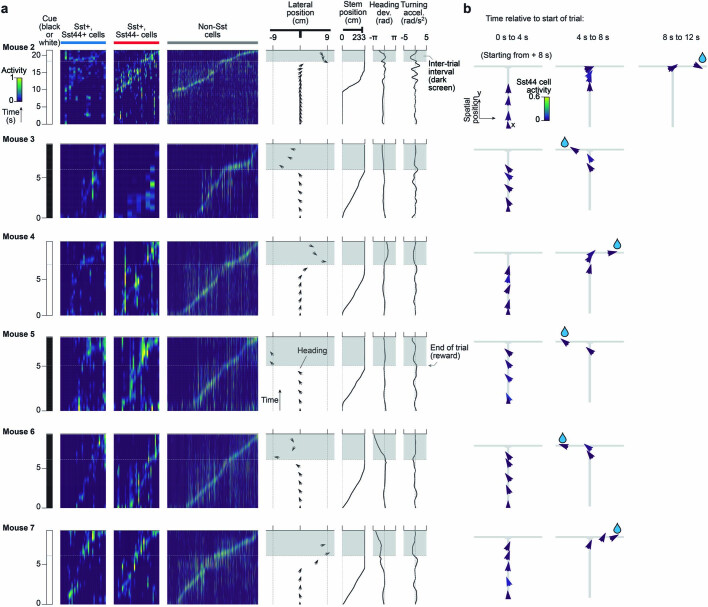
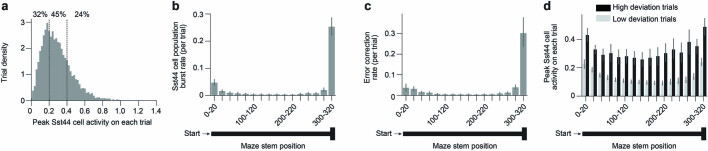
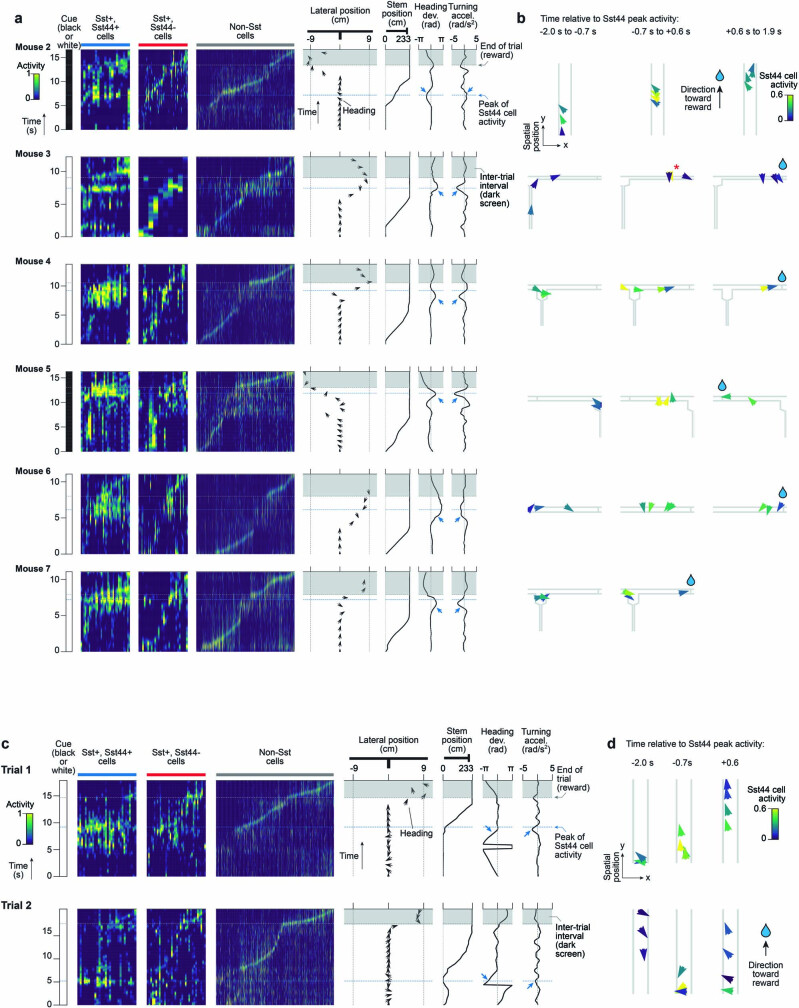
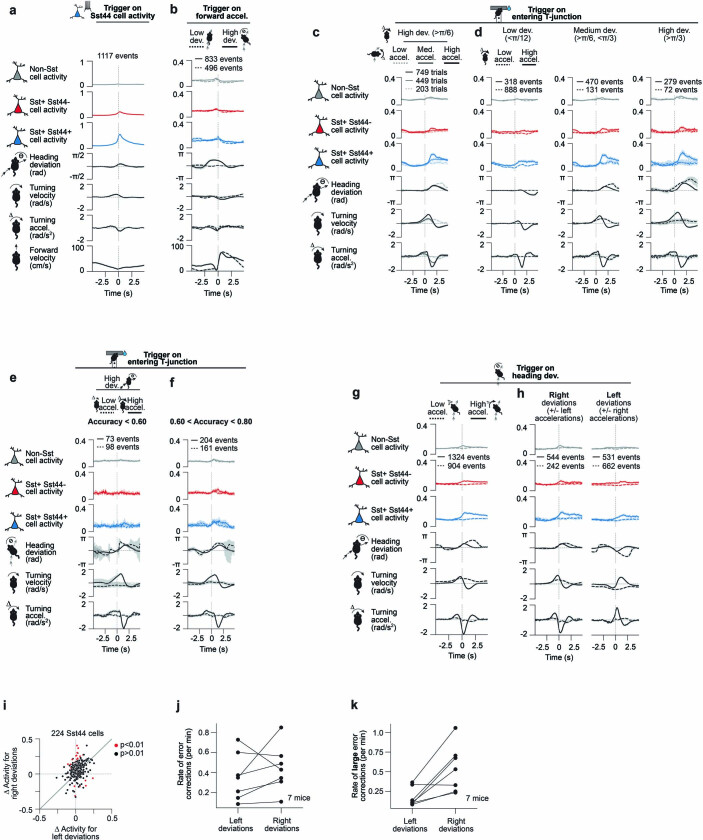
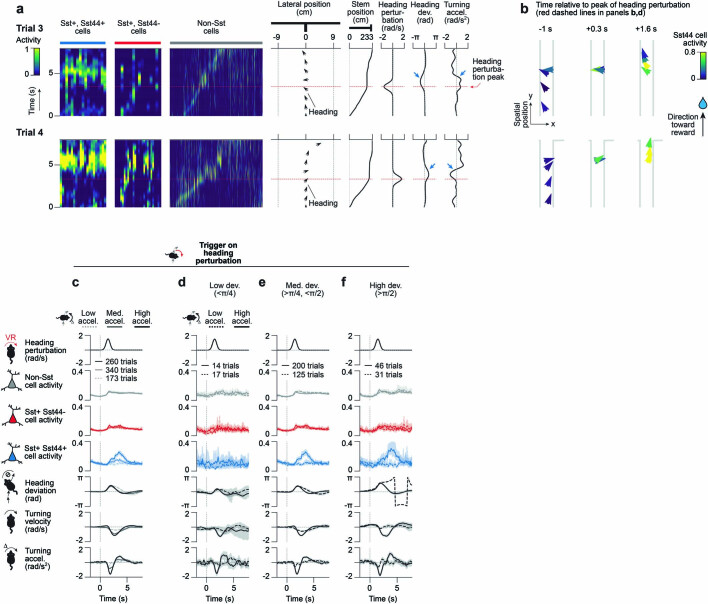
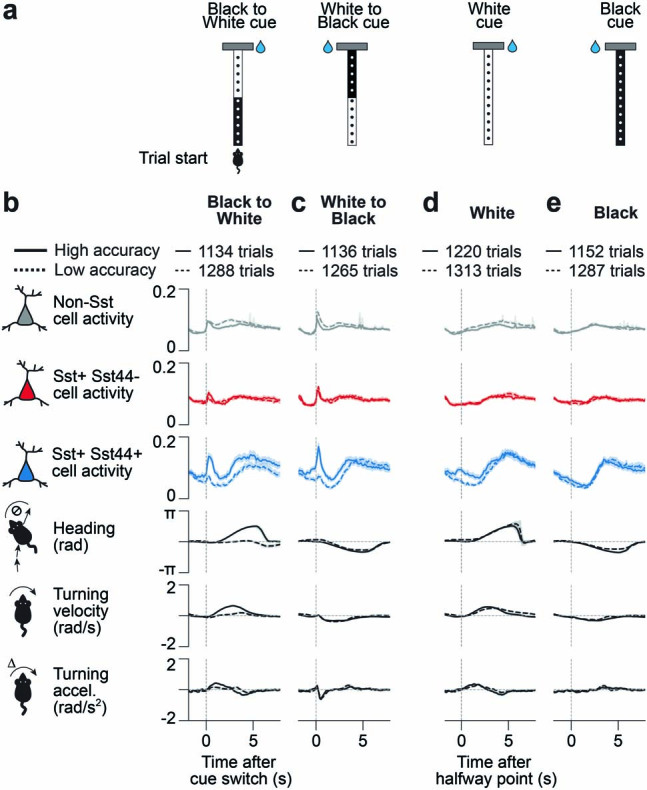
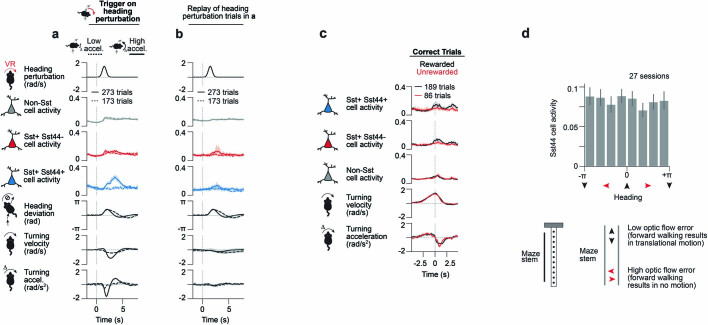
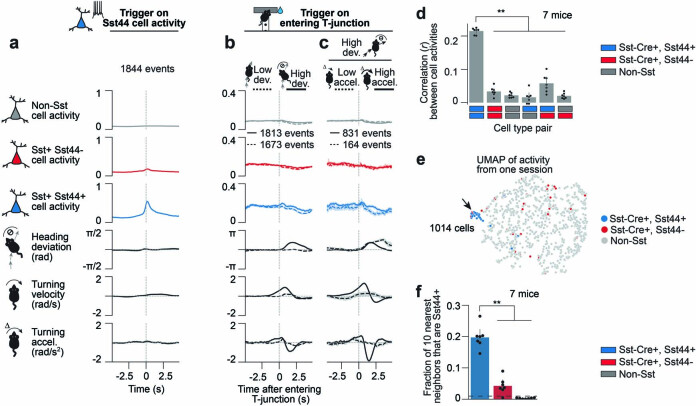
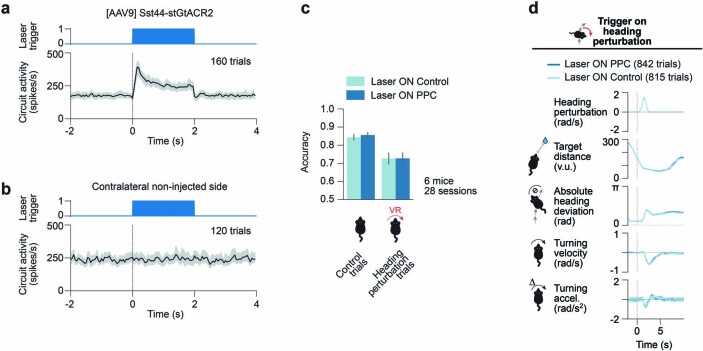
Neurons in the posterior parietal cortex contribute to the execution of goal-directed navigation1 and other decision-making tasks2-4. Although molecular studies have catalogued more than 50 cortical cell types5, it remains unclear what distinct functions they have in this area. Here we identified a molecularly defined subset of somatostatin (Sst) inhibitory neurons that, in the mouse posterior parietal cortex, carry a cell-type-specific error-correction signal for navigation. We obtained repeatable experimental access to these cells using an adeno-associated virus in which gene expression is driven by an enhancer that functions specifically in a subset of Sst cells6. We found that during goal-directed navigation in a virtual environment, this subset of Sst neurons activates in a synchronous pattern that is distinct from the activity of surrounding neurons, including other Sst neurons. Using in vivo two-photon photostimulation and ex vivo paired patch-clamp recordings, we show that nearby cells of this Sst subtype excite each other through gap junctions, revealing a self-excitation circuit motif that contributes to the synchronous activity of this cell type. These cells selectively activate as mice execute course corrections for deviations in their virtual heading during navigation towards a reward location, for both self-induced and experimentally induced deviations. We propose that this subtype of Sst neurons provides a self-reinforcing and cell-type-specific error-correction signal in the posterior parietal cortex that may help with the execution and learning of accurate goal-directed navigation trajectories.


Conflict of interest statement

S.H. is a member of the scientific advisory board and M.E.G. is a consultant for Apertura Gene Therapy. The other authors declare no competing interests.

Figures

Fig. 1
Fig. 1. The Sst44 enhancer drives expression in Calb2+ and Hpse+ Sst neurons.
a, UMAP projection of 10,375 inhibitory cortical neurons showing Sst44 enhancer accessibility. b, Accessibility of Sst subtype marker genes across Sst neurons. Max, maximum. c, AAV genome with the Sst44 enhancer driving NLS-mTagBFP2. ITR, inverted terminal repeat. df, The specificity of viral Sst44 expression was assessed using in situ RNA hybridization. d, The specificity of the Sst44 enhancer for Sst cells. e, The fraction of Sst44 cells that are positive for each subtype. f, The fraction of each Sst subtype that is Sst44-positive. Statistical analysis was performed using Wilcoxon rank-sum tests; **P < 0.01, *P < 0.05. g, The morphology of single Sst44 neurons filled through a whole-cell patch. Data are mean ± bootstrapped 95% confidence intervals.
Fig. 2
Fig. 2. Sst44 cells activate synchronously in a cell-type-specific pattern.
a, Imaging activity during virtual navigation. 2P, two-photon scanning microscope; VR, virtual reality. b, T-maze virtual environments. c, Example cropped field of view. Scale bars, 100 μm. d, The specificity of the Sst44 enhancer. e, The number of Sst cells per field of view across three planes. f, Sample activity trace showing synchronous activity in Sst44 neurons. Each row is the activity of one cell. g, Pearson correlation between cells of each cell type. h, UMAP projection of each cell’s activity from one session, showing clustering of Sst44 neurons. i, The fraction of the ten nearest neighbours in activity space that are Sst44-positive. The dashed line shows the mean after shuffling cell type identities. Activity was smoothed with a 0.25 s Gaussian filter. Statistical analysis was performed using Kolmogorov–Smirnov tests. Data are mean ± bootstrapped 95% confidence intervals.
Fig. 3
Fig. 3. Sst44 cells on average excite each other and inhibit other neurons during navigation.
a, Photostimulation of Sst44 cells during navigation, triggered on entering the T-junction. bd, Example cropped sample field of view. b, jGCaMP7f in neurons. c, ChRmine–mScarlet in Sst cells. d, Nuclear-localized mTagBFP2 in Sst44 cells. e, Photostimulation-induced activity relative to the control trials. f, Sample trace of activity during photostimulation. g, Influence (in units of s.d., Methods) versus distance from the nearest target for Sst44+ and non-Sst cells. Statistical analysis was performed using Wilcoxon signed-rank tests versus zero; ***P < 1 × 10−4. h, Influence versus distance from the nearest target as in g, but for Sst44+ and Sst44Sst+ cells. The blue curve (Sst44+) is the same in g and h for comparison. Statistical analysis was performed using a Wilcoxon rank-sum test to compare Sst44+ and Sst44-Sst+ cells (double-sided arrow), and a Wilcoxon signed-rank test to compare Sst44-Sst+ cells versus zero (not significant (NS)). Cells 40–200  µm from nearest target were selected for statistical tests. i, Average target trial minus control trial dF/F image cropped and centred on each photostimulated cell. j,k, Same as i, but for each influenced Sst44 cell (j) and each non-Sst cell (k). Data are mean ± bootstrapped 95% confidence intervals. n = 4 mice, 20 sessions. Scale bars, 20 μm (be) and 10 μm (ik).
Fig. 4
Fig. 4. Sst44 cells are coupled through gap junctions.
a, Patch-clamp electrophysiology analysis of pairs of Sst44 cells in brain slices. b, The mean membrane voltage (Vm) from an example connected pair. c, Expanded view of b to display the delay. The Vm for cells 1 and 2 are offset for visualization. d, The delay in the Vm of the follower cell for strong connections (Methods). Mean: 1.2 ms, 5 connections. e, Connection strength (∆Vm in the follower cell/∆Vm in the driver cell) from all pairs. A total of 14 out of 26 pairs (54%) were connected. Statistical analysis was performed using Wilcoxon signed-rank tests with Benjamini–Hochberg correction; P < 0.01. f, The connection strength for connected pairs with similar series resistance (<30% difference), showing that the connection strength is reciprocal. g, The mean Vm for the pair in b after adding inhibitors for NMDA (D-AP5), AMPA (NBQX) and GABAA (gabazine) receptors. h, The connection strength before and after adding synaptic blockers.
Fig. 5
Fig. 5. Sst44 cells in the PPC activate during navigational course corrections.
a, Imaging activity during virtual T-maze navigation. b, Sst44 cell activity during a smooth trajectory towards the reward. Accel., turning acceleration; dev., heading deviation. c, Sst44 activity as in b, but during a trial with a course correction, highlighting high Sst44 cell activity. d,e, Trajectories of the trials in b and c, respectively. f, Sample trace of the mean cell type activities. g, Behaviour triggering on bursts of Sst44 cell activity. h, Activity triggered on entering the T-junction, split by large and small heading deviations. Left and right deviations were pooled after inverting behaviour for left deviations. i, Activity triggered on entering the T-junction as described in h, but splitting high-deviation trials by strong and weak corrections. j, Activity triggered on turning accelerations, with high turning velocity (to match the turning profile across conditions), split by large and small deviations. Left and right turning accelerations were pooled after inverting behaviour for right accelerations. For hj, statistical analysis was performed using Wilcoxon rank-sum tests across trials for Sst44 cell activity (solid versus dashed line, P < 1 × 10−10), and Wilcoxon signed-rank tests across trials for Sst44 cell activity versus the other cell types (P < 1 × 10−10). Activity averaged over 0.5 to 2.5 s relative to −1 to 0 s was used for statistical analyses. Data are mean ± bootstrapped 95% confidence intervals. n = 7 mice, 27 sessions.
Fig. 6
Fig. 6. Sst44 cells in the PPC activate during corrections for experimentally induced trajectory deviations.
a, Perturbation of virtual heading. b, Sst44 cell activity as the mouse corrects for a heading perturbation. c, Sst44 cell activity as in b, during a trial in which the mouse does not immediately correct. d,e, The trajectories of trials in b and c, respectively. f, Sample trace of mean activity in each cell type. g, Activity and behaviour during heading perturbations, split by strong and weak corrections. Left and right heading perturbations were pooled after inverting behaviour for leftward perturbations. h, Activity and behaviour as in g, at the same maze position on control trials. Statistical analysis was performed using Wilcoxon rank-sum tests comparing across trials the Sst44 cell activity (solid versus dashed line, P = 3 × 10−12 (g), P = 0.9 (h)); and Wilcoxon signed-rank tests comparing across trials the Sst44 cell activity versus other cell types (P < 1 × 10−8 (g), P > 0.1 (h)). Activity averaged over 2.5 to 4.5 s relative to 0 to 1 s was used for statistical tests. Turning velocities and accelerations refer to ball movements, not virtual movements (the latter also include the heading perturbation). Data are mean ± bootstrapped 95% confidence intervals. n = 8 mice, 16 sessions.
Extended Data Fig. 1
Extended Data Fig. 1. Molecular characterization of Sst44 cells.
a, UMAP projection of the genomic accessibility of 10,375 inhibitory cortical neurons from posterior cortex, showing Leiden clustering as different colours and the accessibility of gene markers for the 5 major inhibitory cell classes. Data pooled from two mice. b, Example images of native Sst44 enhancer-driven mTagBFP2 fluorescence and RNAScope for Sst and Sst subtype marker genes. c, Spatial distribution of Sst44 enhancer-labelled cells and Sst subtypes based on in situ RNA labelling. d, Depth distribution of Sst44 cells and Sst subtypes across slices. + denotes injection depths. Blue region highlights 2P imaging depth in subsequent figures.
Extended Data Fig. 2
Extended Data Fig. 2. Sst44 cells are correlated with each other, but not with overall circuit activity.
ac, Sst44 cell activity is weakly correlated with overall circuit activity. a, Sample trace of mean population activity of Sst44+, Sst44-/Sst+ and non-Sst cells in PPC. bc, Pearson correlation between population means of each cell type across sessions (b), and at different time lags (c). dg, Similar correlation and clustering statistics between mazes that contain or do not contain a delay between the visual cue and T-intersection. de, Pearson correlation between cells of each cell type. fg, Fraction of 10 nearest neighbours in activity space that are Sst44+. ** p < 0.01, Kolmogorov-Smirnov test. Mean and bootstrapped 95% confidence intervals are shown. Activity was smoothed with a 0.25 s gaussian filter for these analyses.
Extended Data Fig. 3
Extended Data Fig. 3. Characterization of in vivo influence mapping and slice electrophysiology experiments.
a, Distribution of peak dF/F of Sst44 cells during photostimulation sessions (n = 20) and during paired sessions from the same field of view without photostimulation (n = 20). Dashed lines indicate the mean of each distribution. 4 mice. b, Change in deconvolved cell activity as a function of the photostimulation target distance. p-values evaluated using the Wilcoxon signed rank test vs zero across trials. Number of trials: < 10 µm: 600, 10–30 µm: 600, 30–50 µm: 800, 50–70 µm: 350, 70–90 µm: 300. 12 isolated cells, 6 mice. Mean and bootstrapped 95% confidence intervals are shown. c, Distribution of target and control sites from influenced (non-stimulated, >40 µm from nearest target) Sst44+ cells. 141 target sites and 141 control sites total. The total number of target sites is slightly larger than the number of stimulated Sst44 cells (n = 137) because some photostimulated cells were not detected by the cell detection algorithm if they were not successfully stimulated. de, Stimulating 4–10 Sst44 cells in PPC does not change the mouse’s choice or turning behaviour. d, Fraction correct on control and target trials. p-value evaluated with Wilcoxon rank-sum test across trials. e, Turning behaviour triggered on photostimulation on target and control trials. Mean and bootstrapped 95% confidence intervals are shown. 4 mice, 20 sessions. fk, Characterization of Sst44 cell electrophysiology. f, Mean membrane voltage from an example connected pair of Sst44 cells shown with a positive current pulse. g, Distribution of distance of cell pairs from pia. h, Example trace showing how we computed the delay in the membrane voltage deflection between the driver and follower cell. For each cell, we computed the p-value (Wilcoxon rank-sum test, one-sided) at each time point by comparing a sliding 2 ms window to an equivalent window centred at 1.5 ms before the pulse onset and computed the average time delay (horizontal distance between the two log(p) curves) between natural log(p) values of −5 and −10. Natural log is plotted. See Methods for more details. ik, Characterization of intrinsic excitability. i, Example trace showing membrane voltage in response to a positive and negative current pulse. j, Spiking rate as a function of injected current. k, Membrane potential as a function of injected current. Mean and s.e.m. are shown in jk.
Extended Data Fig. 4
Extended Data Fig. 4. Smooth navigation behaviour during example trials with low Sst44 cell activity for each mouse.
a, Activity and behaviour over time during trials with low Sst44 cell activity. Same examples as in Supplementary Video 1 (mouse 1 shown in Fig. 5b). Each column in the activity heatmaps represents the activity of one cell over time. Cells sorted based on peak activity along the maze. Smoothed activity is plotted. Black arrows indicate the lateral position and heading of the mouse over time (pointing up is toward the end of the maze). b, Activity as a function of the mouse’s trajectory. X and y length scales are not proportional.
Extended Data Fig. 5
Extended Data Fig. 5. Sst44 cells activate on a subset of trials at any point along the maze, but with a strong enrichment at the T-intersection where most course corrections occur.
a, Distribution of peak Sst44 cell activity across trials. b, Sst44 cell population burst rate as a function of maze position. Sst44 cell population bursts defined as Sst44 cell population activity > 0.4 (contiguous time points that exceed this threshold are counted as one event). c, Course correction rate as a function of maze position. Course corrections defined as heading deviation > π/6 and turning accel. > 1 rad/s2 in the opposite direction, delayed by +0.3 s (to account for the average delay in the mouse’s reaction – see Methods). d, Peak Sst44 cell activity (after smoothing) for each spatial bin in each trial, splitting based on whether there was a high (> π/2) or low (< π/4) heading deviation, showing that Sst44 cell activity is strongly modulated by heading deviation at any point along the maze. Wilcoxon rank-sum test across sessions, high vs low deviation, p < 1e-6 for each spatial bin. Mean and bootstrapped 95% confidence intervals are shown. 7 mice, 27 sessions.
Extended Data Fig. 6
Extended Data Fig. 6. Course correction behaviour during example trials with high Sst44 cell activity for each mouse.
a, Activity (smoothed) and behaviour over time during trials with high Sst44 cell activity for each mouse. Same examples as in Supplementary Video 2 (mouse 1 shown in Fig. 5c). Each column in the activity heatmaps represents the activity of one cell over time. Cells sorted based on activity along the maze. Black arrows indicate the lateral position and heading of the mouse over time (pointing up is toward the end of the maze). b, Activity as a function of the mouse’s trajectory surrounding the peak in Sst44 cell activity (t = 0 is the Sst44 cell activity peak). X and y length scales are not proportional. * highlights arrow with high Sst44 cell activity. cd, Same as ab, for example peaks of Sst44 cell activity during course correction events where turning acceleration does not oppose heading deviation. Same examples as in Supplementary Video 3.
Extended Data Fig. 7
Extended Data Fig. 7. Characterization of activity during forward movements, errors and corrections of varying magnitudes, error corrections during training, and corrections in different directions.
ab, Slow down and speed up in forward velocity before and after Sst44 cell activity, but weak contribution of forward velocity to Sst44 cell activity. 7 mice, 27 sessions. a, Activity and behaviour, including forward velocity, averaged over large bursts of Sst44 cell activity (smoothed Sst44 cell activity > 0.4). b, Activity and behaviour during sharp increases in forward running (forward accel. > 70 cm/s2), split by high (> π/6) and low (< π/12) heading deviations. Left and right deviations were pooled after inverting behaviour for left deviations. cd, Sst44 cell activity as a function of turning acceleration and heading deviation magnitude. 7 mice, 27 sessions. c, Activity and behaviour as the mouse entered the T-junction with a large (>π/6) heading deviation, split based on whether the mouse corrected with a low (< 0.5 rad/s2), medium (>0.5, <1 rad/s2), or high (>1, <2 rad/s2) turning acceleration in the opposite direction. Left and right deviations were pooled after inverting behaviour for left deviations. Wilcoxon rank-sum test across trials, Sst44 cell activity high vs medium accel.: p = 6e-11, medium vs low accel.: p = 6e-5. d, Activity and behaviour as the mouse entered the T-junction with a small (<π/12), medium (>π/6, <π/3) or large (>π/3) heading deviation, split based on whether the mouse corrected with a high (>1, <2 rad/s2) or low (<0.5 rad/s2) turning acceleration in the opposite direction. High turning accelerations were capped at 2 rad/s2 to better compare across conditions. Left and right turning accelerations were pooled after inverting behaviour for right accelerations. Wilcoxon rank-sum test across trials, Sst44 cell activity solid line, low vs medium or high deviation: p < 1e-8, medium vs high deviation: p = 0.64. Activity averaged over 0.5 to 2.5 s relative to −1 to 0 s was used for statistical analyses for cd. ef, Sst44 cell activity during training. e, Activity during training for sessions with low accuracy (< 0.6). At this stage of training, a landmark indicates the location of the reward. Activity and behaviour as the mouse entered the T-junction with a large (>π/6) heading deviation, split based on whether the mouse corrected with a low (< 0.5 rad/s2), or high (>1 rad/s2) turning acceleration in the opposite direction. Left and right deviations were pooled after inverting behaviour for left deviations. 3 mice, 4 sessions. f, Same as e, for sessions with intermediate accuracy (> 0.6, < 0.8). 5 mice, 7 sessions. Wilcoxon rank-sum test across trials, Sst44 cell activity solid vs dashed line: p = 0.5 (e), p = 7e-3 (f), solid line f vs e: p = 0.02. Activity averaged over 0.5 to 2.5 s relative to −1 to 0 s was used for statistical analyses for ef. gk, Sst44 cell activity is present during leftward and rightward course corrections, even though course corrections occurred more often in response to right deviations. 7 mice, 27 sessions. g, Activity and behaviour during heading deviations (> π/6) at any point in the maze, split by whether the mouse corrected with a strong (> 1 rad/s2) or a weak (< 0.5 rad/s2) opposing turning acceleration delayed by +0.3 s (Methods). Left and right deviations were pooled after inverting behaviour for left deviations. h, Same as g, showing left and right deviations separately. In this analysis we additionally capped the heading deviation at π/3 and the turning acceleration at 2 rad/s2 to better compare activity between left and right deviations. i, Mean change in activity (0 to 3 s versus −2 to −1 s in h) in single Sst44 cells in response to corrections for left and right deviations. We selected errors and corrections within the same range as in h, to better compare activity between left and right corrections. We note that this analysis has more noise because (1) we are measuring from single cells, and (2) we restricted the analysis to one session (to sample independent cells), which will have a limited number of deviations to analyse. Cells that are significantly more active for either left or right deviations are highlighted in red (p < 0.01, Wilcoxon rank-sum test across turning events, corrected using Benjamini-Hochberg method). j, Rate of course corrections for left and right deviations. Course corrections defined as in g. k, Rate of large course corrections (heading deviation > π/3, turning accel. > 1 rad/s2 in the opposite direction), showing a strong bias toward large course corrections for right deviations, mirroring the slight bias in activity in h. Mean and bootstrapped 95% confidence intervals are shown.
Extended Data Fig. 8
Extended Data Fig. 8. Examples and quantitative characterization of Sst44 cell activity during heading perturbations.
ab, Additional examples of Sst44 cell activity during corrections for experimentally induced heading deviations. a, Activity (smoothed) and behaviour over time during heading perturbations. Same examples as in Supplementary Video 4. Each column in the activity heatmaps represents the activity of one cell over time. Cells sorted based on activity along the maze. Black arrows indicate the lateral position and heading of the mouse over time (pointing up is toward the end of the maze). Trial clipped to highlight heading perturbation event. b, Activity as a function of the mouse’s trajectory relative to the heading perturbation (t = 0). X and y length scales are not proportional. cf, Sst44 cell activity as a function of turning acceleration and heading deviation magnitude during heading perturbations. 8 mice, 16 sessions. c, Mean activity and behaviour during heading perturbations, split by whether the mouse corrected strongly (turning accel. > 1 rad/s2 in the opposite direction, +2 s after the heading perturbation was triggered – trigger indicated by the grey dashed line at 0 s), moderately (turning accel. > 0.5 rad/s2, < 1 rad/s2) or weakly (< 0.5 rad/s2). Left and right heading perturbations were pooled after inverting behaviour for leftward perturbations. Wilcoxon rank-sum test across trials, Sst44 cell activity strong vs moderate accel.: p = 4e-7, moderate vs weak accel.: p = 1e-3. df, Mean activity and behaviour during heading perturbations, splitting by low (d, <π/4), moderate (e, >π/4, <π/2) and high (f, >π/2) heading deviations, as well as strong (>1 rad/s2) and weak (<0.5 rad/s2) turning accelerations in the opposite direction. Wilcoxon rank-sum test across trials, Sst44 cell activity high vs moderate or low heading deviation: p < 0.01, moderate vs low: p = 0.06. Activity averaged over 2.5 to 4.5 s relative to 0 to 1 s was used for statistical tests. Turning velocities and accelerations refer to ball movements, not virtual movements that also include the heading perturbation. Mean and bootstrapped 95% confidence intervals are shown.
Extended Data Fig. 9
Extended Data Fig. 9. Sst44 cell activity increases after learning to adjust to a within-trial change in cue and reward location.
a, On 50% of trials, we changed the cue at the halfway point from black to white or white to black, along with the reward location, such that the mouse was rewarded based on the second cue. The change in cue was visible as the mouse approached it. be, Activity and behaviour as the mouse passed the halfway point during cue switch and control trials, split based on behavioural performance (low accuracy < 80% correct, high accuracy > 80% correct). Wilcoxon rank-sum test across trials, Sst44 cell activity solid vs dashed line, activity averaged over 0 to 1 s relative to −1 to 0 s: p < 1e-10 (bc), p = 2e-4 (d), p = 0.997 (e). Wilcoxon signed-rank test across trials, activity on high accuracy trials relative to mean activity on low accuracy trials, averaged over 0 to 1 s, Sst44 vs other cell types: p < 1e-10 (bd), Sst44 vs Sst: p = 2e-4 (e), Sst44 vs Non-Sst: p = 0.7 (e). Mean and bootstrapped 95% confidence intervals are shown. 7 mice, 45 sessions.
Extended Data Fig. 10
Extended Data Fig. 10. Sst44 cell activity during visual playback, reward omission and unexpected optic flow.
a–b, Visual playback of heading perturbations does not induce strong Sst44 cell activity in PPC. a, Fig. 6g reproduced for comparison. 8 mice, 16 sessions. b, Sst44 cell activity in response to visual playback of the same heading perturbation trials shown in a. 5 mice, 16 sessions. Mice in b were trained to run on a virtual linear track before being presented with the visual playback. Wilcoxon rank-sum test across trials, Sst44 cell activity solid line panel a vs b: p = 4e-13, solid vs dashed line panel b: p = 0.3. Activity averaged over 2.5 to 4.5 s relative to 0 to 1 s was used for statistical tests. Turning velocities and accelerations refer to ball movements, not virtual movements that also include the heading perturbation. c, Low contribution of reward expectation error to Sst44 cell activity. We omitted rewards on 20% of correct trials and added a reward on 20% of incorrect trials. Incorrect trials are not shown because there were too few trials after selecting for similar turning velocity. Activity and turning behaviour split by whether the mouse was rewarded or not. We selected trials where turning velocity was similar to the unrewarded trial mean (cosine similarity > 0.8, using the same window as in the plot) in order to minimize contributions from behavioural differences. Heading deviation is not shown because the screen is dark when the trial ends and the reward is delivered. 4 mice, 6 sessions. d, Sst44 cell activity is inconsistent with a response to an error in expected visual flow. Sst44 cell activity as a function of heading within the maze stem. Within the stem, the walls are always oriented north-south, meaning that running north or south is equivalent to running parallel to the wall, and running east or west is equivalent to running directly into the wall. When running into the wall, visual flow is expected but not received, which should generate an error in the expected visual flow. Samples in each bin were matched for pitch ball velocity to control for expected visual flow. 7 mice, 27 sessions. Mean and bootstrapped 95% confidence intervals are shown.
Extended Data Fig. 11
Extended Data Fig. 11. Sst44 cells in retrosplenial cortex do not activate during corrections for heading deviations.
a, Activity in RSC and behaviour averaged over large bursts of Sst44 cell activity (smoothed Sst44 cell activity > 0.4). b, Activity and behaviour as the mouse entered the T-junction, split based on whether this was followed by a large (> π/6) or a small (< π/12) heading deviation. Left and right deviations were pooled after inverting behaviour for left deviations. Selection criteria were evaluated at +1.5 s after entering the T-junction. c, Same as b, splitting trials with a high deviation based on whether the mouse corrected strongly (turning acceleration > 1 rad/s2 in the opposite direction) or weakly (< 0.50 rad/s2). d, Pearson correlation between cells of each cell type. Kolmogorov-Smirnov test, Sst44+/Sst44+ pair vs other cell type pairs, p < 0.01. e, UMAP projection of each cell’s activity from a sample session, showing clustering of Sst44 neurons. f, Fraction of 10 nearest neighbours in activity space that are Sst44+. Dashed line: mean after shuffling cell type identities. ** p < 0.01, Kolmogorov-Smirnov test. These data for RSC were collected on interleaved PPC sessions from the same mice as in Fig. 5. In df, activity was smoothed with a 0.25 s gaussian filter. 7 mice, 23 sessions. Mean and bootstrapped 95% confidence intervals are shown.
Extended Data Fig. 12
Extended Data Fig. 12. Optogenetic inhibition of Sst44 cells in posterior parietal cortex during navigation and heading perturbations.
This experiment aims to test the involvement of Sst44 cells in driving moment-to-moment corrections in well trained mice. We targeted optogenetic silencing to Sst44 cells and looked for changes in behaviour during course corrections. We tested the efficacy of our optogenetic inhibition approach in a separate set of experiments, not in the context of behaviour, by looking for an indirect effect of optogenetic inhibition of Sst44 cells on circuit activity. Note that we did not directly measure the suppression of activity in Sst44 cells nor did we measure their suppression during error correction events when they are expected to receive strong inputs, including through electrical connections from gap junction coupling. Therefore, we cannot exclude that Sst44 cells spiked during error corrections in our behavioural experiments. Although we did not observe a behavioural effect from targeting optogenetic inhibition to Sst44 cells, we caution that this may be due to technical reasons, rather than reflecting the lack of involvement of Sst44 cells in driving moment-to-moment course corrections. We thus encourage readers to interpret these experiments cautiously. See Methods for further details. a, We expressed stGtACR2 under the control of the Sst44 enhancer in PPC. Extracellular recording of circuit activity (pooling spikes across all probe units) in PPC during photostimulation (470 nm, 40 Hz, 50% duty cycle, 0.7 mW average power through a 200 µm diameter optic fibre). 8 probe insertions, 20 trials per probe insertion, 2 mice. b, Same as a, for the non-injected contralateral side. 6 probe insertions, 20 trials per probe insertion, 2 mice. c, T-maze accuracy during trials in which Sst44 cells in PPC were inhibited (Laser ON PPC) vs control trials in which the laser was directed to control sites (Laser ON Control). In heading perturbation trials, we added a heading perturbation as in Fig. 6. Control trials without a heading perturbation were interleaved. Light stimulation was as in ab, except we illuminated a 1 mm diameter spot centred on PPC in each hemisphere to fully inhibit this area, and doubled the average power density to help compensate for the thickening of the dura under the window over time during training. d, Mouse’s behaviour over time during heading perturbations. Left and right perturbations were pooled after inverting behaviour for left perturbations. Mean and bootstrapped 95% confidence intervals across trials are shown.

References

    1. Harvey CD, Coen P, Tank DW. Choice-specific sequences in parietal cortex during a virtual-navigation decision task. Nature. 2012;484:62–68. doi: 10.1038/nature10918. - DOI - PMC - PubMed
    1. Licata AM, et al. Posterior parietal cortex guides visual decisions in rats. J. Neurosci. 2017;37:4954–4966. doi: 10.1523/JNEUROSCI.0105-17.2017. - DOI - PMC - PubMed
    1. Hanks TD, et al. Distinct relationships of parietal and prefrontal cortices to evidence accumulation. Nature. 2015;520:220–223. doi: 10.1038/nature14066. - DOI - PMC - PubMed
    1. Kubanek J, Li JM, Snyder LH. Motor role of parietal cortex in a monkey model of hemispatial neglect. Proc. Natl Acad. Sci. USA. 2015;112:E2067–E2072. doi: 10.1073/pnas.1418324112. - DOI - PMC - PubMed
    1. Tasic B, et al. Shared and distinct transcriptomic cell types across neocortical areas. Nature. 2018;563:72–78. doi: 10.1038/s41586-018-0654-5. - DOI - PMC - PubMed

Publication types