

Epidemiology of gastrointestinal infections: lessons learned from syndromic testing, Region Zealand, Denmark
- PMID: 37468662
- PMCID: PMC10427544
- DOI: 10.1007/s10096-023-04642-5
Epidemiology of gastrointestinal infections: lessons learned from syndromic testing, Region Zealand, Denmark
Abstract
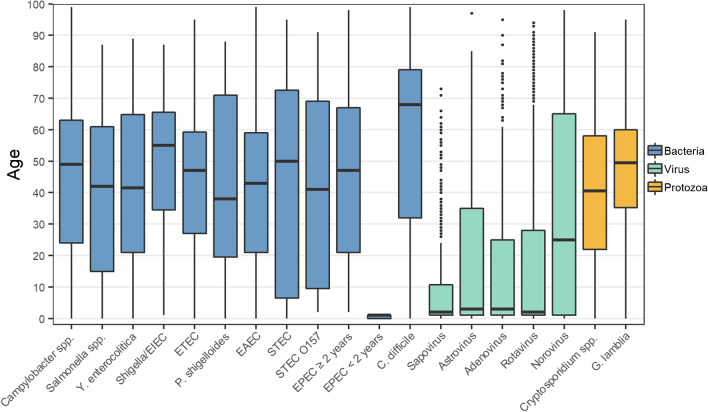
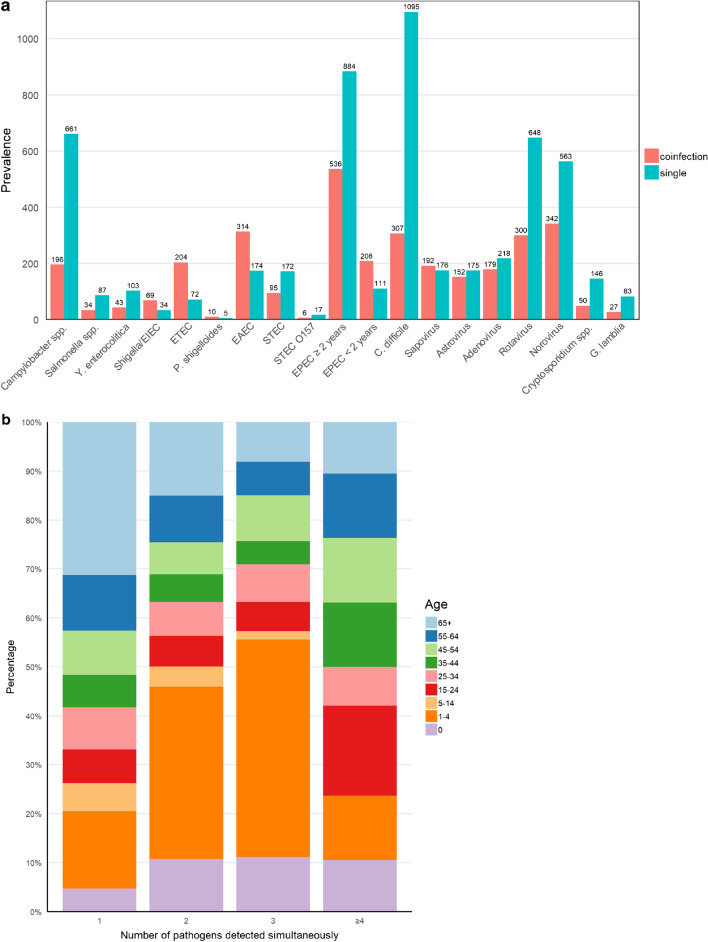
The aim of this study was to investigate the value of syndromic diagnostic testing for a better understanding of the epidemiology of gastrointestinal infections in Denmark. Here we evaluated the QIAstat-Dx® Gastrointestinal (GI) Panel 1 assay on 18,610 fecal samples requested for analysis for enteric pathogens in Region Zealand, Denmark, in 1 year (October 1, 2021, to September 30, 2022). In total, 6905 (37%) samples were detected positive for one or more diarrhoeal bacteria, viruses, and protozoa. The most common bacterial, viral, and parasitic pathogens detected with the QIAstat-Dx® Gastrointestinal Panel 1 were EPEC (in patients ≥ 2 years of age) (n = 1420 (20.6%)), rotavirus (n = 948 (13.7%)), and Cryptosporidium spp. (n = 196 (2.84%)). We identified a large diversity in infections likely reflecting substantial differences in the epidemiology including origin of infections, mode of transmission, seasonality, age-dependent susceptibility to disease, severity, and travel history. All pathogens were detected as both single and coinfections. Viral infections peaked in March with a positive rate of 31.6%, and bacterial infections peaked in August with a positive rate of 35.3%. ETEC, Shigella/EIEC, EAEC, and P. shigelloides were most related to travel activity, and coinfections were frequent. The distribution of Ct values varied significantly between the pathogens, with the lowest Ct values (median 17-18) observed in astrovirus, adenovirus, and rotavirus. Our results highlight the value of providing extensive diagnostic testing on fecal samples for sufficient detection of relevant diarrhoeal pathogens for optimal clinical care.
Keywords: Diarrhea; Evaluation; Experience; Gastrointestinal infections; Multiplex PCR; QIAstat-Dx; Syndromic testing.
© 2023. The Author(s).
Conflict of interest statement
Rikke Lykke Johansen, Christian Højte Schouw, Tina Vasehus Madsen, and Xiaohui Chen Nielsen declare they have no financial interests. Jørgen Engberg has received a speaker honorarium from QIAGEN.
Figures


References
-
- Vos T, Allen C, Arora M, Barber RM, Bhutta ZA, Brown A, et al. Global, regional, and national incidence, prevalence, and years lived with disability for 310 diseases and injuries, 1990–2015: a systematic analysis for the Global Burden of Disease Study 2015. Lancet. 2016;388:1545–1602. doi: 10.1016/S0140-6736(16)31678-6. - DOI - PMC - PubMed
-
- Calderaro A, Martinelli M, Buttrini M, Montecchini S, Covan S, Rossi S, et al. Contribution of the FilmArray® Gastrointestinal Panel in the laboratory diagnosis of gastroenteritis in a cohort of children: a two-year prospective study. Int J Med Microbiol. 2018;308:514–521. doi: 10.1016/j.ijmm.2018.04.007. - DOI - PubMed
MeSH terms
LinkOut - more resources
Full Text Sources
Medical
Miscellaneous
