. 2023 Jul 19;80(8):216.
doi: 10.1007/s00018-023-04862-0.

Protrudin-mediated ER-endosome contact sites promote phagocytosis

Affiliations

Protrudin-mediated ER-endosome contact sites promote phagocytosis

Liv Anker Elfmark et al. Cell Mol Life Sci. .

Abstract

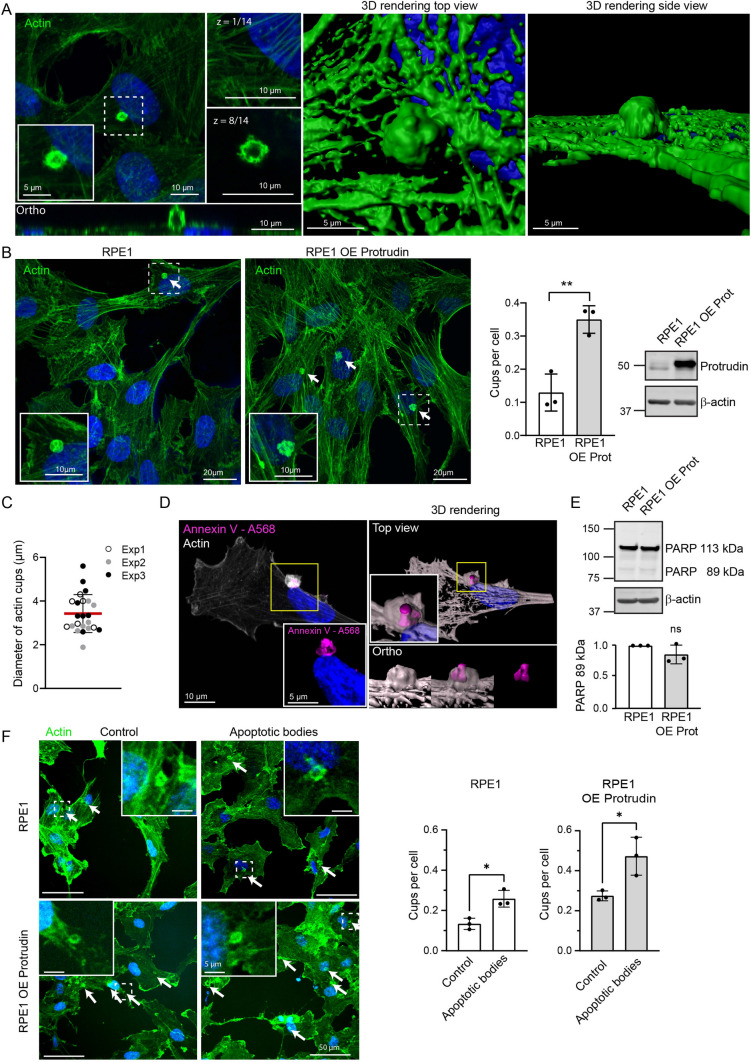
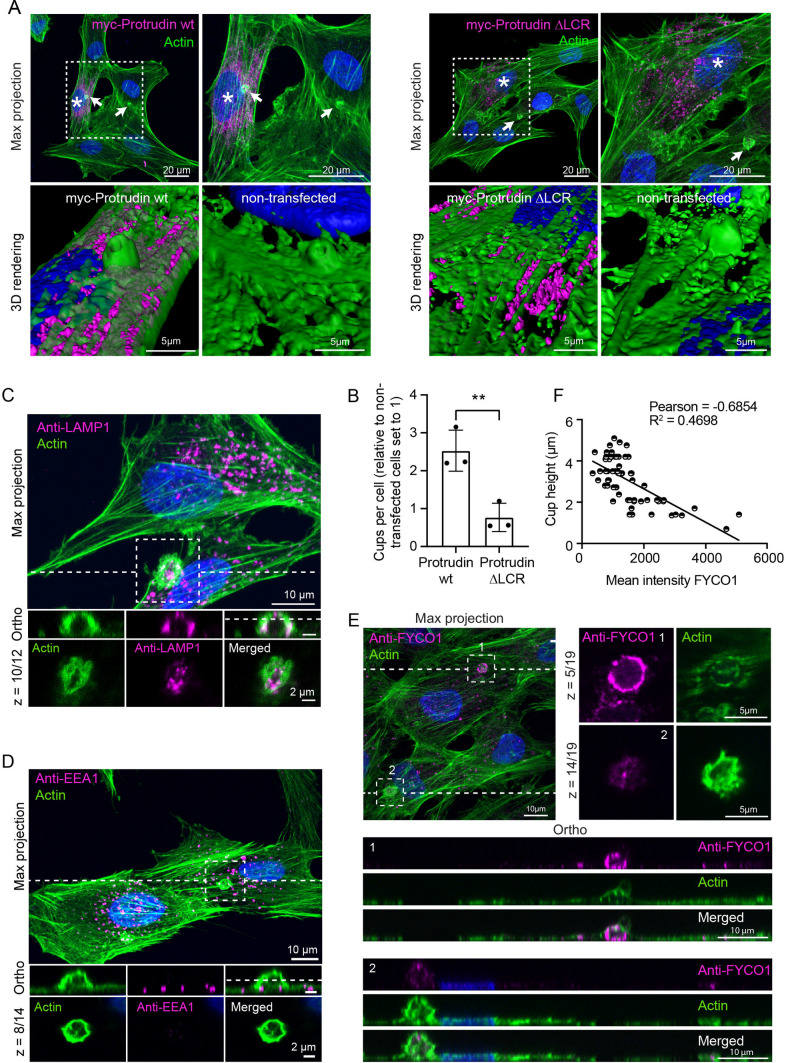
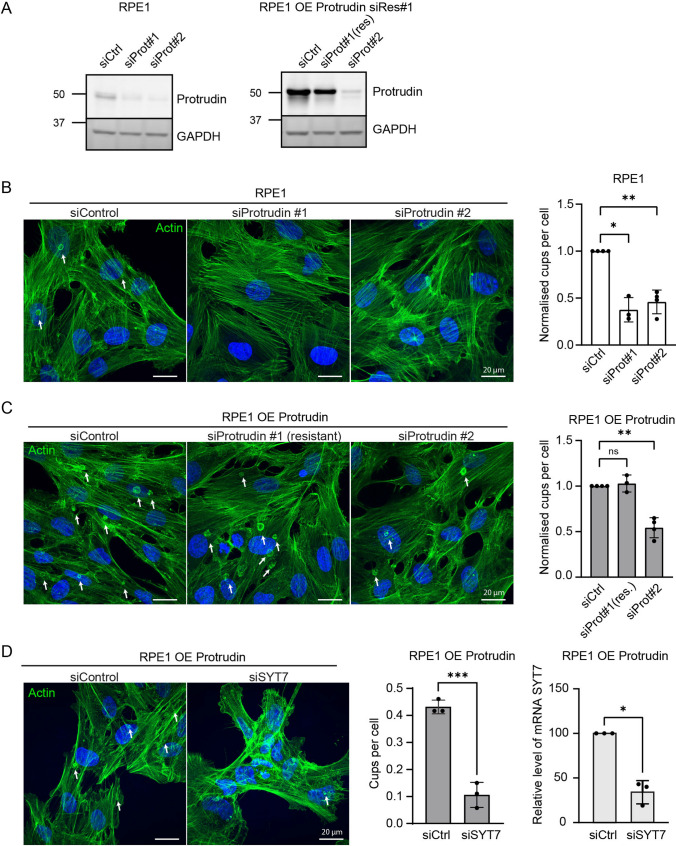
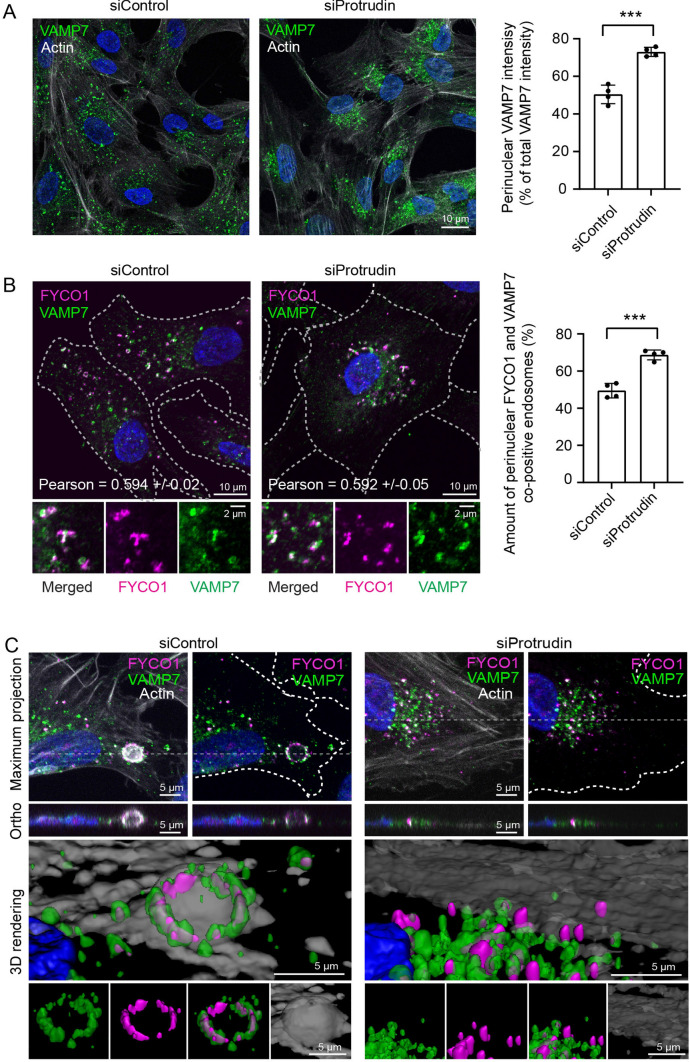
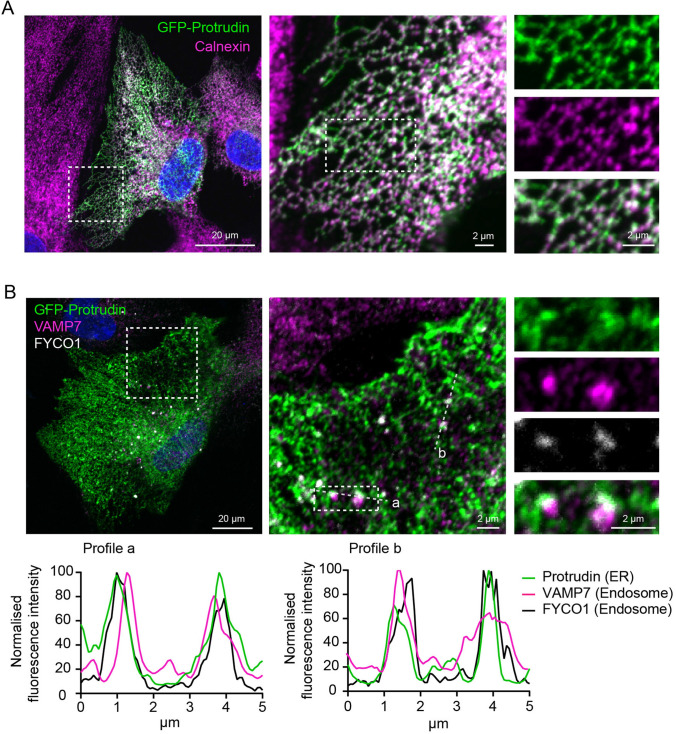
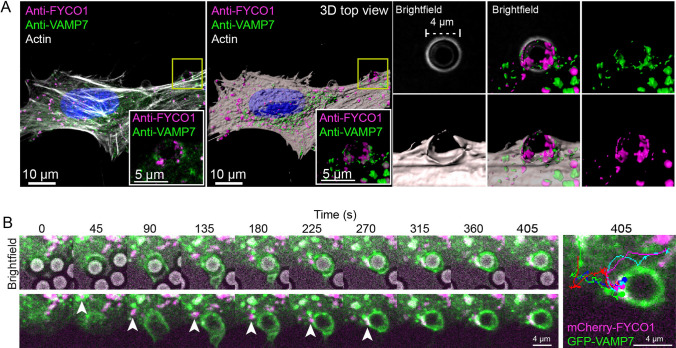
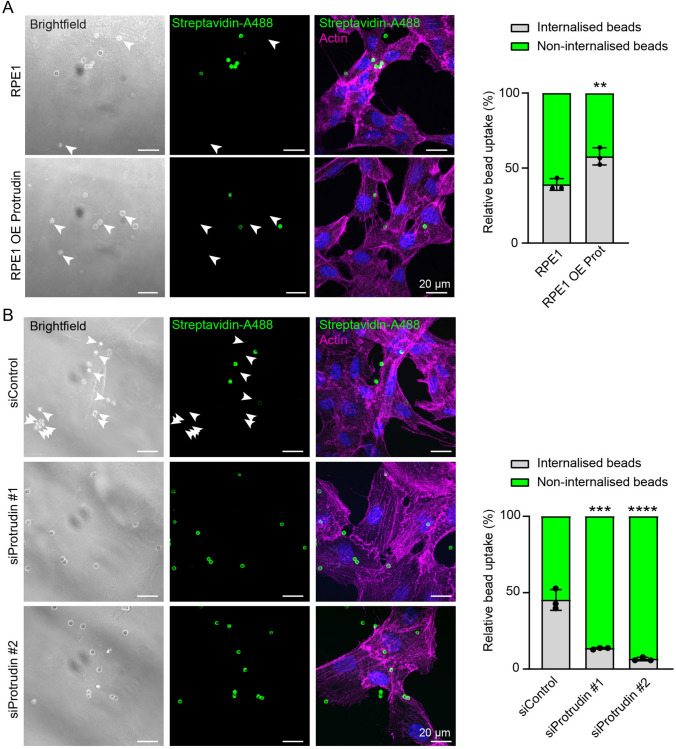
During phagocytosis, endosomes both contribute with membrane to forming phagosomes and promote phagosome maturation. However, how these vesicles are delivered to the phagocytic cup and the phagosome has been unknown. Here, we show that Protrudin-mediated endoplasmic reticulum (ER)-endosome contact sites facilitate anterograde translocation of FYCO1 and VAMP7-positive late endosomes and lysosomes (LELys) to forming phagocytic cups in a retinal pigment epithelial-derived cell line (RPE1). Protrudin-dependent phagocytic cup formation required SYT7, which promotes fusion of LELys with the plasma membrane. RPE1 cells perform phagocytosis of dead cells (efferocytosis) that expose phosphatidylserine (PS) on their surface. Exogenous addition of apoptotic bodies increased the formation of phagocytic cups, which further increased when Protrudin was overexpressed. Overexpression of Protrudin also led to elevated uptake of silica beads coated with PS. Conversely, Protrudin depletion or abrogation of ER-endosome contact sites inhibited phagocytic cup formation resulting in reduced uptake of PS-coated beads. Thus, the Protrudin pathway delivers endosomes to facilitate formation of the phagocytic cup important for PS-dependent phagocytosis.

Keywords: Efferocytosis; Endosomes; FYCO1; Phagocytosis; Protrudin; RAB7; VAMP7.


Conflict of interest statement

The authors declare no competing financial interests.

Figures

Fig. 1
Fig. 1
Overexpression of Protrudin promotes phagocytic cup formation. A RPE1 cells were grown on coverslips, fixed, and stained with Phalloidin Alexa Fluor 488 to visualise F-actin and imaged by confocal microscopy. Shown is the sum projection of a confocal z-stack. Right insets display the actin organisation in two confocal sections, where the highest section shows an actin-rich circular structure. “z = ” indicates which optical confocal section from the z-stack is displayed. The bottom panel shows the orthogonal view of the actin structure. Images to the right are 3D renderings of the same structure shown from two different angles. B RPE1 and RPE1 OE Protrudin cells were grown on coverslips, fixed, and stained with Phalloidin Alexa Fluor 488. A confocal z-stack is displayed as a maximum intensity projection. Arrows point to actin cups. The number of actin cups is increased when Protrudin is overexpressed. Bar graph shows the mean number of actin cups per cell ± s.d, analysing over 200 cells in each experiment, n = 3 experiments. **P < 0.01, unpaired two-tailed t test. Western blot validating the expression level of Protrudin in the RPE1 cells and the stable cell line overexpressing Protrudin. β-actin acts as a loading control. Note that RPE1 cells express several Protrudin isoforms often represented as a double band around 50 kDa. Exogenous Protrudin in RPE1 OE cells is the canonical isoform 1. OE Prot overexpressed Protrudin. C Quantification of the diameter of dorsal actin structures from RPE1 cells. Each dot represents one measurement colour coded by experimental replicate. 23 cups were analysed in total. Graph denotes mean ± s.d., n = 3 experiments. D Confocal images of RPE1 cells that were fixed and stained with AnnexinV-Alexa-568 and Phalloidin Alexa Fluor 488 to visualise phosphatidylserine-rich particles and F-actin, respectively. Shown is a maximum intensity projection of a confocal z-stack with a close-up showing the enrichment of AnnexinV-Alexa-568 inside the actin structure. A 3D rendering shows the same structure from different angles. Displayed is one representative image of at least 5 micrographs taken per experiment, n = 3 experiments. E Western blot of whole cell lysate from untreated RPE1 and RPE1 OE Protrudin cells, showing a strong band of full-length PARP (113 kDa). A weak band below represents a small amount of cleaved PARP (89 kDa) present in the culture. Representative lysate from three experiments, β-actin is used as a loading control. OE Prot = Overexpressed Protrudin. The graph represents the quantification of cleaved PARP (89 kDa). Shown is mean ± s.d., n = 3 experiments. ns not statistically significant, one sample t test. F RPE1 cells or RPE1 OE Protrudin cells were treated with apoptotic bodies or complete medium as a negative control and stained with Phalloidin Alexa Fluor 488. Addition of apoptotic bodies increases the number of actin cups in both cell lines. The graphs represent the mean number of cups per cell ± s.d. More than 200 cells were counted per condition, in each experiment, n = 3 experiments. *P < 0.05, unpaired two-tailed t test
Fig. 2
Fig. 2
Protrudin-mediated ER-endosome contact sites are required for the formation of phagocytic cups enriched in FYCO1-positive LELys. A Representative confocal micrographs showing RPE1 cells transiently transfected with myc-Protrudin wt or ∆LCR, deficient in RAB7 binding. Note that the myc-Protrudin ∆LCR expressing cell does not form a phagocytic cup as opposed to myc-Protrudin wt or non-transfected cells. Phalloidin Rhodamine (green), anti-myc (magenta). Asterisks indicate transfected cells. B Quantification of the relative amount of phagocytic cups found in myc-Protrudin wt or ∆LCR expressing RPE1 cells, as shown in A. The graph represents mean ± s.d, n = 3 experiments, unpaired two-tailed t test. **P < 0.01. In total, 360 cells were quantified for each condition. C, D Representative confocal micrographs of RPE1 OE Protrudin cells stained with Phalloidin Alexa Fluor 488 and either anti-LAMP1 or anti-EEA1 antibodies. Maximum intensity projection and zoom-in on phagocytic cups. An orthogonal view of the highlighted area and a single confocal section are displayed. “z = ” indicates which optical confocal section from the z-stack is displayed. Note that LAMP1, but not EEA1 is enriched in the phagocytic cup. Representative image of 5 images per experiment, n = 3 experiments. E RPE1 OE Protrudin cells were seeded on coverslips, fixed, and analysed by confocal microscopy. Cells were stained with an antibody against FYCO1 and with Phalloidin Alexa Fluor 488. A maximum intensity projection of a confocal z-stack shows two phagocytic cups, and the orthogonal sections display the different cup heights. Zoom-ins highlight two confocal sections of the indicated regions. “z = ” indicates which optical confocal section from the z-stack is displayed. Note that FYCO1 fluorescence intensities differ. F Graph demonstrates an inverse correlation between the height of the actin cup and the mean intensity of FYCO1 staining. Intensity was measured in a ROI around each actin cup from the sum projections of confocal z-stacks. Cup height was calculated by adding all the confocal sections showing the same actin circle and multiplying with the step size of 0.34 μm. Each plotted point represents one cup, and the line represents the linear regression with a R2 = 0.4698, Pearson correlation = − 0.6854. A total of 63 cups were quantified, n = 2 experiments
Fig. 3
Fig. 3
Protrudin or SYT7 depletion decreases formation of phagocytic cups. A Western blots showing the efficiency of siRNA depletion of Protrudin in RPE1 cells and RPE1 OE Protrudin cells. GAPDH was used as loading control. siCtrl = siRNA control, siProt#1 = siRNA Protrudin oligonucleotide 1, siProt#2 = siRNA Protrudin oligonucleotide 2, res. = resistant. B, C Representative maximum intensity projections of confocal z-stacks of RPE1 cells or RPE1 OE Protrudin cells stained with Phalloidin Rhodamine (green). Arrows point to phagocytic cups. Depletion of Protrudin with siRNA oligonucleotides hinders the formation of phagocytic cups in both RPE1 and RPE1 OE Protrudin cells. The phenotype of phagocytic cup formation in the OE Protrudin cell line was rescued in cells expressing Protrudin resistant against siRNA Protrudin #1. Graph demonstrates the mean number of phagocytic cups per cell, comparing the various siRNA treatments and cell lines, depicted as fold change of siRNA control. Each bar represents the mean ± s.d. of n = 3 or 4 experiments, analysing > 200 cells per experiment. *P < 0.05, **P < 0.01, n.s. not significant, one sample t test. D RPE1 OE Protrudin cells were treated with siRNA against SYT7 or siControl and analysed after 48 h. The cells were fixed and stained with Phalloidin Rhodamine to be analysed by confocal microscopy. Arrows indicate phagocytic cups in siRNA control and siRNA SYT7 treated cells in maximum intensity projections of confocal z-stacks. SYT7 depletion reduced the formation of phagocytic cups. Values denote mean ± s.d. cups per cell for more than 100 cells analysed in each experiment, n = 3 experiments. ***P < 0.001, unpaired two-tailed t test. Real-time PCR for verification of SYT7 knockdown from three independent experiments in RPE1 cells overexpressing Protrudin. *P < 0.05, one sample t test
Fig. 4
Fig. 4
Recruitment of FYCO1 and VAMP7-positive endosomes to the phagocytic cup requires Protrudin. A RPE1 cells were treated with siRNA Protrudin #1 and seeded on coverslips. 48 h after transfection the cells were fixed and stained with anti-VAMP7 antibody and Phalloidin Alexa Fluor 647. In the Protrudin depleted cells, VAMP7-positive endosomes cluster more perinuclearly, implicating a role for Protrudin in VAMP7-positive endosome positioning. Representative images of a minimum of 10 images per experiment, n = 4. The graph represents the relative sum fluorescence intensity of VAMP7-positive puncta in the perinuclear region as % of the complete cellular population of VAMP7 dots from at least 190 cells per condition quantified using the NisElements software. Shown is mean ± s.d., n = 4 experiments ***P < 0.001, unpaired two-tailed t test. B RPE1 cells were treated as in A and stained with anti-VAMP7 and anti-FYCO1 antibodies. Numbers denote Pearson correlation coefficient calculated from 5 images per condition. Insets highlight the co-occurrence of VAMP7 and FYCO1 on the same endosomal structures. The graph represents the quantification of the degree of perinuclear positioning of FYCO1 and VAMP7 co-positive dots detected automatically using NisElements. Shown is mean ± s.d., n = 4 experiments ***P < 0.001, unpaired two-tailed t test. > 190 cells were quantified per condition, same dataset as in A. C Maximum projection, orthographic view and 3D rendering of confocal z-stacks showing VAMP7, FYCO1 and F-actin in RPE1 cells transfected with control siRNA or Protrudin siRNA. Note that FYCO1 and VAMP7 co-positive dots accumulate at the base of an actin-rich cup in the control treated cells, whereas the Protrudin depleted cell does not form a cup and shows a perinuclear localization of FYCO1 and VAMP7.
Fig. 5
Fig. 5
Protrudin colocalises with Calnexin in the ER and forms contact sites with VAMP7 and FYCO1-positive LELys. A RPE1 cells were transiently transfected with GFP-Protrudin, fixed and stained with antibodies against GFP and the ER marker Calnexin, showing that Protrudin resides in the ER. Representative of 12 micrographs. B RPE1 cells were transiently transfected with GFP-Protrudin, fixed and stained with anti-VAMP7 and anti-FYCO1 antibodies. The insets highlight two VAMP7 and FYCO1 co-positive dots in close apposition to GFP-Protrudin in the ER. The fluorescence intensity line plots give two examples of how VAMP7 and FYCO1-positive dots overlap with Protrudin in the ER, indicative of ER-endosome contact sites
Fig. 6
Fig. 6
VAMP7 and FYCO1-positive LELys are recruited to phagocytic cups as they form. A RPE1 cells were incubated with 4 μm diameter PS-beads for 15 min at 37 °C before fixation. Cells were immunostained with anti-VAMP7, anti-FYCO1 and Phalloidin Rhodamine. Micrograph of a cell (maximum intensity projection) with double-positive endosomes enriched around a PS-bead. 3D surface rendering of the same image shows the cell from the top. Insets show the endosomes and/or actin in the highlighted area with or without the bead in brightfield. Representative image from a total of 16 confocal z-stacks, n = 4 experiments. B RPE1 cells were transiently transfected with GFP-VAMP7 and mCherry-FYCO1 for 24 h before live-cell imaging. PS-beads were added to the cells and the montage (still images from Video 1) shows close-up frames from every 45th second in a cell where bead uptake occurs. The bead is visible in brightfield. Arrowhead highlights one FYCO1 and VAMP7 double-positive endosome transported to the bead during engulfment. The image to the right visualises tracks from endosomes traveling towards the phagocytic cup. Each coloured line represents the transportation route of one double-positive endosome to the phagocytic cup, arrowheads in the montage correspond to the green track
Fig. 7
Fig. 7
Protrudin expression levels affect the uptake of PS-beads. A RPE1 and RPE1 OE Protrudin cells seeded on coverslips were incubated with PS-biotin beads for 30 min. Streptavidin-Alexa-488 labelling allows to distinguish non-internalised from internalised beads (see methods section). Maximum intensity projections of representative z-stacks show that the OE Protrudin cells have more internalised beads (arrows) compared to parental cells. Graph shows the relative percentage of internalised beads to the number of total cell-associated beads. Values denote mean ± s.d. A minimum of 40 cells were analysed per condition in each experiment, n = 3 experiments. **P < 0.01, two-tailed t test. B RPE1 cells were transfected with siRNA control, siProtrudin #1 or siProtrudin #2. 96 h after transfection they were incubated with PS-biotin beads and processed as in (A). Micrographs show maximum intensity projections of z-stacks with arrows pointing to internalised beads. Protrudin-depleted cells have a lower number of internalised beads compared to the control. Graph shows the relative percentage of internalised beads to the total amount of cell-associated beads. Values denote mean ± s.d. A minimum of 50 cells was analysed per condition in each experiment, n = 3 experiments. ***P < 0.001, ****P < 0.0001, One-way ANOVA. siCtrl = siRNA control, siProt#1 = siRNA Protrudin oligonucleotide 1, siProt#2 = siRNA Protrudin oligonucleotide 2
Fig. 8
Fig. 8
Model illustrating the role of the Protrudin pathway in phagocytosis. A Left: inactive Protrudin pathway leads to incomplete phagocytic cup formation. Non-successful uptake of PS-rich silica beads or apoptotic bodies (green sphere). Right: active Protrudin pathway results in efficient phagocytic cup formation and particle internalisation. The Protrudin pathway promotes Kinesin-1 dependent delivery of vesicles to the forming phagocytic cup. FYCO1 acts as an adapter protein between the motor protein Kinesin-1 and the RAB7 and PtdIns3P-positive vesicle. The endosomes fuse in a Ca2+-dependent manner with the PM mediated by SYT7 and VAMP7 to aid internalisation of particles. Internalised beads cannot be stained by Streptavidin-Alexa-488 and are visible as colourless spheres by brightfield microscopy (grey sphere, Fig. 7). Overexpression of Protrudin increases the cell’s capacity to internalise PS-rich particles. Created with BioRender.com. B Detailed illustration of Kinesin-1 handover from Protrudin to LELys at ER-endosome contact sites. (1) Kinesin-1 binds to Protrudin in the ER [67]. (2) Protrudin binds to RAB7 and PdIns3P at the LELy, forming contact sites. The endosomal adaptor protein FYCO1 receives Kinesin-1 [24]. (3) Kinesin-1 detaches from Protrudin and binds to a microtubule, resulting in plus end directed transport of the SYT7 and VAMP7-positive LELy. Created with BioRender.com

Similar articles

Cited by

References

    1. Botelho RJ, Grinstein S. Phagocytosis. Curr Biol. 2011;21(14):R533–R538. doi: 10.1016/j.cub.2011.05.053. - DOI - PubMed
    1. Sender R, Milo R. The distribution of cellular turnover in the human body. Nat Med. 2021;27(1):45–48. doi: 10.1038/s41591-020-01182-9. - DOI - PubMed
    1. Flannagan RS, Jaumouille V, Grinstein S. The cell biology of phagocytosis. Annu Rev Pathol. 2012;7:61–98. doi: 10.1146/annurev-pathol-011811-132445. - DOI - PubMed
    1. Marino G, Kroemer G. Mechanisms of apoptotic phosphatidylserine exposure. Cell Res. 2013;23(11):1247–1248. doi: 10.1038/cr.2013.115. - DOI - PMC - PubMed
    1. Darland-Ransom M, Wang X, Sun CL, Mapes J, Gengyo-Ando K, Mitani S, et al. Role of C. elegans TAT-1 protein in maintaining plasma membrane phosphatidylserine asymmetry. Science. 2008;320(5875):528–531. doi: 10.1126/science.1155847. - DOI - PubMed

LinkOut - more resources