. 2023 Jul 20;15(1):50.
doi: 10.1186/s13073-023-01206-2.

A proteomics analysis of 5xFAD mouse brain regions reveals the lysosome-associated protein Arl8b as a candidate biomarker for Alzheimer's disease

Affiliations

A proteomics analysis of 5xFAD mouse brain regions reveals the lysosome-associated protein Arl8b as a candidate biomarker for Alzheimer's disease

Annett Boeddrich et al. Genome Med. .

Abstract

Background: Alzheimer's disease (AD) is characterized by the intra- and extracellular accumulation of amyloid-β (Aβ) peptides. How Aβ aggregates perturb the proteome in brains of patients and AD transgenic mouse models, remains largely unclear. State-of-the-art mass spectrometry (MS) methods can comprehensively detect proteomic alterations, providing relevant insights unobtainable with transcriptomics investigations. Analyses of the relationship between progressive Aβ aggregation and protein abundance changes in brains of 5xFAD transgenic mice have not been reported previously.

Methods: We quantified progressive Aβ aggregation in hippocampus and cortex of 5xFAD mice and controls with immunohistochemistry and membrane filter assays. Protein changes in different mouse tissues were analyzed by MS-based proteomics using label-free quantification; resulting MS data were processed using an established pipeline. Results were contrasted with existing proteomic data sets from postmortem AD patient brains. Finally, abundance changes in the candidate marker Arl8b were validated in cerebrospinal fluid (CSF) from AD patients and controls using ELISAs.

Results: Experiments revealed faster accumulation of Aβ42 peptides in hippocampus than in cortex of 5xFAD mice, with more protein abundance changes in hippocampus, indicating that Aβ42 aggregate deposition is associated with brain region-specific proteome perturbations. Generating time-resolved data sets, we defined Aβ aggregate-correlated and anticorrelated proteome changes, a fraction of which was conserved in postmortem AD patient brain tissue, suggesting that proteome changes in 5xFAD mice mimic disease-relevant changes in human AD. We detected a positive correlation between Aβ42 aggregate deposition in the hippocampus of 5xFAD mice and the abundance of the lysosome-associated small GTPase Arl8b, which accumulated together with axonal lysosomal membranes in close proximity of extracellular Aβ plaques in 5xFAD brains. Abnormal aggregation of Arl8b was observed in human AD brain tissue. Arl8b protein levels were significantly increased in CSF of AD patients.

Conclusions: We report a comprehensive biochemical and proteomic investigation of hippocampal and cortical brain tissue derived from 5xFAD transgenic mice, providing a valuable resource to the neuroscientific community. We identified Arl8b, with significant abundance changes in 5xFAD and AD patient brains. Arl8b might enable the measurement of progressive lysosome accumulation in AD patients and have clinical utility as a candidate biomarker.

Keywords: 5xFAD; Aggregation; Alzheimer’s disease; Amyloid-β Amyloidogenesis; Arl8b; Biomarker; Proteomics.


Conflict of interest statement

LMB reports personal fees from Hoffman La Roche Ltd, Remix Therapeutics, Annexon Biosciences, and Genentech. EJW reports personal fees from Hoffman La Roche Ltd, Triplet Therapeutics, PTC Therapeutics, Takeda, Teitur Trophics and Vico Therapeutics. All honoraria for these consultancies were paid through the offices of UCL Consultants Ltd., a wholly-owned subsidiary of University College London. The mentioned commercial entities have not participated in the design, performance, evaluation, or writing of the study. The remaining authors declare that they have no competing interests.

Figures

Fig. 1
Fig. 1
Analysis of Aβ-peptide levels and -aggregation in brains of 5xFAD mice. a Hippocampal and cortical brain extracts of 2-, 5-, and 8-month-old AD (n = 5) mice were used for Aβ42 peptide ELISAs. As a control (Ctrl), a pool of wt mouse brain extracts was tested in parallel, which was produced by mixing equal protein amounts of tissue extracts derived from 5 different wt mice per age and tissue. The graph represents the mean ± SD of five biological replicates of tg mice per age and tissue. Statistical analysis: Unpaired, two-tailed t-test between hippocampal and cortical samples of mice of the same age (**, p = 0.0054). b Quantification of Aβ aggregates retained on filter membranes (Additional file 1: Fig. S2a) was performed using the Aida image analysis software. Per tissue and age, extracts of five different mice were analyzed. All data are expressed as mean ± SD of five biological replicates. Statistical significance was assessed between hippocampal and cortical samples of mice with the same age using an unpaired, two-tailed t-test (**, p = 0.0016). c Pearson correlation between Aβ42 peptide levels determined by ELISA (blue line, right axis) and Aβ aggregates determined by MFA (purple line, left axis); hippocampal tissue samples were analyzed. The statistical significance of the association between the Aβ42 peptide levels and Aβ aggregates was measured with a two-tailed t-test (*, p = 0.024). d Plaque load was determined in hippocampus and cortex of 5xFAD mice at different ages (n = 5 mice per age and tissue). Plaques were immunohistochemically stained with the antibody 6E10. Data represent mean ± SD. The statistical significance was assessed between hippocampal and cortical tissues from the same age using an unpaired, two-tailed t-test (*, p = 0.0204; ***, p = 0.0009; ****, p < 0.0001). e Plaque counts were determined in hippocampal and cortical tissues of 2-, 5-, and 8-month-old 5xFAD mice (n = 5 per age and tissue) by antibody 6E10 and ThioS staining. Data represent mean ± SD. The statistical significance was assessed with the antibody 6E10 (*, p = 0.0141; ***, p = 0.0002; ****, p < 0.0001) and ThioS staining (ns; ***, p = 0.0003; ****, p < 0.0001) each for hippocampal and cortical tissues of mice with the same age using an unpaired, two-tailed t-test. f Immunofluorescence analysis of dense core (top row) and diffuse plaques (bottom row) in a brain slice of an 8-month-old 5xFAD mouse. Red indicates 6E10 immunoreactive material. Green indicates fibrillar Aβ material stained with ThioS. Yellow indicates merged signal. g Fractionation of hippocampal and cortical brain extracts derived from 8-month-old 5xFAD mice. Fractions from sucrose density gradient centrifugations of 10,000 × g membrane pellets were analyzed by immunoblotting using antibodies detecting APP and amyloid-β (antibody 6E10), marker proteins of the endoplasmic reticulum (Calnexin), lipid rafts (Flotillin), the Golgi apparatus (Golgin97), lysosomes (Lamp1), and mitochondria (VDAC, NDUFB3). Equal exposure times per antibody for hippocampus and cortex are shown. Per fraction, equal volumes were loaded. From the solubilized pellet (P10,000 × g), 5 µg was loaded
Fig. 2
Fig. 2
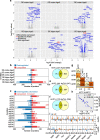
Differential expression analysis of proteins in brains of 5xFAD mice. a Volcano plots depicting the protein expression logarithmic fold-changes (log10 fold-change, x-axis) and the adjusted p-values (− log10 p-value, y-axis). Differentially Expressed proteins across all time points (Age 2, 5, and 8) in cortex and hippocampus were analyzed (DE.cortex.Age2, DE.cortex.Age5 and DE.cortex.Age8; DE.hippo.Age2, DE.hippo.Age5 and DE.hippo.Age8). All proteins highlighted in blue have significantly altered expression. The candidate AD biomarker Arl8b, marked in red, is significantly upregulated in hippocampus. Gene names for potential proteins of interest with highly significant fold-changes are indicated. Proteins not significantly changed in their abundance are highlighted in gray. Significance was determined using a two-tailed t-test and a Benjamini–Hochberg False Discovery Rate (FDR) set to 5%. b Numbers of differentially expressed proteins obtained by comparing the protein expression measurements of 5xFAD mice at different ages with their corresponding, age-matched, wild-type controls in cortex and hippocampus. The identifiers of the amounts of proteins analyzed were denoted analogously as in panel a. Bars indicate the numbers of significant down- (blue) and upregulated (red) proteins. c Numbers of proteins significantly differentially regulated. A2TC (Age 2, Tissue Cortex), A5TC and A8TC label the numbers of proteins for which the transgene effect is significant in cortex, at 2, 5, and 8 months, respectively. Proteins more abundant in 5xFAD mice are shown in red, while proteins more abundant in wild-type mice are shown in blue. A2TH (Age 2, Tissue Hippocampus), A5TH, and A8TH label the same comparison in hippocampus. A52TC (Age 5 vs 2, Tissue Cortex), A85TC and A82TC refer to the numbers of proteins for which the transgene effect is significantly different at two time points (5 vs 2, 8 vs 5, and 8 vs 2 months) in cortex. The numbers of proteins which increase in abundance with age are shown in red, while the numbers of proteins that decrease with age are shown in blue. The corresponding labelling for the hippocampus samples are A52TH (Age 5 vs 2, Tissue Hippocampus), A85TH and A82TH. Finally, A2THC (Age 2, Tissue Hippocampus vs Cortex), A5THC and A8THC report the numbers of proteins for which the transgene effect is significantly different in cortex and hippocampus at 2, 5, and 8 months, respectively. Higher hippocampus abundance is shown in red on the right, and higher cortex abundance in blue on the left. The underlying data are available as Additional file 3: Supplementary Excel File 1c. d–f Venn diagrams showing the numbers of total (d), downregulated (e), and upregulated (f) proteins in cortex and hippocampus, including only significantly differentially expressed proteins (DEPs). The amounts of DEPs were denoted analogously to panel c but were combined across all time points (months 2, 5, and 8); the combination of DEPs is indicated by the x (e.g., AxTC). g Correlation analysis of DEPs for A2TC, A8TC, A2TH, A5TH, and A8TH. The degree of correlation was assessed by Spearman correlation coefficients (rS) and corresponding FDR-adjusted p-values (**, p < 0.01; ***, p < 0.001). Crosses indicate no correlation. The colors denote the values of the Spearman correlation coefficients. h Example Spearman inverse correlation of A2TC versus A8TC also shown in panel g. Time-dependent changes in the abundance of 8 mitochondrial proteins (i) and transcripts (j) that play a key role in oxidative phosphorylation and ATP production. The temporal changes of the LFCs across all ages (2, 5, and 8 months) in cortex (orange) and hippocampus (blue) are shown. The statistical significance of the differentially expressed proteins and transcripts was measured with a two-tailed t-test, adjusted by the Benjamini–Hochberg multiple testing correction (*, p < 0.05, **, p < 0.01; ***, p < 0.001). All analyses are based on mean values of measured intensities from five biological replicates of tg mice per age and tissue (n = 5)
Fig. 3
Fig. 3
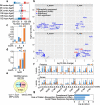
Identification of Aβ-correlated and anticorrelated protein alterations in 5xFAD brains. a Numbers of proteins that correlate (corr, in red) or anticorrelate (acorr, in blue) with Aβ aggregates in hippocampus and cortex and are differentially expressed at 2 (DE.cortex.Age2, DE.hippo.Age2), 5 (DE.cortex.Age5, DE.hippo.Age5), or 8 (DE.cortex.Age8, DE.hippo.Age8) months. The identifiers were denoted analogously as in Fig. 2a. The degree of correlation was assessed by Pearson correlation and corresponding FDR-adjusted p-values. b Volcano plots depicting the protein expression logarithmic fold-changes (log10 fold-change, x-axis) and the adjusted p-values (− log10 p-value, y-axis) across all time points (age 2, 5, and 8 months) for DEPs that correlate (corr) or anticorrelate (acorr) with Aβ aggregates in hippocampus (h) and cortex (c). All proteins highlighted in blue are expressed significantly differently. The Aβ-correlating AD biomarker candidate Arl8b is marked in red. Proteins of interest with highly significant fold-changes are indicated with gene names. Proteins not significantly changed are highlighted in gray. Significance was determined using a two-tailed t-test and a Benjamini–Hochberg False Discovery Rate (FDR) set to 5%. c, d Changes of APOE transcript (c) and protein (d) levels in hippocampus (H) and cortex (C) of 2-, 5-, and 8-month-old 5xFAD mice. LFC, log2 fold-change. e Number of differentially expressed genes (DEGs, light red) that overlap (purple) with Aβ aggregate-correlated (corr) and anticorrelated (acorr) DEPs (light blue). f Time-dependent changes in the abundance of 9 correlating or anticorrelating molecules; both protein (top) and transcript (bottom) level changes are shown. The temporal changes of the t-scores across all ages (2, 5, and 8 months) in cortex (orange) and hippocampus (blue) are illustrated. The statistical significance of differentially expressed proteins and transcripts was measured with a two-tailed t-test, adjusted by the Benjamini–Hochberg multiple testing correction (*, p < 0.05, **, p < 0.01; ***, p < 0.001). g Ingenuity pathway analysis (IPA) for the correlating or anticorrelating molecules that are changed both at the protein and transcript level as shown in panels e and f. The statistical significance of the association between the DEPs and the canonical pathways was measured with right-tailed Fisher’s exact test to calculate the p-values, adjusted by the Benjamini–Hochberg multiple testing correction. All analyses are based on mean values of measured intensities from five biological replicates of tg mice per age and tissue (n = 5)
Fig. 4
Fig. 4
Analysis of dysregulated proteins of 5xFAD brains and postmortem brains of AD patients. a Investigation of the overlap of DEPs in brains of 5xFAD mice and postmortem AD patients. Protein changes in cortical and hippocampal tissues of 8- and 5-month-old mice (DE.cortex.Age8; DE.hippo.Age5; DE.hippo.Age8) that contain Aβ aggregates (Fig. 1d) were compared with patient protein measurements. The amounts of DEPs are denoted analogously to Fig. 2a or have been abbreviated (C8, H5, H8). The human AD data were obtained from Drummond 2022 (D22, [43]), Johnson 2020 (J20, [41]), and Johnson 2022 (J22, [42]). The total numbers of DEPs in each dataset are indicated in brackets. In DE.cortex.Age8 and DE.hippo.Age5, the proteins present in all four data sets are depicted with gene names. b Correlation analyses of DEPs from cortical tissues of 8-month-old mice (DE.cortex.Age8) and DEPs from hippocampal tissues of 5- (DE.hippo.Age5) and 8-month-old mice (DE.hippo.Age8) with human AD patient data from Drummond 2022, Johnson 2020 and Johnson 2022 (as indicated in panel a) were performed. The degree of correlation was assessed by Spearman correlation coefficients (rS) and corresponding FDR-adjusted p-values (*, p < 0.05; **, p < 0.01; ***, p < 0.001). Colors denote the values of the Spearman correlation coefficients. c Example Spearman correlations and concordance representations of dysregulated proteins from 5xFAD mice (DE.cortex.Age8, DE.hippo.Age5, and DE.hippo.Age8) versus human AD patient data from Drummond 2022 along with human AD data against each other (D22 vs J22, D22 vs J20, J20 vs J22) are shown. The identifiers are denoted analogously to Figs. 2a and 4a. Proteins concordantly up- or downregulated in 5xFAD mice and human AD patient brains are shown in gray quadrants and marked in blue. Proteins of interest with highly significant fold-changes are indicated with gene names. Correlating but non-concordant proteins are marked in brown. d Generation of signatures for proteins concordantly dysregulated in 5xFAD mice and human AD patient brains. The heatmaps show the 15 most down (Sig-, left) or upregulated (Sig + , right) proteins. Colors denote the values of the log2 fold-changes. e Ingenuity pathway analysis (IPA) for the complete set of concordantly dysregulated proteins. The statistical significance of the association between the DEPs and the canonical pathways was measured with a right-tailed Fisher’s exact test to calculate p-values, adjusted by the Benjamini–Hochberg multiple testing correction. All analyses are based on mean values of measured intensities from five biological replicates of tg mice per age and tissue (n = 5)
Fig. 5
Fig. 5
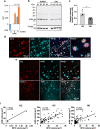
The protein Arl8b is upregulated in hippocampal tissues of 5xFAD mice. a Time-depended change of Arl8b protein abundance in hippocampal and cortical tissues of 5xFAD transgenic animals. LFC, log2 fold-change. b Hippocampal brain homogenates prepared from four 8-month-old 5xFAD (1 to 4) and control (ctrl; 1 to 4) mice were analyzed by SDS-PAGE and immunoblotting using anti-Arl8b. As a control, a tubulin (anti-alpha Tubulin, #T6074) immunoblot was performed. c Quantification of Arl8b expression in relation to tubulin using band intensities of immunoblots in b. Relative intensity values (mean ± SD) are shown for AD (n = 4) and Ctrl (n = 4) mice. Statistical significance was assessed between AD and Ctrl mice using an unpaired, two-tailed t-test (*, p = 0.0137). d Immunofluorescence analysis of 5xFAD mouse (8 months) brain slices using AlexaFluor594-labelled 6E10 antibody (red); an anti-Arl8b antibody combined with an AlexaFluor647-labelled anti-rabbit IgG (turquoise) was applied to detect Arl8b. The scale bar shown in the 6E10 image also applies to the Arl8b and merge image. The picture on the right shows a magnification (magnif.) of an area indicated in the merged picture. e Brain slices of 8-month-old 5xFAD mice were stained with the primary antibodies indicated in the images. For detection with 352 and Lamp1 antibodies, an AlexaFluor594-labelled anti-mouse IgG (red) was used; for Arl8b detection, an AlexaFluor647-labelled anti-rabbit IgG (turquoise) was applied. Antibody 352 specifically recognizes Aβ42 fibrillar aggregates [30]. f Pearson correlation between the volumes of Arl8b accumulations and 6E10-stained amyloid-beta plaques in hippocampus of 2- (H2), 5- (H5), and 8- (H8) month-old 5xFAD mice. A total of 60 plaques were analyzed in brain slices derived from 5- and 8-month-old 5xFAD mice. For 2-month-old 5xFAD mice, less than 60 plaques were analyzed, since amyloid burden at this age is low. The statistical significance of the association between the volumes of Arl8b accumulations and 6E10-stained amyloid-β plaques was measured with a two-tailed t-test (*, p = 0.024; ****, p < 0.0001)
Fig. 6
Fig. 6
Analysis of Arl8b expression in human brain and CSF samples. a Detection of Arl8b protein aggregates in postmortem brain homogenates of 10 AD patients (1 to 10, black lettering) and 10 age-matched controls (11 to 20, red lettering) using a native MFA. Triplicates per sample were filtered. For immunoblotting, an anti-Arl8a/b antibody was used. b Quantification of protein aggregates retained on filter membrane in a was performed using Aida image analysis software. Data are expressed as mean ± SD. The statistical significance was assessed with an unpaired, two-tailed t-test (****, p < 0.0001). c Determination of Arl8b concentrations in CSF samples of 38 AD patients and 44 control individuals (Ctrl) using an ELISA. Data represent mean ± SD. Statistical significance was determined using an unpaired, two-tailed t-test (***, p = 0.0002). d Arl8b ELISA using CSF samples of 10 Huntington’s disease (HD) patients, 10 controls (Ctrl HD), 3 AD patients, and 3 controls (Ctrl AD). Data are mean ± SD. Statistical significance was evaluated using an unpaired, two-tailed t-test between HD and Ctrl HD, and AD and Ctrl AD groups (**, p = 0.0041). e ROC analysis of Arl8b levels derived from both AD patients and control individuals using GraphPad Prism software. The area under the curve (AUC) is 0.73 with a p-value of 0.0003

Similar articles

Cited by

References

    1. Theuns J, Van Broeckhoven C. Genes for Alzheimer dementia Acta neuropsychiatrica. 1999;11:60–62. - PubMed
    1. Bateman RJ, Xiong C, Benzinger TL, Fagan AM, Goate A, Fox NC, Marcus DS, Cairns NJ, Xie X, Blazey TM, et al. Clinical and biomarker changes in dominantly inherited Alzheimer's disease. N Engl J Med. 2012;367:795–804. doi: 10.1056/NEJMoa1202753. - DOI - PMC - PubMed
    1. Masters CL, Bateman R, Blennow K, Rowe CC, Sperling RA, Cummings JL. Alzheimer's disease. Nat Rev Dis Primers. 2015;1:15056. doi: 10.1038/nrdp.2015.56. - DOI - PubMed
    1. Zhu XC, Tan L, Wang HF, Jiang T, Cao L, Wang C, Wang J, Tan CC, Meng XF, Yu JT. Rate of early onset Alzheimer's disease: a systematic review and meta-analysis. Ann Transl Med. 2015;3:38. - PMC - PubMed
    1. Rahman MM, Lendel C. Extracellular protein components of amyloid plaques and their roles in Alzheimer's disease pathology. Mol Neurodegener. 2021;16:59. doi: 10.1186/s13024-021-00465-0. - DOI - PMC - PubMed

Publication types