

Lessons from discovery of true ADAR RNA editing sites in a human cell line
- PMID: 37468903
- PMCID: PMC10357658
- DOI: 10.1186/s12915-023-01651-w
Lessons from discovery of true ADAR RNA editing sites in a human cell line
Abstract
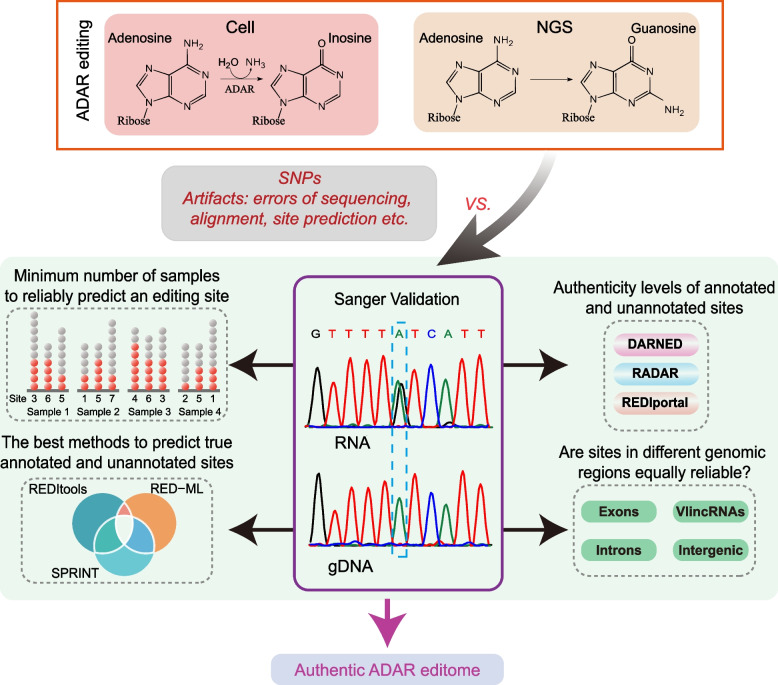
Background: Conversion or editing of adenosine (A) into inosine (I) catalyzed by specialized cellular enzymes represents one of the most common post-transcriptional RNA modifications with emerging connection to disease. A-to-I conversions can happen at specific sites and lead to increase in proteome diversity and changes in RNA stability, splicing, and regulation. Such sites can be detected as adenine-to-guanine sequence changes by next-generation RNA sequencing which resulted in millions reported sites from multiple genome-wide surveys. Nonetheless, the lack of extensive independent validation in such endeavors, which is critical considering the relatively high error rate of next-generation sequencing, leads to lingering questions about the validity of the current compendiums of the editing sites and conclusions based on them.
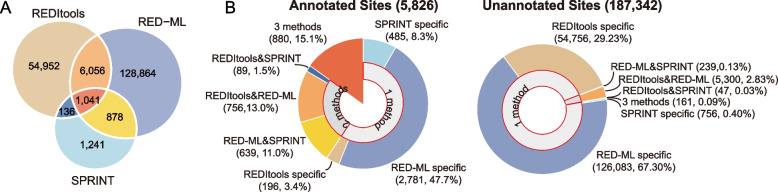
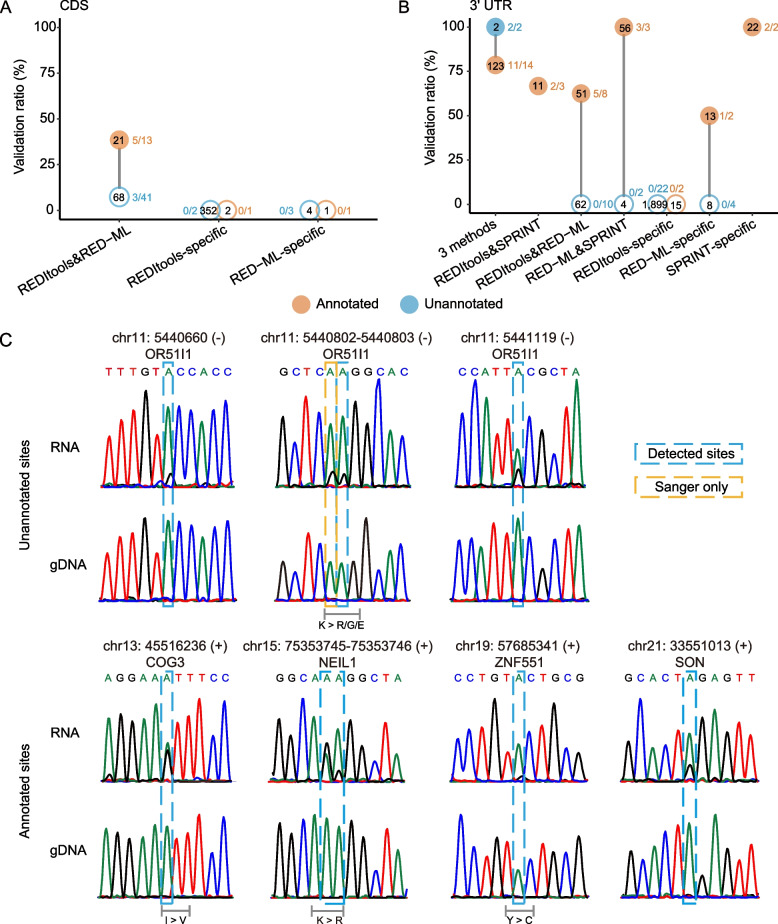
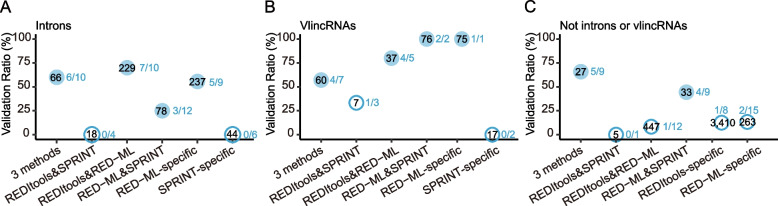
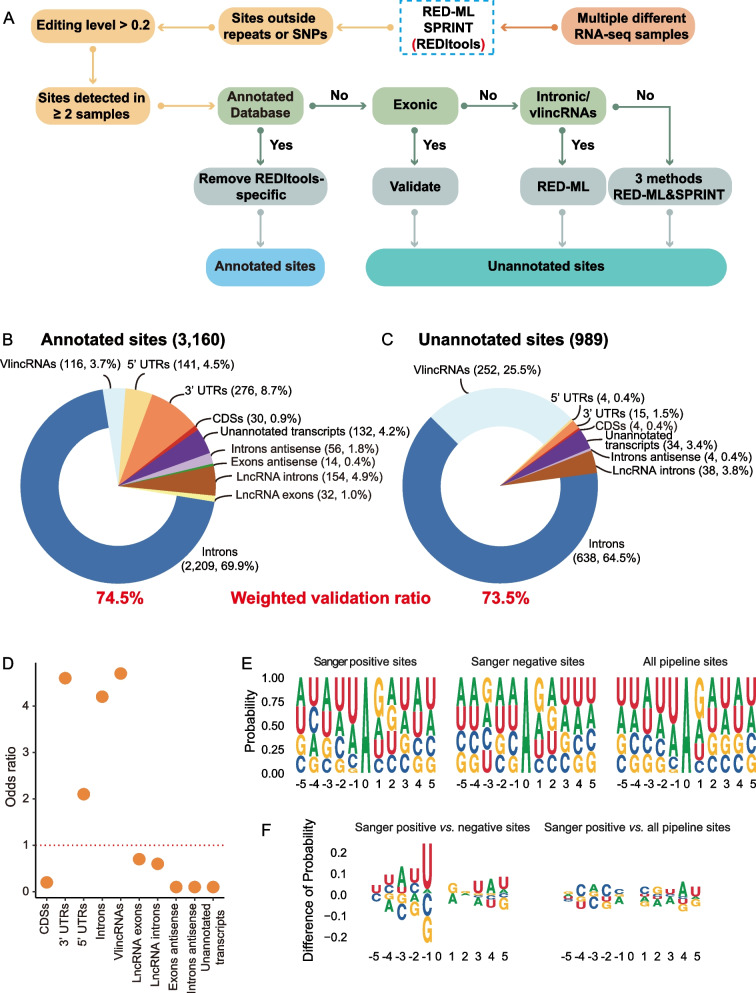
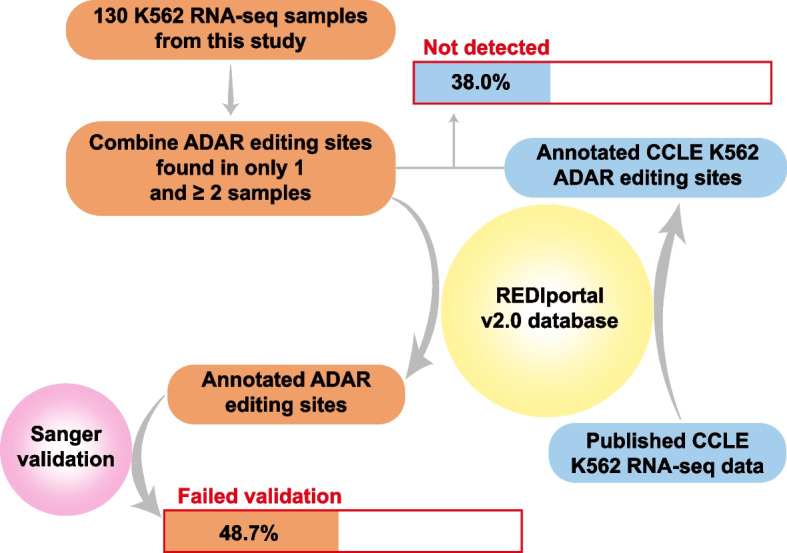
Results: Strikingly, we found that the current analytical methods suffer from very high false positive rates and that a significant fraction of sites in the public databases cannot be validated. In this work, we present potential solutions to these problems and provide a comprehensive and extensively validated list of A-to-I editing sites in a human cancer cell line. Our findings demonstrate that most of true A-to-I editing sites in a human cancer cell line are located in the non-coding transcripts, the so-called RNA 'dark matter'. On the other hand, many ADAR editing events occurring in exons of human protein-coding mRNAs, including those that can recode the transcriptome, represent false positives and need to be interpreted with caution. Nonetheless, yet undiscovered authentic ADAR sites that increase the diversity of human proteome exist and warrant further identification.
Conclusions: Accurate identification of human ADAR sites remains a challenging problem, particularly for the sites in exons of protein-coding mRNAs. As a result, genome-wide surveys of ADAR editome must still be accompanied by extensive Sanger validation efforts. However, given the vast number of unknown human ADAR sites, there is a need for further developments of the analytical techniques, potentially those that are based on deep learning solutions, in order to provide a quick and reliable identification of the editome in any sample.
Keywords: ADAR; Cancer; RNA dark matter; RNA editing; lncRNA; vlincRNA.
© 2023. The Author(s).
Conflict of interest statement
The authors declare that they have no competing interests.
Figures
Similar articles
-
Identification of Bona Fide RNA Editing Sites: History, Challenges, and Opportunities.Acc Chem Res. 2023 Nov 7;56(21):3033-3044. doi: 10.1021/acs.accounts.3c00462. Epub 2023 Oct 12. Acc Chem Res. 2023. PMID: 37827987
-
Global regulation of alternative splicing by adenosine deaminase acting on RNA (ADAR).RNA. 2013 May;19(5):591-604. doi: 10.1261/rna.038042.112. Epub 2013 Mar 8. RNA. 2013. PMID: 23474544 Free PMC article.
-
Diverse selective regimes shape genetic diversity at ADAR genes and at their coding targets.RNA Biol. 2015;12(2):149-61. doi: 10.1080/15476286.2015.1017215. RNA Biol. 2015. PMID: 25826567 Free PMC article.
-
All I's on the RADAR: role of ADAR in gene regulation.FEBS Lett. 2018 Sep;592(17):2860-2873. doi: 10.1002/1873-3468.13093. Epub 2018 May 25. FEBS Lett. 2018. PMID: 29770436 Free PMC article. Review.
-
To edit or not to edit: regulation of ADAR editing specificity and efficiency.Wiley Interdiscip Rev RNA. 2016 Jan-Feb;7(1):113-27. doi: 10.1002/wrna.1319. Epub 2015 Nov 26. Wiley Interdiscip Rev RNA. 2016. PMID: 26612708 Review.
Cited by
-
A Comprehensive Analysis of the Effect of A>I(G) RNA-Editing Sites on Genotoxic Drug Response and Progression in Breast Cancer.Biomedicines. 2024 Mar 25;12(4):728. doi: 10.3390/biomedicines12040728. Biomedicines. 2024. PMID: 38672084 Free PMC article.
-
RNA editing enzymes: structure, biological functions and applications.Cell Biosci. 2024 Mar 16;14(1):34. doi: 10.1186/s13578-024-01216-6. Cell Biosci. 2024. PMID: 38493171 Free PMC article. Review.
-
Integration of RNA Editing with Multiomics Data Improves Machine Learning Models for Predicting Drug Responses in Breast Cancer Patients.Res Sq [Preprint]. 2024 Dec 17:rs.3.rs-5604105. doi: 10.21203/rs.3.rs-5604105/v1. Res Sq. 2024. PMID: 39764127 Free PMC article. Preprint.
-
Harnessing ADAR-Mediated Site-Specific RNA Editing in Immune-Related Disease: Prediction and Therapeutic Implications.Int J Mol Sci. 2023 Dec 26;25(1):351. doi: 10.3390/ijms25010351. Int J Mol Sci. 2023. PMID: 38203521 Free PMC article. Review.
-
Zα and Zβ Localize ADAR1 to Flipons That Modulate Innate Immunity, Alternative Splicing, and Nonsynonymous RNA Editing.Int J Mol Sci. 2025 Mar 7;26(6):2422. doi: 10.3390/ijms26062422. Int J Mol Sci. 2025. PMID: 40141064 Free PMC article. Review.
References
Publication types
MeSH terms
Substances
LinkOut - more resources
Full Text Sources
Molecular Biology Databases
Research Materials
