

Quantifying metabolic activity of Ascaris suum L3 using resazurin reduction
- PMID: 37468906
- PMCID: PMC10357624
- DOI: 10.1186/s13071-023-05871-5
Quantifying metabolic activity of Ascaris suum L3 using resazurin reduction
Abstract
Background: Helminth infections are an important public health problem in humans and have an even greater impact on domestic animal and livestock welfare. Current readouts for anthelmintic drug screening assays are stage development, migration, or motility that can be subjective, laborious, and low in throughput. The aim of this study was to apply and optimize a fluorometric technique using resazurin for evaluating changes in the metabolic activity of Ascaris suum third-stage larvae (L3), a parasite of high economic relevance in swine.
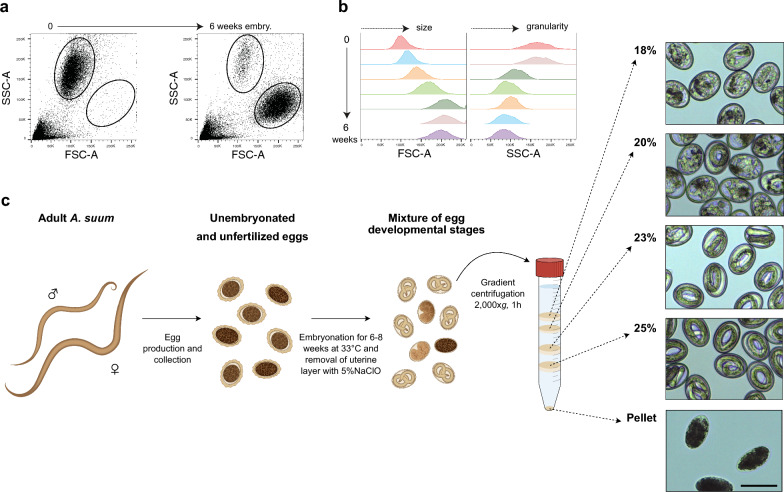
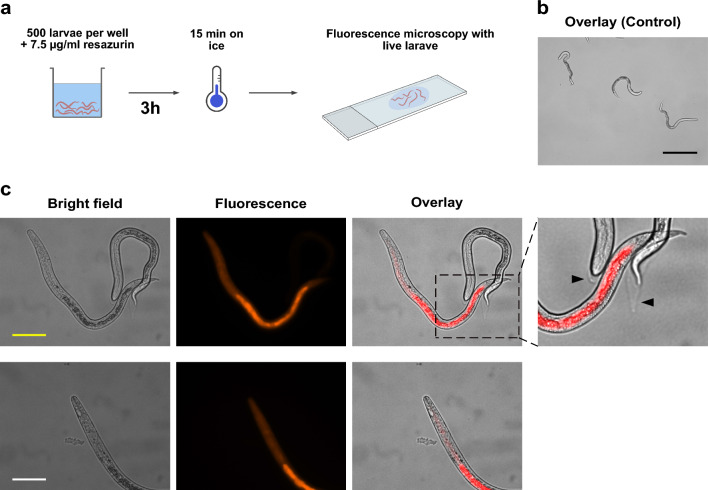
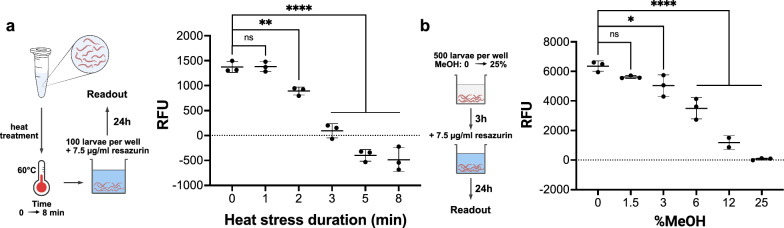
Methods: Ascaris suum L3 were mechanically hatched from 6- to 8-week embryonated and sucrose-gradient-enriched eggs. Resazurin dye and A. suum L3 were titrated in 96-well microtiter plates, and resazurin reduction activity was assessed by fluorometry after 24 h of incubation. Fluorescence microscopy was used to localize the resazurin reduction site within the larvae. Finally, we exposed A. suum L3 to various stress conditions including heat, methanol, and anthelmintics, and investigated their impact on larval metabolism through resazurin reduction activity.
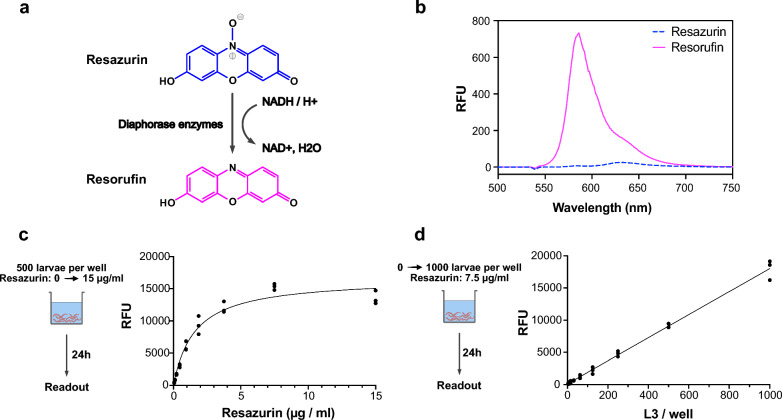
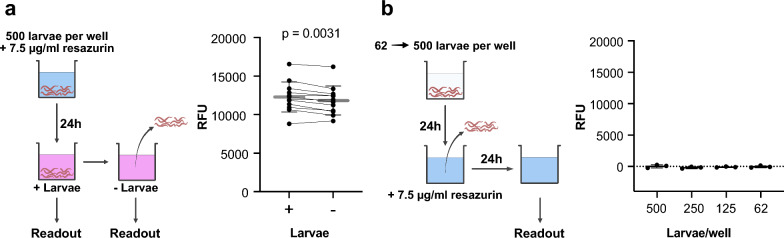
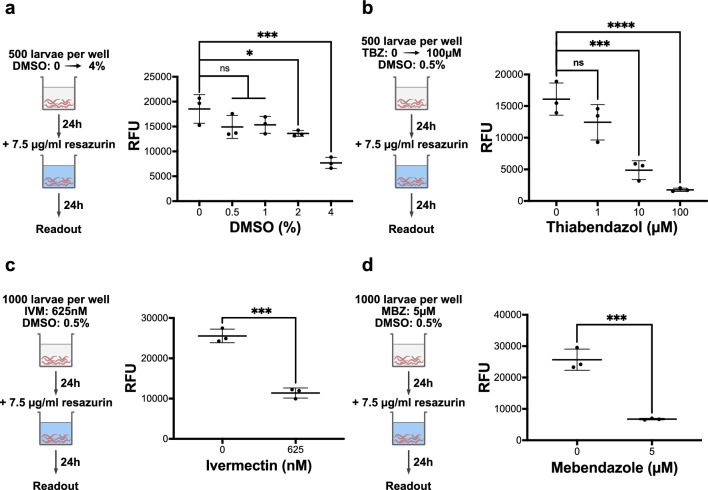
Results: We show that the non-fluorescent dye resazurin is reduced inside vital A. suum L3 to fluorescent resorufin and released into the culture media. Optimal assay parameters are 100-1000 L3 per well, a resazurin concentration of 7.5 µg/ml, and incubation at 37 °C/5% CO2 for 24 h. An intact L2 sheath around the L3 of A. suum completely prevents the uptake of resazurin, while in unsheathed L3, the most intense fluorescence signal is observed along the larval midgut. L3 exposed to methanol or heat show a gradually decreased resazurin reduction activity. In addition, 24 h exposure to ivermectin at 0.625 µM, mebendazole at 5 µM, and thiabendazole from 10 to 100 µM significantly decreased larval metabolic activity by 55%, 73%, and 70% to 89%, respectively.
Conclusions: Together, our results show that both metabolic stressors and anthelmintic drugs significantly and reproducibly reduce the resazurin reduction activity of A. suum L3, making the proposed assay a sensitive and easy-to-use method to evaluate metabolic activity of A. suum L3 in vitro.
Keywords: Anthelmintics; Ascaris suum; Drug screening assay; Larvae; Metabolic activity; Resazurin; Viability assay.
© 2023. The Author(s).
Conflict of interest statement
The authors declare that they have no competing interests.
Figures
Similar articles
-
Screen for anthelmintics, using larvae of Ascaris suum.Am J Vet Res. 1986 Apr;47(4):869-73. Am J Vet Res. 1986. PMID: 3963590
-
Effects of In Vivo and In Vitro Treatment of Ascaris suum Eggs with Anthelmintic Agents on Embryonation and Infectivity for Mice.J Parasitol. 2017 Oct;103(5):598-601. doi: 10.1645/17-21. Epub 2017 Jun 7. J Parasitol. 2017. PMID: 28590167
-
An in vitro larval migration assay for assessing anthelmintic activity of different drug classes against Ascaris suum.Vet Parasitol. 2017 Apr 30;238:43-48. doi: 10.1016/j.vetpar.2017.03.014. Epub 2017 Mar 18. Vet Parasitol. 2017. PMID: 28342672
-
Immune serum-activated human macrophages coordinate with eosinophils to immobilize Ascaris suum larvae.Parasite Immunol. 2020 Jul;42(7):e12728. doi: 10.1111/pim.12728. Epub 2020 May 25. Parasite Immunol. 2020. PMID: 32394439 Review.
-
Helminth parasites in pigs: new challenges in pig production and current research highlights.Vet Parasitol. 2011 Aug 4;180(1-2):72-81. doi: 10.1016/j.vetpar.2011.05.029. Epub 2011 May 27. Vet Parasitol. 2011. PMID: 21684689 Review.
Cited by
-
Larval ascariasis elicits a prominent IgA and IgG1/2 antibody response to adult Ascaris excretory/secretory antigens in pigs.Front Immunol. 2025 Jul 30;16:1606128. doi: 10.3389/fimmu.2025.1606128. eCollection 2025. Front Immunol. 2025. PMID: 40808955 Free PMC article.
-
Two-photon NAD(P)H-FLIM reveals unperturbed energy metabolism of Ascaris suum larvae, in contrast to host macrophages upon artemisinin derivatives exposure.Sci Rep. 2025 Jan 15;15(1):2056. doi: 10.1038/s41598-025-85780-y. Sci Rep. 2025. PMID: 39814779 Free PMC article.
-
Evaluation of copromicroscopy, multiplex-qPCR and antibody serology for monitoring of human ascariasis in endemic settings.PLoS Negl Trop Dis. 2024 Jun 18;18(6):e0012279. doi: 10.1371/journal.pntd.0012279. eCollection 2024 Jun. PLoS Negl Trop Dis. 2024. PMID: 38889190 Free PMC article.
-
Acute Ascaris infection impairs the effector functions of natural killer cells in single and Salmonella co-infected pigs.Sci Rep. 2024 Jun 25;14(1):14586. doi: 10.1038/s41598-024-64497-4. Sci Rep. 2024. PMID: 38918457 Free PMC article.
-
Ascaris suum infection in juvenile pigs elicits a local Th2 response in a setting of ongoing Th1 expansion.Front Immunol. 2024 May 10;15:1396446. doi: 10.3389/fimmu.2024.1396446. eCollection 2024. Front Immunol. 2024. PMID: 38799456 Free PMC article.
References
-
- Borgsteede FH, Gaasenbeek CP, Nicoll S, Domangue RJ, Abbott EM. A comparison of the efficacy of two ivermectin formulations against larval and adult Ascaris suum and Oesophagostomum dentatum in experimentally infected pigs. Vet Parasitol. 2007;146:288–293. doi: 10.1016/j.vetpar.2007.02.027. - DOI - PubMed
-
- Chavhan PB, Bodkhe AM, Majed MA, Bobde SP, Khan LA, Suryawanshi PR, et al. Efficacy of Ivermectin against Ascaris suum in Swine. Veterinary World. 2009;2:228–228.
MeSH terms
Substances
Grants and funding
LinkOut - more resources
Full Text Sources
Miscellaneous
