. 2023 Jul 19;18(1):48.
doi: 10.1186/s13024-023-00638-z.

Quantitative proteomics of cerebrospinal fluid from African Americans and Caucasians reveals shared and divergent changes in Alzheimer's disease

Affiliations

Quantitative proteomics of cerebrospinal fluid from African Americans and Caucasians reveals shared and divergent changes in Alzheimer's disease

Erica S Modeste et al. Mol Neurodegener. .

Abstract

Background: Despite being twice as likely to get Alzheimer's disease (AD), African Americans have been grossly underrepresented in AD research. While emerging evidence indicates that African Americans with AD have lower cerebrospinal fluid (CSF) levels of Tau compared to Caucasians, other differences in AD CSF biomarkers have not been fully elucidated. Here, we performed unbiased proteomic profiling of CSF from African Americans and Caucasians with and without AD to identify both common and divergent AD CSF biomarkers.

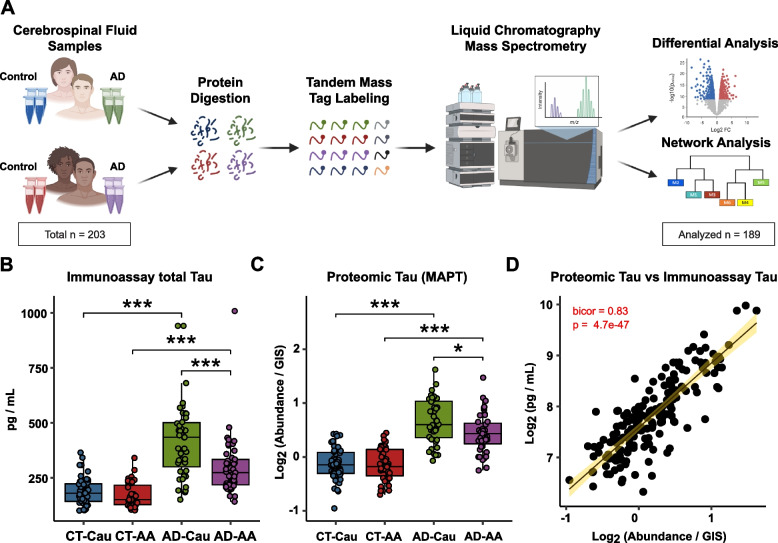
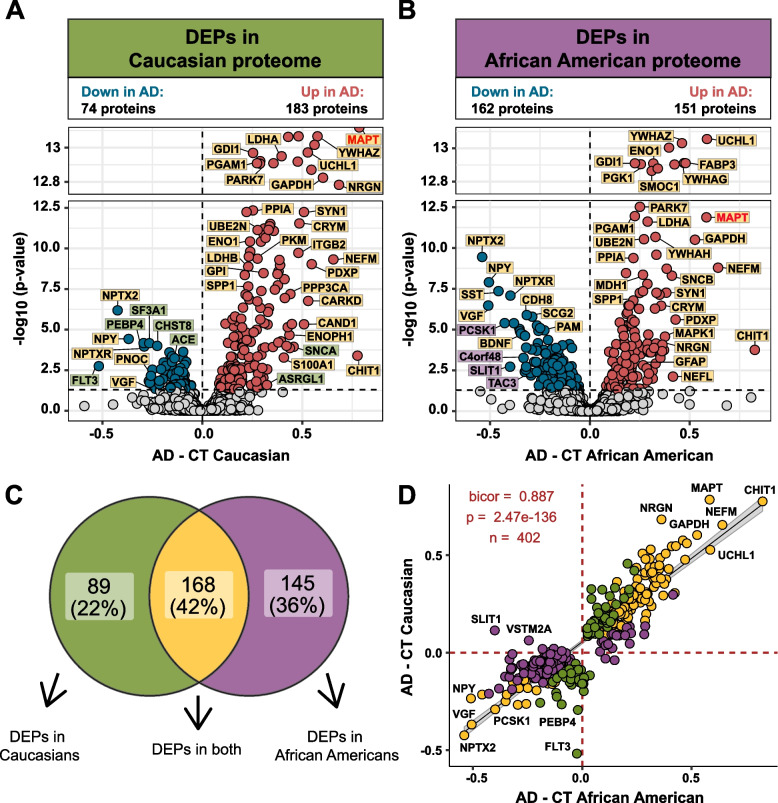
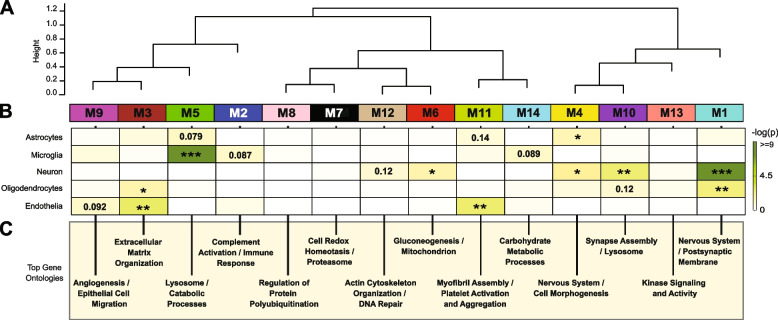
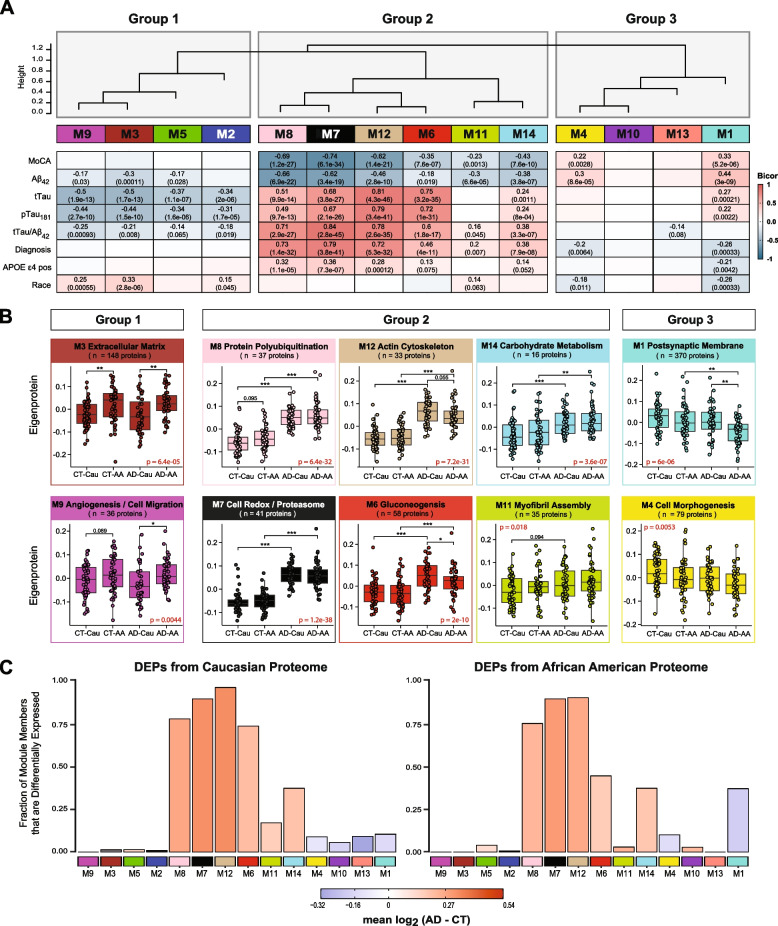
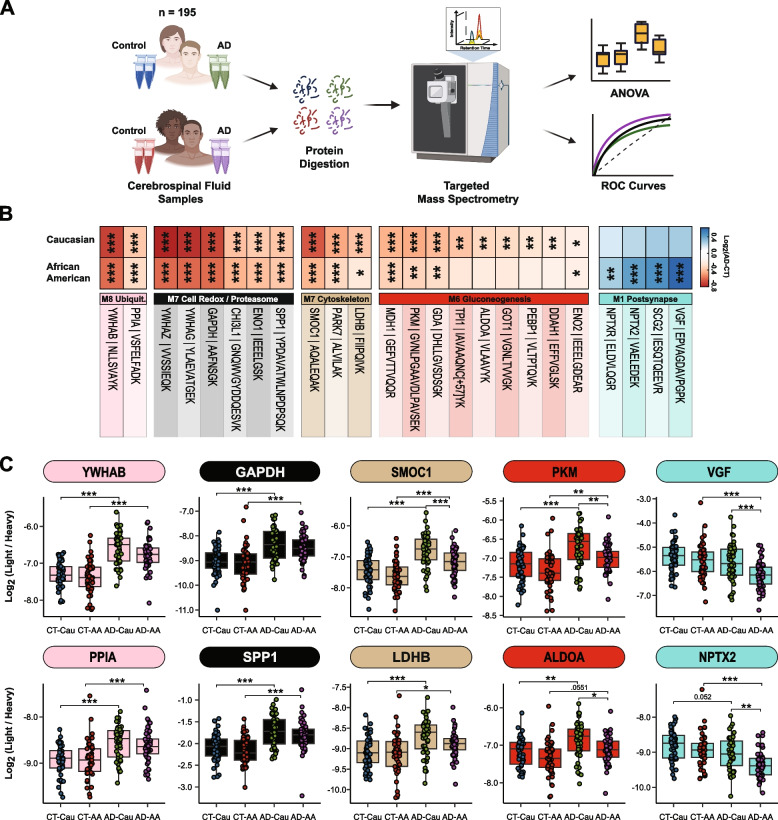
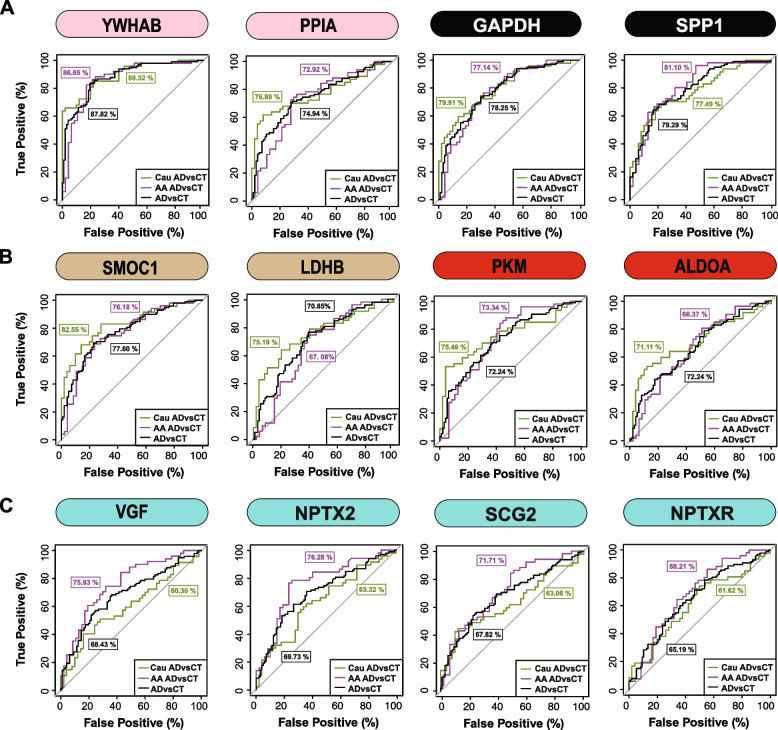
Methods: Multiplex tandem mass tag-based mass spectrometry (TMT-MS) quantified 1,840 proteins from 105 control and 98 AD patients of which 100 identified as Caucasian while 103 identified as African American. We used differential protein expression and co-expression approaches to assess how changes in the CSF proteome are related to race and AD. Co-expression network analysis organized the CSF proteome into 14 modules associated with brain cell-types and biological pathways. A targeted mass spectrometry method, selected reaction monitoring (SRM), with heavy labeled internal standards was used to measure a panel of CSF module proteins across a subset of African Americans and Caucasians with or without AD. A receiver operating characteristic (ROC) curve analysis assessed the performance of each protein biomarker in differentiating controls and AD by race.

Results: Consistent with previous findings, the increase of Tau levels in AD was greater in Caucasians than in African Americans by both immunoassay and TMT-MS measurements. CSF modules which included 14-3-3 proteins (YWHAZ and YWHAG) demonstrated equivalent disease-related elevations in both African Americans and Caucasians with AD, whereas other modules demonstrated more profound disease changes within race. Modules enriched with proteins involved with glycolysis and neuronal/cytoskeletal proteins, including Tau, were more increased in Caucasians than in African Americans with AD. In contrast, a module enriched with synaptic proteins including VGF, SCG2, and NPTX2 was significantly lower in African Americans than Caucasians with AD. Following SRM and ROC analysis, VGF, SCG2, and NPTX2 were significantly better at classifying African Americans than Caucasians with AD.

Conclusions: Our findings provide insight into additional protein biomarkers and pathways reflecting underlying brain pathology that are shared or differ by race.

Keywords: Amyloid; Biomarkers; CSF; Proteomics; Race; Tau.


Conflict of interest statement

A.I.L, N.T.S. and D.M.D. are co-founders of Emtherapro Inc.

Figures

Fig. 1
Fig. 1
Schematic of experimental workflow and correlation between proteomic Tau and total Tau immunoassay measurements. A Schematic of experimental workflow for quantification of cerebrospinal fluid proteome. B Total Tau levels as measured by Roche Elecsys Platform between control (CT) and AD cases and stratified by self-identified race: Caucasian (Cau) or African American (AA) C Tau levels measured by mass spectrometry. One-way ANOVA with Tukey post-hoc correction determined pairwise relationships D Correlation of Tau levels by TMT-MS (x-axis) to paired immunoassay total Tau levels (y-axis). Biweight midcorrelation coefficient (bicor) with associated p-value is shown. Only 179 cases were included in the linear regression analysis because of sample outlier removal and missing values in the TMT-MS
Fig. 2
Fig. 2
Differential expression of Caucasian and African American CSF proteomes in AD. Volcano plot displaying the log2 fold change (FC) (x-axis) against one-way ANOVA with Tukey correction derived -log10 p-value (y-axis) for all proteins (n = 1840) comparing AD versus controls for Caucasians A and African Americans B. Cutoffs were determined by significant differential expression (p < 0.05) between control (CT) and AD cases. Proteins with significantly decreased levels in AD are shown in blue while proteins with significantly increased levels in disease were indicated in red. Select proteins were denoted and labeled by whether they were differentially expressed in both proteomes (yellow), in only the Caucasian proteome (green), or in only the African American proteome (purple). C Venn diagram illustrating the number of differentially expressed proteins (DEPs) that were uniquely changed in one proteome (green or purple) or changed in both proteomes (yellow) D The correlation between the fold change of all DEPs (n = 402) across the African American proteome (x-axis) and the Caucasian proteome (y-axis) were strongly correlated (bicor = 0.887, p = 2.47e-136), regardless of whether the DEP was significant in one (green or purple) or both proteomes (yellow)
Fig. 3
Fig. 3
Network analysis classifies the CSF proteome into modules associated with specific brain cell-types and gene ontologies. A Weighted Gene Co-expression Network Analysis cluster dendrogram groups proteins (n = 1840) into 14 distinct protein modules (M1-M14). B Cell-type enrichment was assessed by cross referencing module proteins by matching gene symbols using a one-tailed Fisher’s exact test against a list of proteins determined to be enriched in neurons, oligodendrocytes, astrocytes, microglia and endothelia. The degree of cell-type enrichment increases from yellow to dark green with asterisks denoting the following statistical significance (*p ≤ 0.05; **p ≤ 0.01; ***p ≤ .001). C Top gene ontology (GO) terms were selected from significant GO annotations
Fig. 4
Fig. 4
CSF protein modules correlate to race and clinicopathological phenotypes of AD. A Modules were clustered based on relatedness defined by correlation of protein co‐expression eigenproteins (indicated by position in height). There were three main clusters in the network: Groups 1, 2 and 3. Biweight midcorrelation (bicor) analysis of module eigenprotein levels with diagnostic measures of AD, including MoCA score, immunoassay Amyloid-beta1-42 (Aβ42), total Tau (tTau), phosphorylated Tau181 (pTau181), ratio measures of tTau/Aβ42, diagnosis, whether the sample has APOE ε4 allele or not, and race. The strength of positive (red) and negative (blue) correlations are shown by a heatmap with annotated bicor correlations and associated p-values. B Eigenprotein values distributed by race and diagnosis of representative modules for each cluster. C Differentially expressed proteins (DEPs) from AD samples compared to controls, by module with Caucasian proteome on the left and African Americans on the right. The height of the bars represents the fraction of module member proteins that were also DEPs compared to controls. The bars are color coded by heatmap for average log2 difference in abundance, where red represents an increase in abundance in AD, and blue represents a decrease in abundance in AD
Fig. 5
Fig. 5
Validation of shared and divergent CSF protein levels across AD and race. A Schematic of experimental workflow for SRM analysis of cerebrospinal fluid proteome B Heatmap of peptides that were significantly differentially expressed between control and AD Caucasians or African Americans. Stars are indicative of the level of significant difference (*p ≤ 0.05; **p ≤ 0.01; ***p ≤ 0.001) seen for each peptide between AD and control within each race. Meanwhile the colors are indicative of the log2 fold change (FC) of each peptide from control and AD for each race where blue is indicative of the degree of decrease and shade of red is indicative of the degree of increase. C Log2 abundance of peptides that mapped to modules of interest distributed by race and diagnosis. Pairwise significance was calculated using one-way ANOVA with Tukey adjustment
Fig. 6
Fig. 6
ROC analysis to evaluate CSF protein classification of AD by race. A YWHAB, PPIA, GAPDH, and SPP1 had similar performance in classifying Caucasians and African Americans with AD B SMOC1, LDHB, PKM and ALDOA showed modest improvement in the AUC for Caucasians with AD compared to African Americans with AD C VGF, SCG2, and NPTX2 were better classifiers for AD in African Americans compared to Caucasians, whereas NPTXR showed modest improvement in classification of AD in African Americans. All protein AUCs with p-values and confidence internals (CI) are provided in Supplemental Table 15

References

    1. Rajan KB, Weuve J, Barnes LL, Wilson RS, Evans DA. Prevalence and incidence of clinically diagnosed Alzheimer's disease dementia from 1994 to 2012 in a population study. Alzheimers Dement. 2019;15:1–7. doi: 10.1016/j.jalz.2018.07.216. - DOI - PMC - PubMed
    1. Potter GG, Plassman BL, Burke JR, Kabeto MU, Langa KM, Llewellyn DJ, et al. Cognitive performance and informant reports in the diagnosis of cognitive impairment and dementia in African Americans and whites. Alzheimers Dement. 2009;5:445–453. doi: 10.1016/j.jalz.2009.04.1234. - DOI - PMC - PubMed
    1. Gurland BJ, Wilder DE, Lantigua R, Stern Y, Chen J, Killeffer EH, et al. Rates of dementia in three ethnoracial groups. Int J Geriatr Psychiatry. 1999;14:481–493. doi: 10.1002/(SICI)1099-1166(199906)14:6<481::AID-GPS959>3.0.CO;2-5. - DOI - PubMed
    1. Glymour MM, Manly JJ. Lifecourse social conditions and racial and ethnic patterns of cognitive aging. Neuropsychol Rev. 2008;18:223–254. doi: 10.1007/s11065-008-9064-z. - DOI - PubMed
    1. Lines L, Sherif N, Wiener J. Racial and ethnic disparities among individuals with Alzheimer’s disease in the United States: A literature review RTI Press. 2014 doi: 10.3768/rtipress.2014.RR.0024.1412. - DOI

Publication types