. 2023 Sep;10(27):e2301190.
doi: 10.1002/advs.202301190. Epub 2023 Jul 19.

PUM1 Promotes Tumor Progression by Activating DEPTOR-Meditated Glycolysis in Gastric Cancer

Affiliations

PUM1 Promotes Tumor Progression by Activating DEPTOR-Meditated Glycolysis in Gastric Cancer

Songcheng Yin et al. Adv Sci (Weinh). 2023 Sep.

Abstract

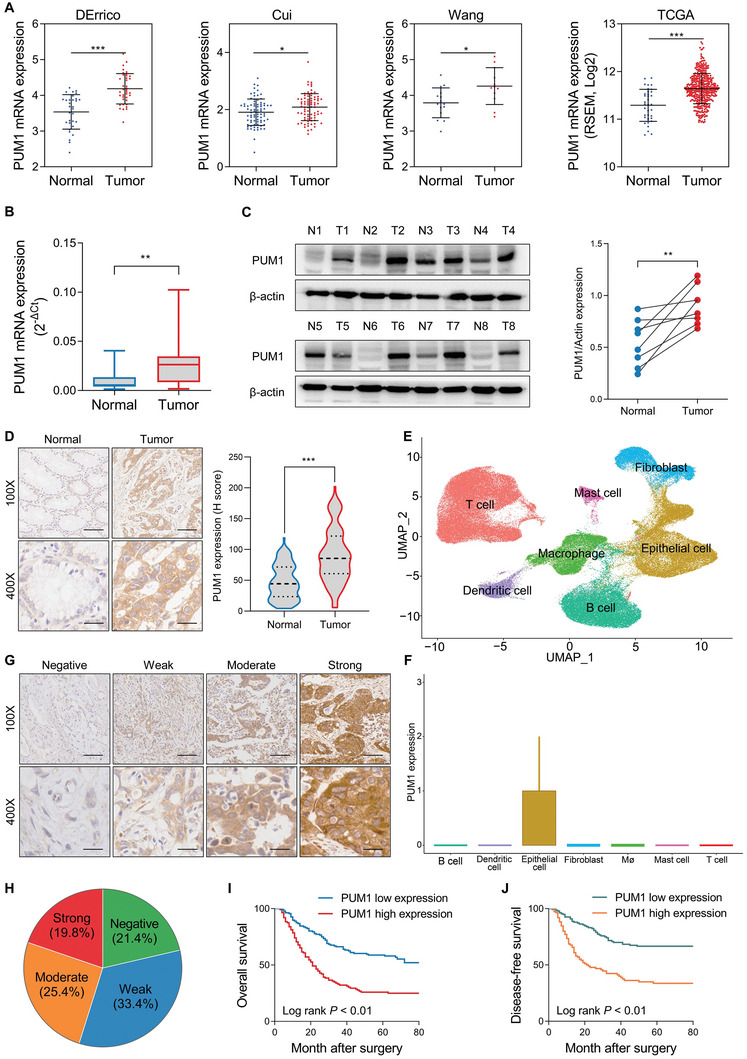
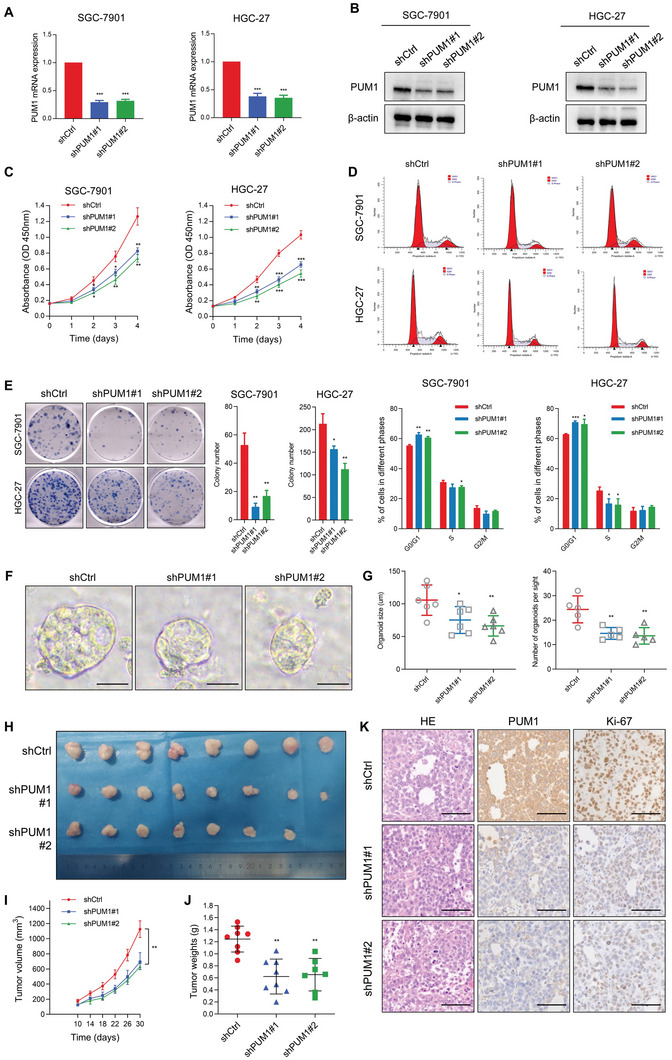
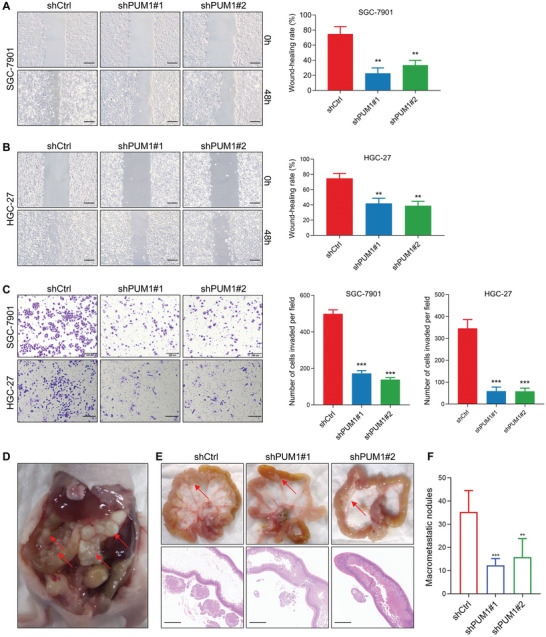
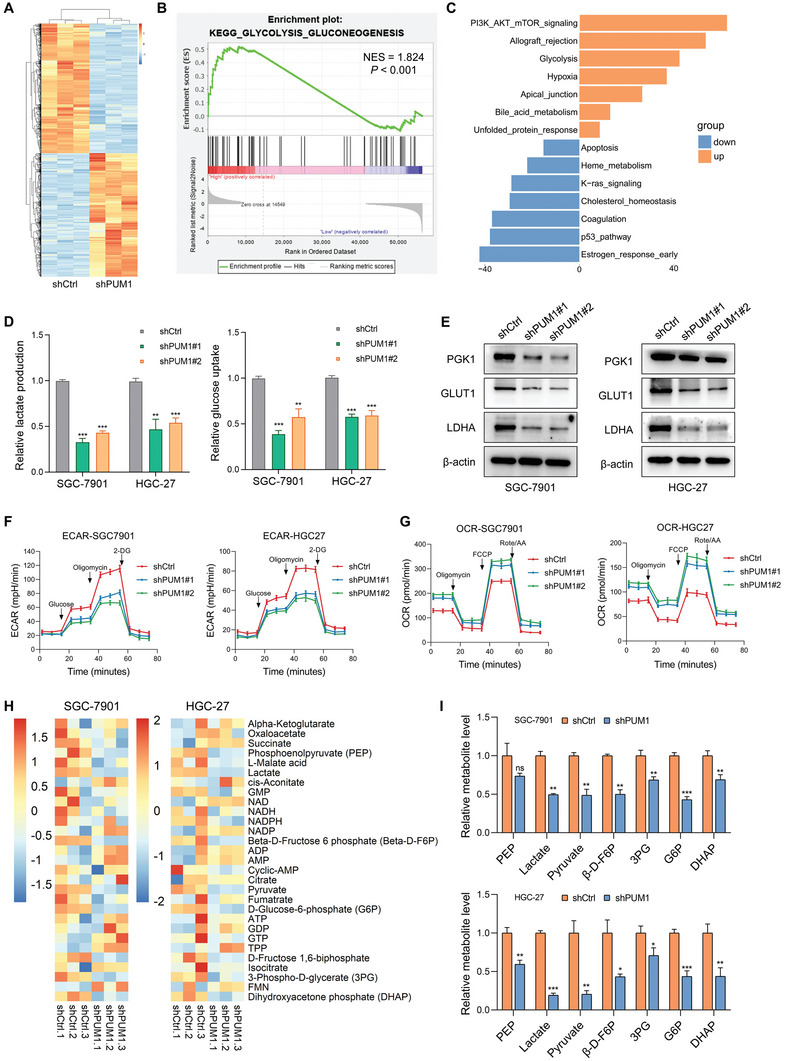
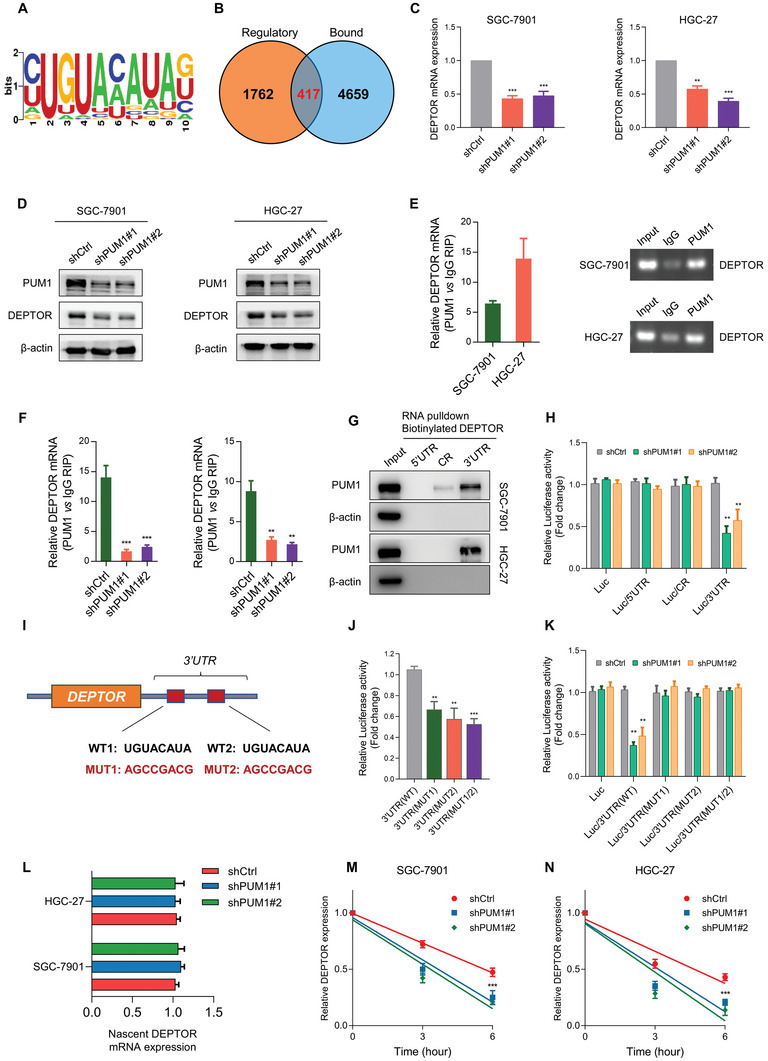
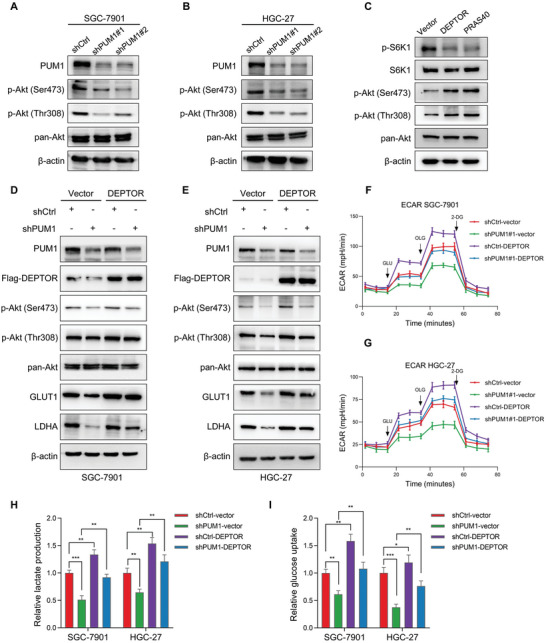
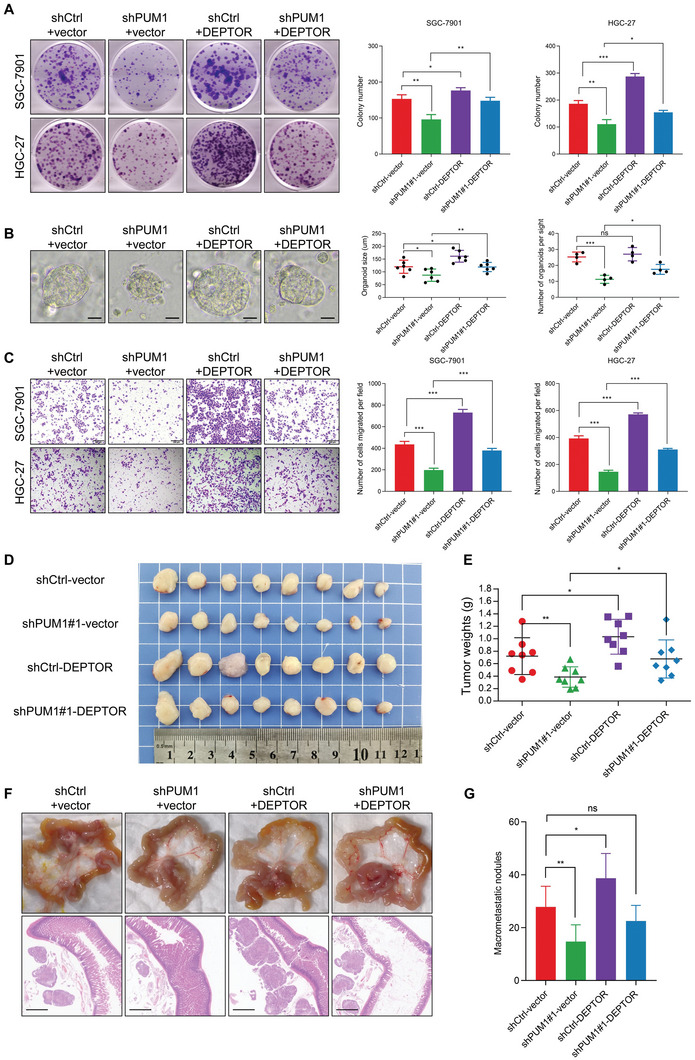
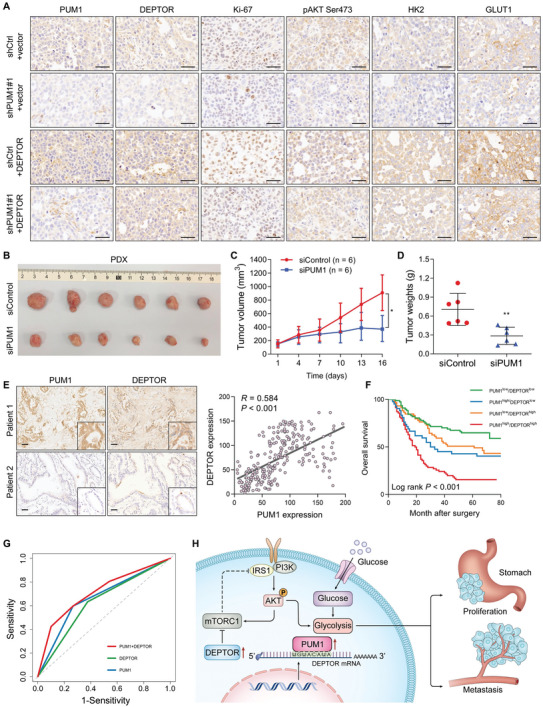
RNA-binding proteins (RBPs) play essential roles in tumorigenesis and progression, but their functions in gastric cancer (GC) remain largely elusive. Here, it is reported that Pumilio 1 (PUM1), an RBP, induces metabolic reprogramming through post-transcriptional regulation of DEP domain-containing mammalian target of rapamycin (mTOR)-interacting protein (DEPTOR) in GC. In clinical samples, elevated expression of PUM1 is associated with recurrence, metastasis, and poor survival. In vitro and in vivo experiments demonstrate that knockdown of PUM1 inhibits the proliferation and metastasis of GC cells. In addition, RNA-sequencing and bioinformatics analyses show that PUM1 is enriched in the glycolysis gene signature. Metabolomics studies confirm that PUM1 deficiency suppresses glycolytic metabolism. Mechanistically, PUM1 binds directly to DEPTOR mRNA pumilio response element to maintain the stability of the transcript and prevent DEPTOR degradation through post-transcriptional pathway. PUM1-mediated DEPTOR upregulation inhibits mTORC1 and alleviates the inhibitory feedback signal transmitted from mTORC1 to PI3K under normal conditions, thus activating the PI3K-Akt signal and glycolysis continuously. Collectively, these results reveal the critical epigenetic role of PUM1 in modulating DEPTOR-dependent GC progression. These conclusions support further clinical investigation of PUM1 inhibitors as a metabolic-targeting treatment strategy for GC.

Keywords: DEPTOR; PI3K-Akt pathway; PUM1; gastric cancer; glycolysis.


Conflict of interest statement

The authors declare no conflict of interest. All these study sponsors have no roles in the study design, in the collection, analysis and interpretation of data.

Figures

Figure 1
Figure 1
PUM1 is upregulated in GC and predicts poor prognosis. A) Expression difference of PUM1 between GC and normal tissues in the Oncomine platform and TCGA database. B) The mRNA expression levels of PUM1 in GC tissues and corresponding normal gastric tissues were detected by qRT‐PCR (n = 22). C) PUM1 protein levels in fresh GC and adjacent normal tissues detection by western blot (n = 8). D) Representative IHC images of PUM1 in GC tissue (n = 120) and corresponding normal tissue (n = 120). Scale bar, 100 µm. The corresponding IHC scores (H‐score) was compared on the right. E) Uniform manifold approximation and projection (UMAP) plots showed seven different cell types from GC single‐cell sequencing data GSE183904. F) PUM1 expression levels in different cell types were obtained from single‐cell sequencing data. G) Representative IHC images of PUM1 expression negative, weakly positive, moderately positive, and strongly positive in GC patients (n = 248). H) Proportion of different expression levels of PUM1 in GC patients. I,J) Kaplan–Meier analysis of overall survival (OS) or disease‐free survival (DFS) curves after having assigned GC patients to high/low of PUM1 expression subgroups. *, P < 0.05; **, P < 0.01; and ***, P < 0.001.
Figure 2
Figure 2
PUM1 deficiency inhibits GC proliferation in vitro and in vivo. A,B) Quantitative RT‐PCR and western blotting for PUM1 expression indicated in GC cell lines with stable PUM1 knockdown. C) Cell proliferation after knocking down PUM1 in SGC‐7901 and HGC‐27 cells determined by CCK‐8. D) Flow cytometric analysis of cell cycle on the 7th day after transfection of shPUM1s. E) Representative pictures of tumor plate cloning and statistics of colony counts of indicated cells. F) Representative image of organoid formation assay after knocking down PUM1. Scale bar, 50 µm. G) Statistics of diameter and number of organoids. H) Photograph of dissected subcutaneous xenografts (n = 8 per group). I) Growth curve of tumors in mice after subcutaneous xenografting using the indicated stable cell lines. J) Comparison of tumor weight of each group at last time point. K) Representative HE staining and IHC results of PUM1 and Ki‐67 in xenografted tumors. Scale bar, 100 µm. Data represent mean ± SD of three independent experiments. Error bars indicate mean ± SD. *, P < 0.05; **, P < 0.01; and ***, P < 0.001.
Figure 3
Figure 3
PUM1 is required for tumor metastasis, invasion, and peritoneal dissemination of GC. A,B) Microscopic images and quantification of indicated cells in the wound‐healing migration assays. Scale bar, 100 µm. C) Microscopic images and quantification of the invasiveness of the indicated cells in the Transwell matrix penetration assays. Scale bar, 200 µm. D) SGC‐7901 cells expressing control or PUM1 shRNAs were injected intraperitoneally and metastatic nodules in the colonic wall were recorded 6 weeks later. E) Representative macroscopic and microscopic HE staining images of mesenteric metastatic nodules (arrows). Scale bar, 1 mm. F) Statistical analysis of macroscopic metastatic nodules (n = 7 per group). Error bars indicate means ± SD. **, P < 0.01; *** and P < 0.001.
Figure 4
Figure 4
PUM1 positively regulates glycolysis in GC. A) Heatmap of all differential genes in SGC‐7901 cells that stably express shRNAs targeting PUM1 or scramble control. B) GSEA analysis showed that differentially expressed genes were mainly enriched in glycolysis pathway. C) GSVA analysis between PUM1‐high and low groups. D) Relative lactate production and glucose uptake of indicated cells transfected with PUM1 shRNAs or scramble control. E) Western blotting shows changes in the expression levels of glycolytic proteins PGK1, GLUT1, and LDHA by PUM1 knockdown or control cells. F,G) ECAR and OCR of indicated cells transfected with PUM1 shRNAs or scramble control were measured with seahorse. H) Heatmap of differential metabolites in PUM1 deficiency and control GC cells. I) Major metabolites altered in the glycolytic pathway in PUM1 deficiency and control GC cells. Error bars indicate means ± SD. *, P < 0.05; **, P < 0.01; and ***, P < 0.001.
Figure 5
Figure 5
DEPTOR is a binding and regulation target of PUM1. A) Sequence logo for PUM1 binding motif. B) Differential expressed genes (DEGs) in RNA sequencing data were defined as potential regulatory group. Genes containing a PUM1‐binding motif were defined as the potential binding group. Overlap between the “Regulatory” and “Bound” datasets was shown. C) Quantitative RT‐PCR analysis showing changes in RNA levels of DEPTOR expression in indicated GC cell lines with PUM1 knockdown or scramble control. D) Western blotting showing changes in protein levels of DEPTOR expression by PUM1 knockdown or control cells. E) RIP was carried out with cell lysates using PUM1 antibody, with RT‐PCR (left) and agarose electrophoresis (right) used to determine DEPTOR mRNA enrichment. F) RIP–qRT‐PCR shows enriched DEPTOR in indicated cells after inhibiting PUM1. G) Biotinylated RNA segments of DEPTOR mRNA (5′UTR, CR, and 3′UTR) were used to pull down lysates from indicated cells. RNA pulldown materials were detected by western blotting, with the use of PUM1 antibody. H) Relative luciferase activity was detected and normalized by Renilla activity in indicated groups of SGC‐7901 cells. I) Schematic diagram of PUM1‐binding motifs (wild‐type, WT) and corresponding mutations (MUT) on DEPTOR mRNA 3′UTR. J) Relative luciferase activity was analyzed in SGC‐7901 cells transfected with wild‐type or mutant DEPTOR 3′UTR luciferase reporter vector. K) Relative luciferase activity was analyzed in PUM1 knockdown or control SGC‐7901 cells transfected with wild‐type or mutant DEPTOR 3′UTR luciferase reporter vector. L) Nascent synthesized DEPTOR mRNA was labeled and detected by qRT‐PCR in indicated cells. M,N) Actinomycin D (4 µg mL−1) was used to treat PUM1 knockdown or control SGC‐7901 and HGC‐27 cells. The attenuation of DEPTOR mRNA was detected by qRT‐PCR at 0, 3, and 6 h after actinomycin D treatment. Error bars indicate means ± SD. **, P < 0.01 and ***, P < 0.001.
Figure 6
Figure 6
PUM1 regulates PI3K–Akt signaling pathway and glycolysis through DEPTOR. A,B) Western blot detected the changes in pan‐Akt and phosphorylated Akt (p‐Akt) levels in SGC‐7901 and HGC‐27 cells with PUM1 knockdown or scramble control. C) DEPTOR or PRAS40 was overexpressed in SGC‐7901 cells and protein levels of S6K1, phosphorylated S6K1, phosphorylated Akt, and pan‐Akt were detected by western blotting. D,E) Western blotting of p‐Akt, pan‐Akt, GLUT1, and LDHA in PUM1 knockdown SGC‐7901 and HGC‐27 cells after transfection with DEPTOR constructs or empty vector control. F,G) ECAR values of SGC‐7901 and HGC‐27 cells as described above were detected by seahorse. H,I) Relative lactate production and glucose uptake of SGC‐7901 and HGC‐27 cells as described above. Error bars indicate means ± SD. *, P < 0.05; **, P < 0.01; and ***, P < 0.001.
Figure 7
Figure 7
PUM1–DEPTOR–Akt axis contributes to GC progression. A) Representative images of clone formation and statistics of colony counts in PUM1 knockdown SGC‐7901 and HGC‐27 cells after transfection with DEPTOR constructs or empty vector. B) Representative image and statistics of diameter and number of organoids. Scale bar, 50 µm. C) Microscopic images and quantification of the invasiveness of SGC‐7901 and HGC‐27 cells as described above. D) Subcutaneous xenografted SGC‐7901 cells expressing PUM1 shRNAs and/or DEPTOR constructs. The image of dissected subcutaneous xenografts (n = 8 per group). E) Comparison of tumor weight of each group at last time point. F) Intraperitoneal injected SGC‐7901 cells expressing PUM1 shRNAs and/or DEPTOR constructs. Representative macroscopic and microscopic HE staining images of mesenteric metastatic nodules. Scale bar, 1 mm. G) Statistical analysis of macroscopic metastatic nodules (n = 7 per group). Error bars indicate means ± SD. **, P < 0.01 and ***, P < 0.001.
Figure 8
Figure 8
Clinical value of PUM1–DEPTOR–Akt axis in GC. A) Representative IHC staining of PUM1, DEPTOR, Ki‐67, p‐Akt, HK2, and GLUT1 in xenografted tumors. Scale bar, 50 µm. B) Photograph of the excised tumors from PDX model after intratumoral injection of siPUM1 or the control (n = 6 per group). C) The tumor growth analysis of PDX model with siControl or siPUM1 treatment. D) Comparison of tumor weight at last time point with siControl or siPUM1 treatment. E) Representative images of PUM1 and DEPTOR IHC staining in 248 GC patient specimens. Scale bar, 100 µm. Right: correlational analyses highlighted a significant link between PUM1 and DEPTOR expression in patient specimens (Pearson correlation, R = 0.584). F) Kaplan–Meier analysis of overall survival of PUM1 and DEPTOR combinations in our cohort. G) Receiver operating characteristic (ROC) curve analysis of PUM1 (area under a curve AUC = 0.665) or DEPTOR (AUC = 0.628) single scoring or combinational scoring (AUC = 0.713). H) Schematic diagram of PUM1 regulating GC progression via DEPTOR.

Similar articles

Cited by

References

    1. Sung H., Ferlay J., Siegel R. L., Laversanne M., Soerjomataram I., Jemal A., Bray F., CA Cancer J. Clin. 2021, 71, 209. - PubMed
    1. Songun I., Putter H., Kranenbarg E. M., Sasako M., van de Velde C. J., Lancet Oncol. 2010, 11, 439. - PubMed
    1. Wilke H., Muro K., Van Cutsem E., Oh S. C., Bodoky G., Shimada Y., Hironaka S., Sugimoto N., Lipatov O., Kim T. Y., Cunningham D., Rougier P., Komatsu Y., Ajani J., Emig M., Carlesi R., Ferry D., Chandrawansa K., Schwartz J. D., Ohtsu A., Group R. S., Lancet Oncol. 2014, 15, 1224. - PubMed
    1. Smalley S. R., Benedetti J. K., Haller D. G., Hundahl S. A., Estes N. C., Ajani J. A., Gunderson L. L., Goldman B., Martenson J. A., Jessup J. M., Stemmermann G. N., Blanke C. D., Macdonald J. S., J. Clin. Oncol. 2012, 30, 2327. - PMC - PubMed
    1. Janjigian Y. Y., Shitara K., Moehler M., Garrido M., Salman P., Shen L., Wyrwicz L., Yamaguchi K., Skoczylas T., Campos Bragagnoli A., Liu T., Schenker M., Yanez P., Tehfe M., Kowalyszyn R., Karamouzis M. V., Bruges R., Zander T., Pazo‐Cid R., Hitre E., Feeney K., Cleary J. M., Poulart V., Cullen D., Lei M., Xiao H., Kondo K., Li M., Ajani J. A., Lancet 2021, 398, 27. - PMC - PubMed

Publication types

MeSH terms

Substances

LinkOut - more resources