

Super-resolution microscopy reveals focal organization of ER-associated Y-complexes in mitosis
- PMID: 37469276
- PMCID: PMC10481662
- DOI: 10.15252/embr.202356766
Super-resolution microscopy reveals focal organization of ER-associated Y-complexes in mitosis
Abstract
During mitotic entry of vertebrate cells, nuclear pore complexes (NPCs) are rapidly disintegrated. NPC disassembly is initiated by hyperphosphorylation of linker nucleoporins (Nups), which leads to the dissociation of FG repeat Nups and relaxation of the nuclear permeability barrier. However, less is known about disintegration of the huge nuclear and cytoplasmic rings, which are formed by annular assemblies of Y-complexes that are dissociated from NPCs as intact units. Surprisingly, we observe that Y-complex Nups display slower dissociation kinetics compared with other Nups during in vitro NPC disassembly, indicating a mechanistic difference in the disintegration of Y-based rings. Intriguingly, biochemical experiments reveal that a fraction of Y-complexes remains associated with mitotic ER membranes, supporting recent microscopic observations. Visualization of mitotic Y-complexes by super-resolution microscopy demonstrates that they form two classes of higher order assemblies: large clusters at kinetochores and small, focal ER-associated assemblies. These, however, lack features qualifying them as persisting ring-shaped subassemblies previously proposed to serve as structural templates for NPC reassembly during mitotic exit, which helps to refine current models of nuclear reassembly.
Keywords: NPC disassembly; Y-complex; mitosis; nuclear pore complex; nucleoporin.
© 2023 The Authors. Published under the terms of the CC BY NC ND 4.0 license.
Conflict of interest statement
The authors declare that they have no conflict of interest.
Figures

Schematic representation of the in vitro NPC disassembly assay. HeLa cells expressing GFP‐tagged Nups are semipermeabilized with digitonin. Then, a mitotic HeLa cell extract containing an energy‐regenerating system is added along with 155 kDa fluorescently labeled dextran. Dextran influx into cell nuclei and release of GFP‐tagged Nups from the nuclear rim are monitored by time‐lapse confocal microscopy.
HeLa cells expressing the indicated GFP‐tagged Nups were semipermeabilized and incubated with mitotic HeLa cell extract at 30°C. NPC disassembly was followed by monitoring the fluorescence intensity of the respective Nups at the nuclear rim and influx of TRITC‐dextran. Scale bar, 30 μm.
Quantification of dextran‐positive nuclei over time of the experiments in (B). N = 3 biological replicates, n > 100 cells. Error bars, SEM.
Quantification of the average time point at which 50% of the nuclei were dextran‐positive (t50 dextran) of the experiments in (B). Error bars, SEM; ns (non‐significant), unpaired t‐test, two‐tailed.
Quantification of 3GFP‐Nup133, GFP‐Nup107 and 2GFP‐Nup58 intensity at the NE over time of the experiments in (B). Error bars, SEM.
Quantification of the time point at which 50% of the initial GFP intensity was detected at the NE (t50 GFP) of the experiments in (B). Error bars, SEM; ***P < 0.001 (Nup58 vs. Nup133), **P < 0.01 (Nup107 vs. Nup58), ns (Nup107 vs. Nup133) unpaired t‐test, two‐tailed.
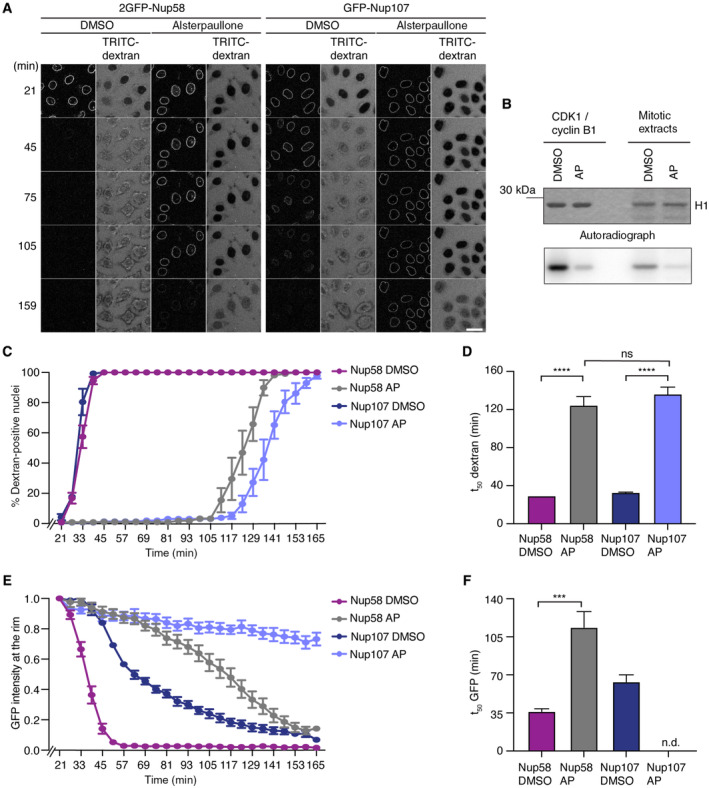
Mitotic cell extracts were either supplemented with DMSO or 50 μM alsterpaullone (AP) and used in the in vitro NPC disassembly assay, performed as in Fig 1. Scale bar, 30 μm. N = 3 biological replicates, n > 100 cells.
In vitro kinase assay monitoring CDK1 activity upon AP inhibition with either recombinant CDK1/cyclin B1 or mitotic HeLa cell extract.
Quantification of dextran‐positive nuclei over time of the experiments in (A). N = 3 biological replicates, n > 100 cells. Error bars, SEM.
Quantification of the average time point at which 50% of nuclei were dextran‐positive (t50 dextran) of the experiments in (A). ****P < 0.0001 (Nup107 DMSO vs. Nup107 AP, Nup58 DMSO vs. Nup58 AP), ns (Nup107 AP vs. Nup58 AP), unpaired t‐test, two‐tailed. Error bars, SEM.
Quantification of GFP‐Nup107 and 2GFP‐Nup58 intensity at the NE over time of the experiments in (A). Error bars, SEM.
Quantification of the time point at which 50% of the initial GFP intensity is detected at the NE (t50 GFP) of the experiments in (A). ***P < 0.001 (Nup58 DMSO vs. Nup58 AP), n.d. = not detected because of the slower disassembly of Nup107, unpaired t‐test, two‐tailed. Error bars, SEM.

Schematic illustration of the membrane flotation assay with nocodazole‐arrested HeLa S3 mitotic cell extracts.
Input, light and dense fractions were analyzed by immunoblotting using the indicated antibodies. The samples were derived from the same experiment but processed using several gels and blots.
Quantification of the percentage of Nups in the light fractions relative to the total amount of Nups over all fractions. N = 4 biological replicates, except for Nup214 (N = 2 biological replicates). Error bars, SEM.

Schematic illustration of the experimental workflow to arrest HeLa cells at the metaphase–anaphase transition.
Confocal images of metaphase‐arrested HeLa cells expressing 3GFP‐Nup133, GFP‐Nup107, GFP‐Nup53 or 2GFP‐Nup58 that were either directly fixed (untreated) or first semi‐permeabilized and then fixed. The ER was visualized by immunostaining with an antibody targeting calnexin; DNA was visualized with Hoechst (visible only in the merged channels). Representative images of three biological replicates. Scale bar, 10 μm and inset scale bar, 1 μm.

ER‐associated Y‐complexes are in close proximity to ER tubule and sheet markers. Confocal images of HeLa cells expressing GFP‐Nup107 that were arrested at the metaphase–anaphase transition. Cells were either fixed (untreated) or first semipermeabilized and then fixed, as described in Fig 3. ER sheets and tubules were visualized by immunostaining with antibodies directed to Climp63 or RTN4. DNA was stained with Hoechst, not shown in the merged images. Representative images of three biological replicates. Scale bar, 10 μm and inset scale bar, 1 μm.
HeLa cells expressing GFP‐Nup107 were treated as in (A) and immunostained with an antibody targeting POM121. Merged channels exclude Hoechst staining. Representative images of three biological replicates. Scale bar, 10 μm and inset scale bar, 1 μm.

- A, B
2D dSTORM images of interphase (A) or metaphase (B) U2OS cells expressing SNAP‐tagged Nup96. Cells were semipermeabilized with digitonin and Nup96 was labeled with the BG‐AF647 SNAP dye. The SMLM data was reconstructed using Thunderstorm. Left panels were rendered to black and white and enhanced for viewing purposes. Insets (yellow dashed boxes) are displayed to the right. Insets in (A) show ring‐shaped structures built by Y‐complexes in interphase cells. Insets in (B) represents mitotic clusters outside the spindle area (class 1, inset 1) and at kinetochores (class 2). Scale bar (left panels), 10 μm. Representative images of four biological replicates. Inset scale bars, 200 nm.

Histogram of fitted radii (R = 52.9 ± 3.2 nm (mean ± SD), N = 3, n > 6,000). Note that SMAP determines the radius at the center coordinates of circular structures that fit a circular model of localizations, whereas DBSCAN (Fig 5) determines the dimensions of objects (here the radius) at the outer circumference of identified structures.
Histogram of the number of corners labeled per NPC.
Histogram of the fitted number of localizations per NPC (localizations = 53 ± 21 (mean ± SD)).

- A, B
3D dSTORM images of interphase (A) or metaphase‐arrested (B) U2OS cells expressing SNAP‐tagged Nup96 that were semipermeabilized with digitonin and labeled with the BG‐AF647 SNAP dye. The SMLM data were rendered with SMAP. Left panels in (A) and (B) were rendered in a z range of −500 to 500 nm. For the insets 1 and 2, the top panels represent the xy dimension, whereas the bottom panels represent xz dimension. For (A), Y‐rings localized at both faces of interphase NPCs were indicated as R1 and R2. In (B), mitotic clusters at the ER and at kinetochores are magnified in insets 1 and 2, respectively. Localizations were color‐coded according to their z position. The insets were rendered in the z ranges of −100 to 300 nm and −200 to 200 nm for (A) and (B), respectively. Representative images of four biological replicates. Scale bar of left panels, 10 μm. Inset scale bars, 100 nm.

2D dSTORM images of a metaphase‐arrested U2OS cell expressing Nup96 with a SNAP‐tag, labeled with BG‐Alexa Fluor 647 (orange), in combination with confocal imaging of the ER immunostained for Climp63 (red) and phospho‐histone H3 (cyan) to label DNA. Inset 1 (mitotic clusters) and inset 2 (kinetochores) are indicated with white dashed boxes. SMLM data were reconstructed using Thunderstorm. Representative images of N = 4 biological replicates. Scale bars, 10 μm. Inset scale bars, 200 nm.
Data analysis procedure of SMLM data. SMLM data were reconstructed in SMAP, processed using DBSCAN and then filtered to obtain the geometry and stoichiometry of Y‐complexes in interphase NPCs, mitotic clusters and at kinetochores.
Quantification of the number of localizations in interphase NPCs (NPC), mitotic clusters and kinetochores of the experiments in (A) using DBSCAN. Error bars, SD.
Quantification of the number of protein copies in interphase NPCs (NPC), mitotic clusters and kinetochores of the experiments in (A) using DBSCAN. Error bars, SD.
Quantification of the cluster width of interphase NPCs (NPC), mitotic clusters and kinetochores of the experiments in (A) using DBSCAN. Error bars, SD.

References
-
- Antonin W, Franz C, Haselmann U, Antony C, Mattaj IW (2005) The integral membrane nucleoporin pom121 functionally links nuclear pore complex assembly and nuclear envelope formation. Mol Cell 17: 83–92 - PubMed
Publication types
MeSH terms
Substances
LinkOut - more resources
Full Text Sources
