

Direct observation of coordinated assembly of individual native centromeric nucleosomes
- PMID: 37469281
- PMCID: PMC10476280
- DOI: 10.15252/embj.2023114534
Direct observation of coordinated assembly of individual native centromeric nucleosomes
Abstract
Eukaryotic chromosome segregation requires the kinetochore, a megadalton-sized machine that forms on specialized centromeric chromatin containing CENP-A, a histone H3 variant. CENP-A deposition requires a chaperone protein HJURP that targets it to the centromere, but it has remained unclear whether HJURP has additional functions beyond CENP-A targeting and why high AT DNA content, which disfavors nucleosome assembly, is widely conserved at centromeres. To overcome the difficulties of studying nucleosome formation in vivo, we developed a microscopy assay that enables direct observation of de novo centromeric nucleosome recruitment and maintenance with single molecule resolution. Using this assay, we discover that CENP-A can arrive at centromeres without its dedicated centromere-specific chaperone HJURP, but stable incorporation depends on HJURP and additional DNA-binding proteins of the inner kinetochore. We also show that homopolymer AT runs in the yeast centromeres are essential for efficient CENP-A deposition. Together, our findings reveal requirements for stable nucleosome formation and provide a foundation for further studies of the assembly and dynamics of native kinetochore complexes.
Keywords: TIRF microscopy; centromere; centromeric nucleosome; chromosome segregation; kinetochore.
© 2023 The Authors. Published under the terms of the CC BY 4.0 license.
Conflict of interest statement
The authors declare that they have no conflict of interest.
Figures
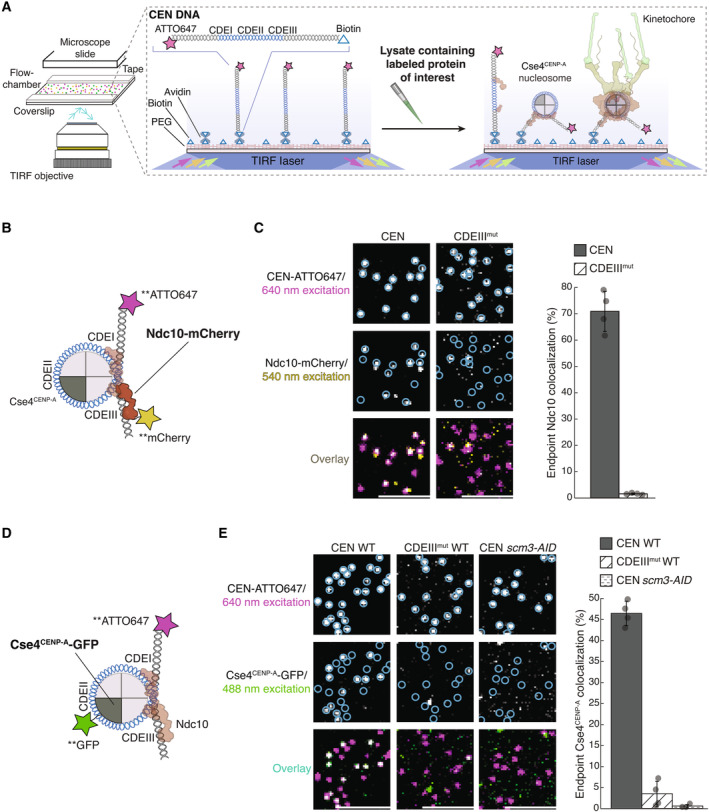
Schematic of the TIRFM colocalization assay. Yeast lysate containing a fluorescent protein(s) of interest is added to a coverslip with immobilized fluorescent CEN DNA. After incubation, the lysate is washed from the chamber and the CEN DNA and fluorescent kinetochore proteins are imaged via TIRFM.
Schematic of fluorescent label location around the centromeric nucleosome used in (C) for colocalization imaging.
Example images of TIRFM endpoint colocalization assays. Top panels show CEN DNA (Top‐left panel, blue circles) or CDEIIIMUT CEN DNA (top‐right panel, blue circles) visualized in lysates containing Ndc10‐mCherry. Middle panels show the visualized Ndc10‐mCherry on CEN DNA (middle‐left panel) or CDEIIIMUT DNA (middle‐right panel) with colocalization shown in relation to blue DNA circles. Bottom panels show overlay of DNA channel (magenta) with Ndc10‐mCherry (yellow) on CEN DNA (bottom‐left panel) or CDEIIIMUT DNA (bottom‐right panel). Scale bars 3 μm. Graph shows the quantification of Ndc10 endpoint colocalization on CEN DNA and on CDEIIIMUT CEN DNA (70 ± 7.6%, 1.6 ± 0.3% respectively, avg ± s.d. n = 4 experiments, each examining ~1,000 DNA molecules from different extracts).
Schematic of fluorescent label location around the centromeric nucleosome used in (E) for colocalization imaging.
Example images of TIRFM endpoint colocalization imaging. Top panels show CEN DNA (top‐left panel, blue circles) or CDEIIIMUT CEN DNA (top‐middle panel, blue circles) visualized in lysates that included Cse4CENP‐A‐GFP or CEN DNA in lysates that lacked Scm3HJURP (scm3‐AID) (top‐right panel, blue circles). Middle panels show Cse4CENP‐A‐GFP visualized on CEN DNA (middle‐left panel) or CDEIIIMUT CEN DNA (center panel) or on CEN DNA in lysates lacking Scm3HJURP (scm3‐AID) (middle‐right panel) with colocalization shown in relation to blue DNA circles. Bottom panels show overlay of CEN DNA channel (magenta) with Cse4CENP‐A‐GFP (green) on CEN DNA (bottom‐left panel) or CDEIIIMUT DNA (bottom‐middle panel) or on CEN DNA in lysates lacking Scm3HJURP (scm3‐AID) (bottom‐right panel). Scale bars 3 μm. Graph shows quantification of observed colocalization of Cse4 on CEN DNA and on CDEIIIMUT CEN DNA or on CEN DNA in lysates that lacked Scm3HJURP (47 ± 2.9%, 3.5 ± 3.0% and 0.6 ± 0.4% respectively, avg ± s.d. n = 4 experiments, each examining ~1,000 DNA molecules from different extracts).
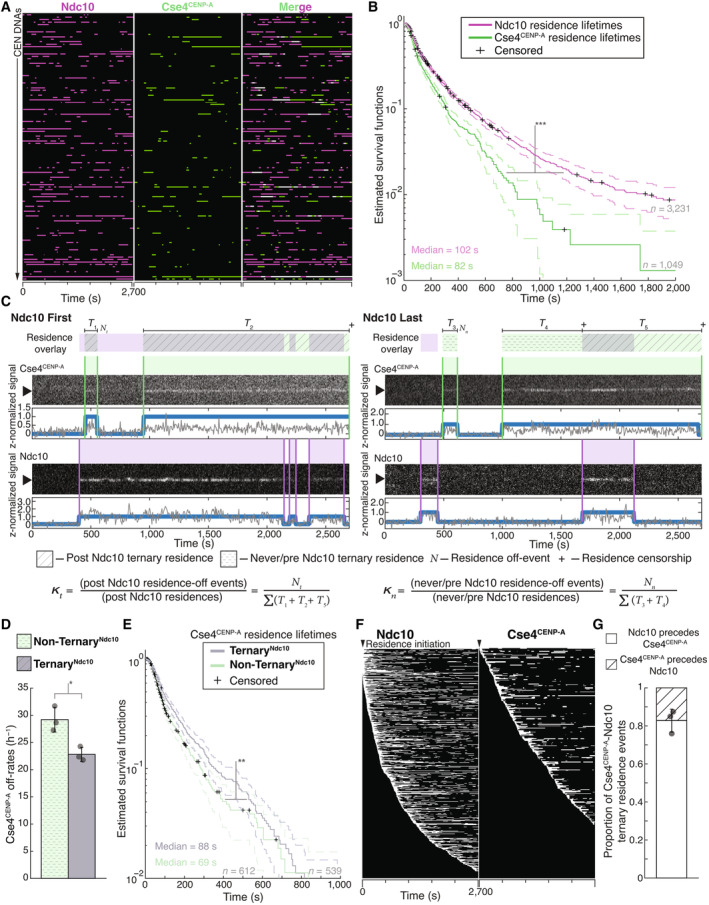
Example graph of total identified colocalization residences observed on CEN DNA per imaging sequence. Each row represents one identified CEN DNA with all identified residences shown over entire imaging sequence (2,700 s) for Ndc10 (magenta) and Cse4CENP‐A (green). Instances where Ndc10 and Cse4CENP‐A residence coincides (white‐merge) represent simultaneous observation of both proteins on single CEN DNA, termed ternary residences. Complete series shown in Fig EV1A.
Estimated survival function plots of Kaplan–Meier analysis of CEN DNA residence lifetimes of Ndc10 (magenta—median lifetime of 102 s, n = 3,231 over three experiments of ~1,000 DNA molecules using different extracts) and Cse4CENP‐A (red—median lifetime of 79 s, n = 1,049 over three experiments of ~1,000 DNA molecules using different extracts). Significant difference between ternary Ndc10 residence lifetime survival plots (***) compared to Cse4CENP‐A (two‐tailed P‐value of 0 as determined by log‐rank test). 95% confidence intervals indicated (dashed lines), right‐censored lifetimes (plus icons) were included and unweighted in survival function estimates.
Schematic for off‐rate estimate calculations with representative residence lifetime assay traces of Ndc10 and Cse4CENP‐A on CEN DNA. Example kymographs of Cse4CENP‐A (top‐488 nm) and Ndc10 (bottom‐568 nm) in relation to a single identified CEN DNA (arrow), with normalized intensity trace below (gray) as well as identified colocalization residences (blue). Ndc10 First example (left) illustrates Ndc10 colocalization that precedes Cse4CENP‐A, yielding only TernaryNdc10 Cse4CENP‐A residences. Ndc10 Last example (right) illustrates Cse4CENP‐A colocalization that precedes Ndc10, yielding both Non‐TernaryNdc10 Cse4CENP‐A residences and TernaryNdc10 Cse4CENP‐A residence after Ndc10 colocalization initiation. Images were acquired every 5 s with normalized fluorescence intensity shown in arbitrary units. Bottom panel includes formulas used to calculate the ternary Cse4CENP‐A off‐rate, , where represents the total number of apparent Cse4‐GFP detachments recorded during ternary residences, and represents the total amount of ternary residence time observed. In addition, the formula for non‐ternary Cse4 off‐rate, , where represents the total number of apparent Cse4‐GFP detachments recorded during non‐ternary residences, and represents the total amount of non‐ternary residence time observed.
Cse4CENP‐A has slower off‐rates after colocalization with Ndc10 on CEN DNA. Quantification of the estimated Cse4CENP‐A off‐rates of the Non‐TernaryNdc10 and TernaryNdc10 pools (29 ± 2 h−1 and 22 ± 1 h−1 respectively, avg ± s.d. n = 1,151 over three experiments of ~1,000 DNA molecules using different extracts). Significant difference between off‐rates (*) with a P‐value of 0.02 as determined by two‐tailed unpaired t‐test.
Kaplan–Meier analysis of TernaryNdc10 residence lifetimes of Cse4CENP‐A on CEN DNA (purple—median lifetime of 88 s, n = 539 over three experiments of ~1,000 DNA molecules using different extracts) and of Non‐TernaryNdc10 Cse4CENP‐A residence lifetimes (teal—median lifetime of 69 s, n = 612 over three experiments of ~1,000 DNA molecules using different extracts). There is a significant difference (**) between TernaryNdc10 and Non‐TernaryNdc10 lifetime survival plots (two‐tailed P‐value of 7.4e‐4 as determined by log‐rank test). 95% confidence intervals indicated (dashed lines), right‐censored lifetimes (plus icons) were included and unweighted in survival function estimates.
Example plot of total identified residences observed on CEN DNA per imaging sequence of Ndc10 (left) and Cse4CENP‐A (right) independently sorted by residence initiation time, starting at the top with initiation time of 0 s (arrow).
Timing of all non‐simultaneous Ndc10 and Cse4CENP‐A ternary residence events. The proportion when Ndc10 precedes Cse4CENP‐A is 0.83 ± 0.06 and when Cse4CENP‐A precedes Ndc10 is 0.17 ± 0.06 (avg ± s.d., n = 504 over three experiments of ~1,000 DNA molecules using different extracts). Simultaneous arrival defined as residence initiation within 5 s of each other and comprise 0.07 ± 0.04 of all ternary residence events (avg ± s.d., n = 35 over three experiments of ~1,000 DNA molecules using different extracts).
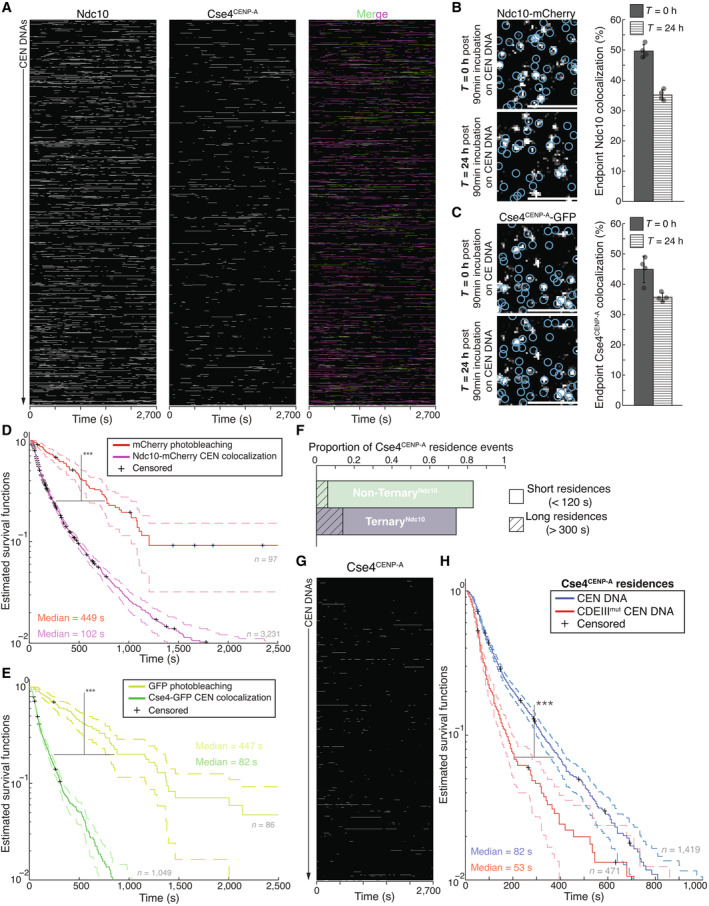
Example plot of Ndc10 and Cse4CENP‐A residence pulses on CEN DNA identified via residence lifetime assays during an entire imaging sequence acquisition. Each row represents one identified CEN DNA with all identified residences shown over entire imaging sequence (2,700 s) for Ndc10 (left) and Cse4CENP‐A (center) with merge of Ndc10 (magenta) and Cse4CENP‐A (green) indicating ternary residences (white).
Example images of TIRFM endpoint colocalization assays. Visualized Ndc10‐mCherry on CEN DNA after 90 min incubation and removal of lysate (0 h ‐top panel) or after 24 h incubation at RT in imaging buffer (bottom panel) with colocalization shown in relation to identified CEN DNA in blue circles. Scale bars 3 μm. Graph shows quantification of Ndc10 endpoint colocalization on CEN DNA at 0 h and 24 h (50 ± 2.2%, 35 ± 1.7% respectively, avg ± s.d. n = 4 experiments, each examining ~1,000 DNA molecules from different extracts).
Example images of TIRFM endpoint colocalization assays. Visualized Cse4CENP‐A GFP on CEN DNA after 90 min incubation and removal of lysate (0 h—top panel) or after 24 h incubation at RT in imaging buffer (bottom panel) with colocalization shown in relation to identified CEN DNA in blue circles. Scale bars 3 μm. Graph shows quantification of Cse4CENP‐A endpoint colocalization on CEN DNA at 0 and 24 h (45 ± 4.4%, 36 ± 1.4% respectively, avg ± s.d. n = 4 experiments, each examining ~1,000 DNA molecules from different extracts).
Kaplan–Meier analysis of mCherry photobleaching events (red—median photobleaching lifetimes of 449 s (n = 97)) and Ndc10 residences on CEN DNA (magenta—median lifetime of 102 s (n = 3,231)). There was a significant difference between mCherry photobleaching lifetimes and Ndc10 residence lifetime survival plots (***) on CEN (two‐tailed P‐value of 0 as determined by log‐rank test). 95% confidence intervals indicated (dashed lines), right‐censored lifetimes (plus icons) were included and unweighted in survival function estimates.
Kaplan–Meier analysis of GFP photobleaching events (yellow—median photobleaching lifetime of 447 s (n = 86)) and Cse4CENP‐A residences on CEN DNA (red—median colocalization lifetime of 88 s (n = 1,054)). There was a significant difference between GFP photobleaching lifetimes and Cse4CENP‐A residence lifetime survival plots (***) on CEN DNA (two‐tailed P‐value of 0 as determined by log‐rank test). 95% confidence intervals indicated (dashed lines), right‐censored lifetimes (plus icons) were included and unweighted in survival function estimates.
Quantification of the proportion of short residences (< 120 s) and long residences (> 300 s) of Non‐TernaryNdc10 Cse4CENP‐A residences (0.77 and 0.06 respectively, n = 612 over three experiments of ~1,000 DNA molecules using different extracts) or TernaryNdc10 Cse4CENP‐A (0.60 and 0.14 respectively, n = 539 over three experiments of ~1,000 DNA molecules using different extracts).
Example plot of residences of Cse4CENP‐A on CDEIIImut CEN DNA per imaging sequence. Each row represents one identified CEN DNA with all identified residences shown over entire imaging sequence (2,700 s) for Cse4CENP‐A.
Cse4CENP‐A residence lifetimes on CDEIIImut CEN DNA are reduced. Estimated survival function plots of Kaplan–Meier analysis of residence lifetimes of Cse4CENP‐A on CEN DNA (blue—median lifetime of 82 s, n = 1,419 over three experiments of ~1,000 DNA molecules using different extracts) and residences on CDEIIImut CEN DNA of Cse4CENP‐A (red—of 52 s, n = 471 over three experiments of ~1,000 DNA molecules using different extracts). There was a significant difference (***) between CEN DNA and CDEIIImut CEN DNA lifetime survival plots (two‐tailed P‐value of 0 as determined by log‐rank test). 95% confidence intervals indicated (dashed lines), right‐censored lifetimes (plus icons) were included and unweighted in survival function estimates.
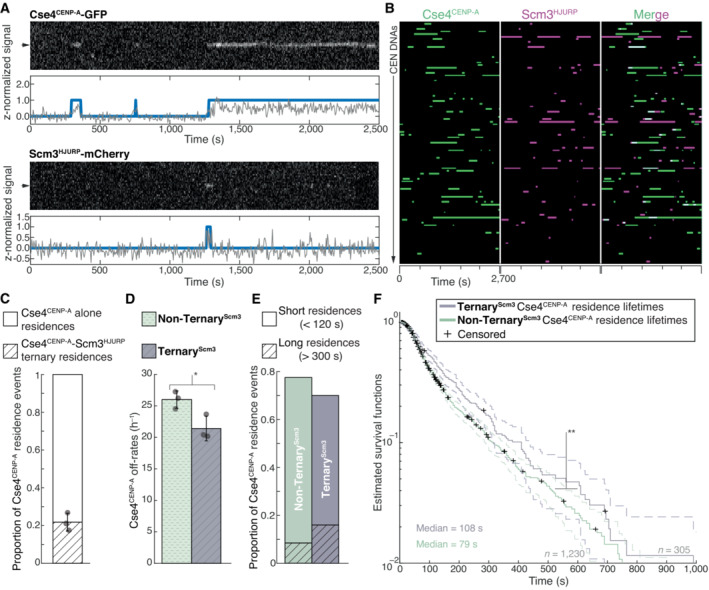
Representative residence lifetime assay traces of Cse4CENP‐A and Scm3HJURP on a single CEN DNA. Top panel includes kymograph of Cse4CENP‐A (top‐488 nm) in relation to single identified CEN DNA (arrow), with normalized intensity trace (gray‐bottom) as well as identified residences (blue). Bottom panel includes kymograph of Cse4CENP‐A (bottom‐568 nm) in relation to the same identified CEN DNA (arrow), with normalized intensity trace (gray‐bottom) as well as identified residences (blue). Images acquired every 5 s with normalized fluorescence intensity shown in arbitrary units.
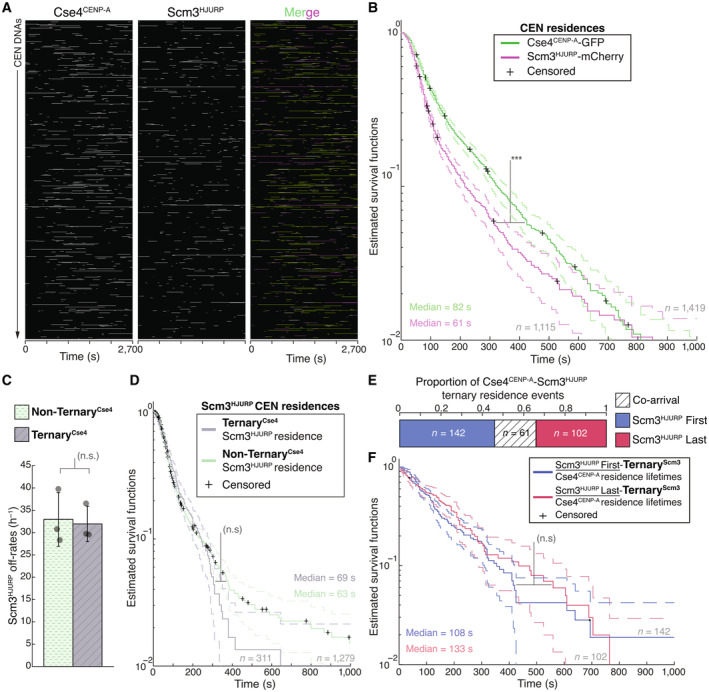
Example plot of total identified residences observed on CEN DNA per imaging sequence. Each row represents one identified CEN DNA with all identified residences shown over entire imaging sequence (2,700 s) for Cse4CENP‐A (green) and Scm3HJURP (magenta). Cases where Scm3HJURP and Cse4CENP‐A residence coincides represent simultaneous observation of both proteins on single CEN DNA, termed ternary residence (merge, white). Complete plot shown in Fig EV2A.
Quantification of the proportion of Cse4CENP‐A and Scm3HJURP ternary residences with CEN DNA compared to CEN DNA residences of Cse4CENP‐A alone (0.22 ± 0.05 and 0.78 ± 0.05 respectively, avg ± s.d. n = 1,419 over three experiments of ~1,000 DNA molecules using different extracts). Ternary residences include simultaneous Scm3HJURP residence at any point during continuous Cse4CENP‐A residence on CEN DNA.
Quantification of the estimated off‐rates of Cse4CENP‐A that never formed a ternary residence (Non‐TernaryScm3) and of Cse4CENP‐A after ternary residence with Scm3HJURP (TernaryScm3) on CEN DNA (26 h−1 ± 1 h−1 and 21 h−1 ± 2 h−1 respectively, avg ± s.d. n = 1,535 over three experiments of ~1,000 DNA molecules using different extracts). Significant difference between off‐rates (*) with a P‐value of 0.03 as determined by two‐tailed unpaired t‐test.
Quantification of the proportion of short residences (< 120 s) and long residences (> 300 s) of Cse4CENP‐A alone or in ternary residences on CEN DNA. Short and long Non‐TernaryScm3 Cse4CENP‐A residences (0.69 and 0.08 respectively, n = 1,063 over three experiments of ~1,000 DNA molecules using different extracts) and short and long TernaryScm3 Cse4CENP‐A residences (0.54 and 0.16 respectively, n = 305 over three experiments of ~1,000 DNA molecules using different extracts).
Longer residence lifetimes are measured for Cse4CENP‐A after Scm3HJURP colocalizes. Estimated survival function plots of Kaplan–Meier analysis of the lifetimes of TernaryScm3 Cse4CENP‐A residences on CEN DNA (purple—median lifetime of 108 s, n = 305 over three experiments of ~1,000 DNA molecules using different extracts) and Non‐TernaryScm3 Cse4CENP‐A residences on CEN DNA (green—of 79 s, n = 1,230 over three experiments of ~1,000 DNA molecules using different extracts). Significant difference (**) between TernaryScm3 and Non‐TernaryScm3 lifetime survival plots (two‐tailed P‐value of 2.1e‐3 as determined by log‐rank test). 95% confidence intervals indicated (dashed lines), right‐censored lifetimes (plus icons) were included and unweighted in survival function estimates.
Example plot of Cse4CENP‐A and Scm3HJURP residences on CEN DNA per imaging sequence. Each row represents one identified CEN DNA with all identified residences shown over entire imaging sequence (2,700 s) Cse4CENP‐A (left) and Scm3HJURP (center) with merge indicating Cse4CENP‐A (green), Scm3HJURP (magenta) and ternary residences (white).
Estimated survival function plots of Kaplan–Meier analysis of Cse4CENP‐A residence lifetimes on CEN DNA (green—median lifetime of 82 s, n = 1,419 over three experiments of ~1,000 DNA molecules using different extracts), and residence lifetimes of Scm3HJURP on CEN DNA (magenta—median lifetime of 61 s, n = 1,115 over three experiments of ~1,000 DNA molecules using different extracts). 95% confidence intervals indicated (dashed lines). Significant difference (***) between Cse4CENP‐A and Scm3HJURP residence survival plots (two‐tailed P‐value of 9.1e‐14 as determined by log‐rank test), right‐censored lifetimes (plus icons) were included and unweighted in survival function estimates.
Quantification of the estimated off‐rates of Scm3HJURP that never formed a ternary residence (Non‐TernaryCse4) and of Scm3HJURP after ternary residence with Cse4CENP‐A (TernaryCse4) on CEN DNA (114 s ± 13 s and 111 s ± 19 s respectively, avg ± s.d. n = 2,050 over three experiments of ~1,000 DNA molecules using different extracts). No significant difference between off‐rates (n.s.) with a P‐value of 0.87 as determined by two‐tailed unpaired t‐test.
Estimated survival function plots of Kaplan–Meier analysis of the lifetimes of TernaryCse4 Scm3HJURP residences on CEN DNA (purple—median lifetime of 69 s, n = 311 over three experiments of ~1,000 DNA molecules using different extracts) and Non‐TernaryCse4 Scm3HJURP residences on CEN DNA (green—of 63 s, n = 1,279 over three experiments of ~1,000 DNA molecules using different extracts). No significant difference (n.s.) between TernaryCse4 and Non‐TernaryCse4 survival plots (two‐tailed P‐value of 0.75 as determined by log‐rank test). 95% confidence intervals indicated (dashed lines), right‐censored lifetimes (plus icons) were included and unweighted in survival function estimates.
Timing of all observed Cse4CENP‐A and Scm3HJURP ternary residence events. The proportion when Scm3HJURP precedes Cse4CENP‐A (Scm3HJURP First) is 0.46, followed by 0.34 when Cse4CENP‐A precedes Scm3HJURP (Scm3HJURP Last), with a proportion of 0.20 co‐arrival events (Co‐arrival—defined as residence initiation within 5 s of each, n = 305 over three experiments of ~1,000 DNA molecules using different extracts).
Estimated survival function plots of Kaplan–Meier analysis of the lifetimes of Scm3HJURP‐First‐TernaryScm3 Cse4CENP‐A residences on CEN DNA (purple—median lifetime of 108 s, n = 142 over three experiments of ~1,000 DNA molecules using different extracts) and Scm3HJURP‐Last‐TernaryScm3 Cse4CENP‐A residences on CEN DNA (green—of 133 s, n = 102 over three experiments of ~1,000 DNA molecules using different extracts). No significant difference (n.s.) between Scm3HJURP‐First and Scm3HJURP‐Last survival plots (two‐tailed P‐value of 0.59 as determined by log‐rank test). 95% confidence intervals indicated (dashed lines), right‐censored lifetimes (plus icons) were included and unweighted in survival function estimates.
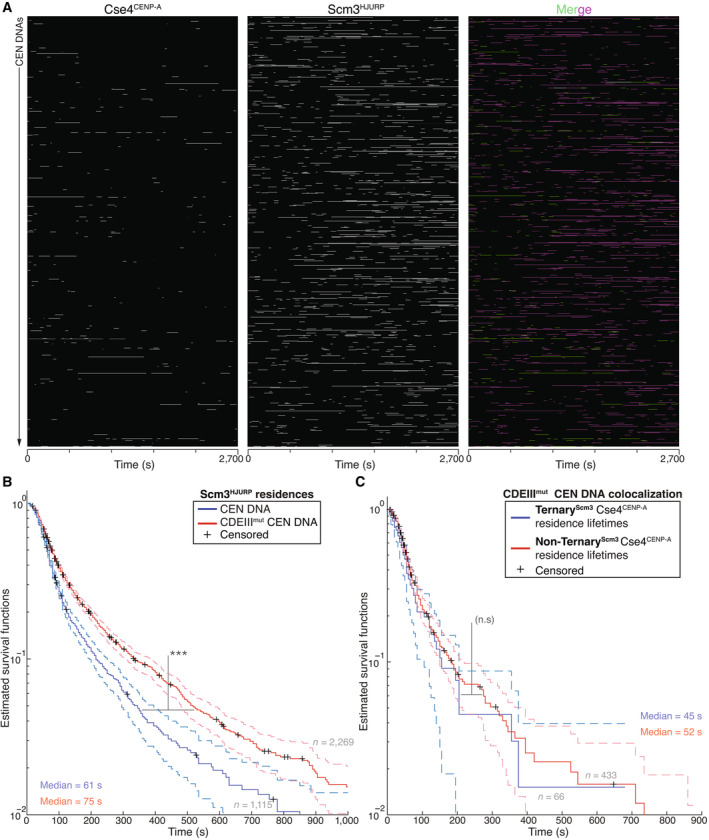
Example plot of residences of Cse4CENP‐A and Scm3HJURP on CDEIIImut CEN DNA per imaging sequence. Each row represents one identified CEN DNA with all identified residences shown over entire imaging sequence (2,700 s) for Cse4CENP‐A (left) and Scm3HJURP (center) with merge indicating Cse4CENP‐A (green), Scm3HJURP (magenta) and ternary residences (white).
Scm3HJURP residences are longer on CDEIIImut CEN DNA. Estimated survival function plots of Kaplan–Meier analysis of Scm3HJURP residence lifetimes on CEN DNA (blue—median lifetime of 61 s, n = 1,115 over three experiments of ~1,000 DNA molecules using different extracts), and residence lifetimes of Scm3HJURP on CDEIIImut CEN DNA (red—median lifetime of 75 s, n = 2,269 over three experiments of ~1,000 DNA molecules using different extracts). There was a significant difference (***) between CEN DNA and CDEIIImut CEN DNA lifetime survival plots (two‐tailed P‐value of 5.13e‐13 as determined by log‐rank test). 95% confidence intervals indicated (dashed lines), right‐censored lifetimes (plus icons) were included and unweighted in survival function estimates.
Cse4CENP‐A residence lifetimes are similar without Scm3HJURP a on CDEIIImut CEN DNA. Estimated survival function plots of Kaplan–Meier analysis of ternary residence lifetimes of TernaryScm3 Cse4CENP‐A residences on CDEIIImut CEN DNA (blue—median lifetime of 45 s, n = 66 over three experiments of ~1,000 DNA molecules using different extracts) and Non‐TernaryScm3 Cse4CENP‐A residences on CDEIIImut CEN DNA (red—of 52 s, n = 433 over three experiments of ~1,000 DNA molecules using different extracts). There was no significant difference (n.s.) between Non‐TernaryScm3 and TernaryScm3 survival plots (two‐tailed P‐value of 0.27 as determined by log‐rank test). 95% confidence intervals indicated (dashed lines), right‐censored lifetimes (plus icons) were included and unweighted in survival function estimates.
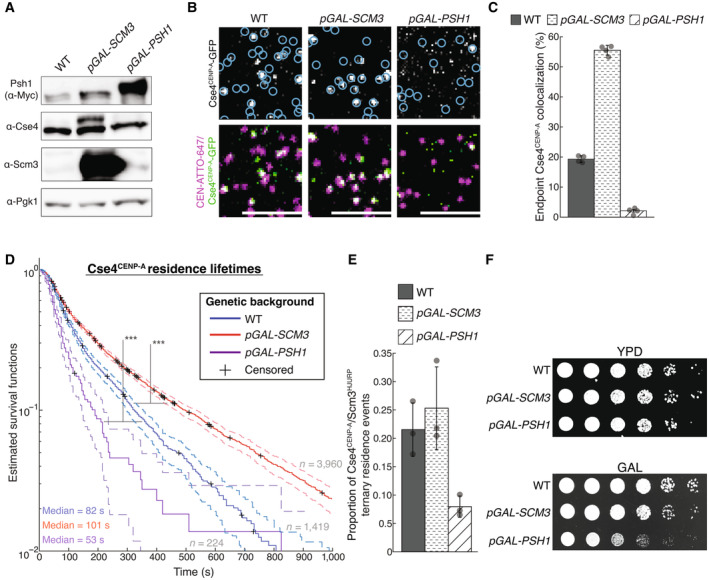
Immunoblot analysis of whole cell extracts from WT, pGAL‐SCM3 and pGAL‐PSH1 cells using indicated antibodies (all panels cropped from the same blot).
Example images of TIRFM endpoint colocalization assays. Top panels show visualized Cse4CENP‐A ‐GFP on CEN DNA in extracts from a WT genetic background (top‐left panel) or extracts containing overexpressed Scm3HJURP (pGAL‐SCM3, top‐middle panel) or overexpressed Psh1 (pGAL‐PSH1, top‐right panel) with colocalization shown in relation to identified CEN DNAs in blue circles. Bottom panels show overlay of DNA channel (magenta) with Cse4CENP‐A ‐GFP (green). Scale bars 3 μm.
Quantification of endpoint colocalization of Cse4CENP‐A on CEN DNA in extracts from a WT genetic background, extracts that contain overexpressed Scm3HJURP or extracts that contain overexpressed Psh1 (19 ± 1.1%, 56 ± 1.6% and 2.1 ± 0.4% respectively, avg ± s.d. n = 4 experiments, each examining ~1,000 DNA molecules from different extracts).
Estimated survival function plots of Kaplan–Meier analysis of residence lifetimes of Cse4CENP‐A on CEN DNA in extracts from WT genetic background (blue—median lifetime of 82 s, n = 1,419 over three experiments of ~1,000 DNA molecules using different extracts), or from extracts that contain overexpressed Scm3HJURP (red—median lifetime of 101 s, n = 3,960 over three experiments of ~1,000 DNA molecules using different extracts) or extracts that contain overexpressed Psh1 (purple—median lifetime of 52 s, n = 224 over three experiments of ~1,000 DNA molecules using different extracts). Significant difference (***) between survival plots in WT extracts compared to those overexpressing Psh1 (two‐tailed P‐value of 8.9e‐11 as determined by log‐rank test) or Scm3HJURP (two‐tailed P‐value of 0 as determined by log‐rank test). 95% confidence intervals indicated (dashed lines), right‐censored lifetimes (plus icons) were included and unweighted in survival function estimates.
Proportion of ternary residences of Cse4CENP‐A with Scm3HJURP on CEN DNA for WT extracts (0.22 ± 0.05, avg ± s.d. n = 1,419 over three experiments of ~1,000 DNA molecules using different extracts), extracts containing overexpressed Scm3HJURP (0.25 ± 0.07, avg ± s.d. n = 3,960 over three experiments of ~1,000 DNA molecules using different extracts) and extracts containing overexpressed Psh1 (0.08 ± 0.02, avg ± s.d. n = 224 over three experiments of ~1,000 DNA molecules using different extracts).
Serial five‐fold dilutions of the following yeast strains were plated and grown 2 days on YPD and 3 days on galactose (GAL) at 23° C: WT (SBY21441), pGAL‐SCM3 (SBY21443), and pGAL‐PSH1 (SBY20836).
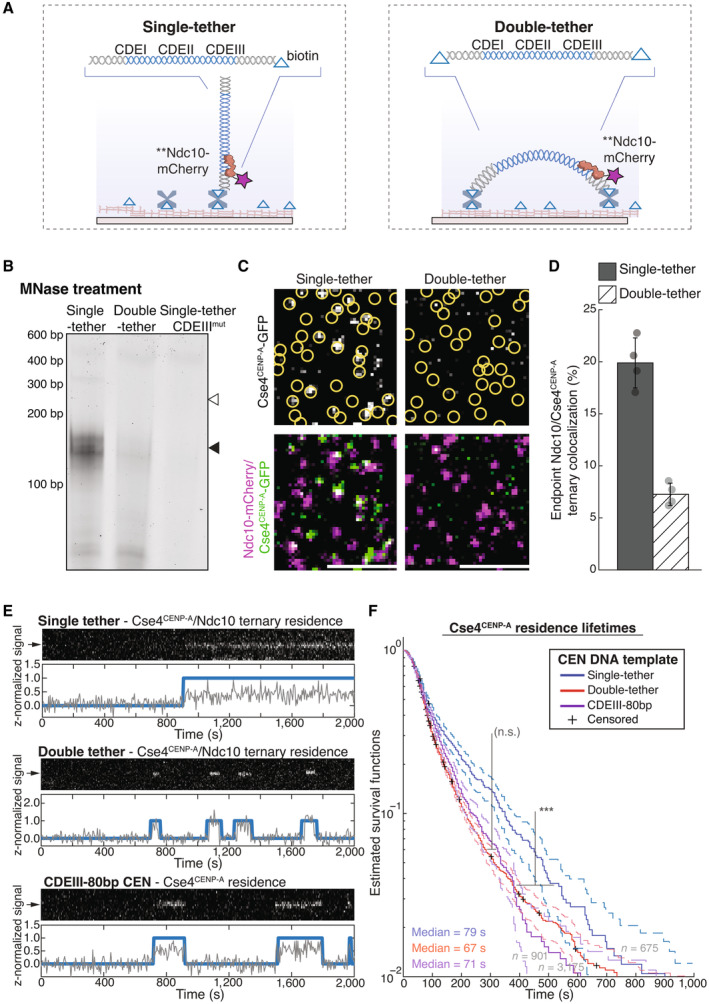
Schematic of single versus double‐tether CEN DNA TIRFM colocalization assay.
Kinetochores were assembled on beads containing either a 250 bp single‐tether, a 250 bp double‐tether or a 250 bp CDEIIImut CEN DNA. They were then treated with MNase, and the remaining DNA was visualized on an agarose gel. Black arrow indicates Cse4CENP‐A nucleosome protected DNA (~150 bp); white arrow indicates theoretical location of undigested template DNA (250 bp).
Example images of TIRFM endpoint colocalization assays. Top panels show Cse4CENP‐A/Ndc10 ternary colocalizations visualized on single‐tethered CEN DNA (top‐left panel) or on double‐tethered CEN DNA (top‐right panel) with colocalization shown in relation to Ndc10 in yellow circles. Bottom panels show overlay of Ndc10 channel (magenta) with Cse4CENP‐A (green). Scale bars 3 μm.
Quantification of observed ternary colocalization of Cse4CENP‐A with Ndc10 (right) on single‐tethered CEN DNA containing Ndc10 (19.9 ± 2.4%, avg ± s.d. n = 4 experiments, each examining ~1,000 DNA molecules from different extracts) and on double‐tethered CEN DNA (7.3 ± 1.1%, avg ± s.d. n = 4 experiments, each examining ~1,000 DNA molecules from different extracts).
Representative residence lifetime assay traces of ternary Cse4CENP‐A residences with Ndc10 on single‐tethered CEN DNA (top), double‐tethered CEN DNA (middle) or of Cse4CENP‐A residence on CDEIII‐80 bp CEN DNA (bottom). Each example includes kymographs of Cse4CENP‐A (488 nm‐top) with normalized intensity trace (gray‐bottom) as well as identified residences (blue). Images acquired every 5 s with normalized fluorescence intensity shown in arbitrary units.
Residence times for Cse4CENP‐A on double‐tethered CEN DNAs are shorter than on single‐tethered CEN DNAs and equivalent to those on non‐functional mutant CEN DNAs. Estimated survival function plots of Kaplan–Meier analysis of ternary residences of Cse4CENP‐A with Ndc10 on single‐tethered CEN DNA (blue—median lifetime of 79 s, n = 675 over three experiments of ~1,000 DNA molecules using different extracts), on double‐tethered CEN DNA (red—median lifetime of 67 s, n = 3,175 over three experiments of ~1,000 DNA molecules using different extracts) or Cse4CENP‐A lifetimes on CDEIII‐80 bp CEN DNA (purple—median lifetime of 71 s, n = 901 over three experiments of ~1,000 DNA molecules using different extracts). No significant difference (n.s.) between double‐tethered 250 bp CEN DNA and 80 bp CDEIII CEN DNA lifetime survival plots (two‐tailed P‐value of 0.06 as determined by log‐rank test). Significant difference (***) between double‐tethered 250 bp CEN DNA and 250 bp single‐tether DNA lifetime survival plots (two‐tailed P‐value of 1.4e‐10 as determined by log‐rank test). 95% confidence intervals indicated (dashed lines), right‐censored lifetimes (plus icons) were included and unweighted in survival function estimates.
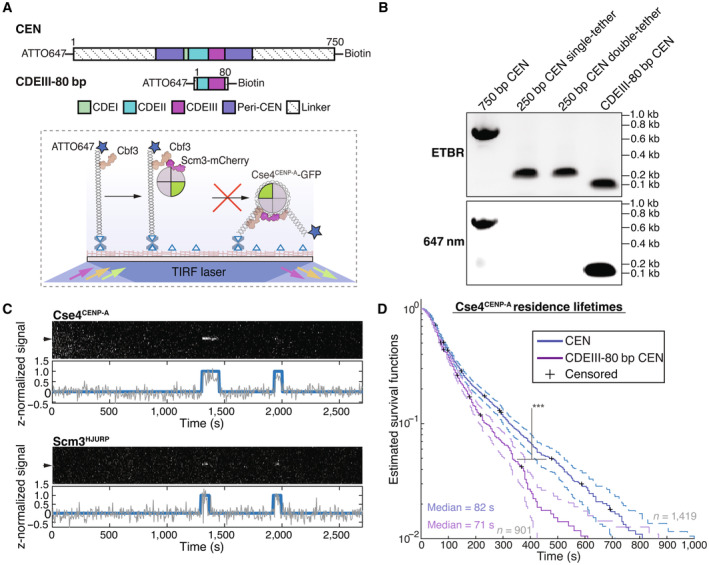
Schematic of overview of CDEIII‐80 bp mutant CEN DNA, the canonical CEN DNA is shortened to 80 bp to prevent nucleosome formation and then similarly functionalized to the coverslip via a single biotin at the 5′ end and functionalized with an organic dye at the free 3′ end.
CEN assembly templates including WT 750 bp CEN DNA, 250 bp single‐tether CEN DNA, 250 bp double‐tethered CEN DNA and CDEIII‐80 bp CEN DNA as visualized via EtBr (top panel) or 647 nm excitation (bottom panel) on a 1% agarose gel.
Representative colocalization traces of Cse4CENP‐A and Scm3HJURP on a single CDEIII‐80 bp CEN DNA. Top panel includes kymograph of Cse4CENP‐A (top‐488 nm) in relation to single identified CEN DNA (arrow), with normalized intensity trace (gray‐bottom) as well as identified colocalization pulses (blue). Bottom panel includes kymograph of Scm3HJURP (bottom‐568 nm) in relation to the same identified CEN DNA (arrow), with normalized intensity trace (gray‐bottom) as well as identified colocalization pulse (blue). Cases where identified pulses in Scm3HJURP and Cse4CENP‐A coincide represent observed colocalization of both proteins on single CDEIII‐80 bp CEN DNA. Images acquired every 5 s with normalized fluorescence intensity shown in arbitrary units.
Estimated survival function plots of Kaplan–Meier analysis of all identified CEN DNA colocalization events of Cse4CENP‐A (blue—median lifetime of 82 s, n = 1,619 over three experiments of ~1,000 DNA molecules using different extracts) and identified colocalization events on CDEIII‐80 bp CEN DNA of Cse4CENP‐A (red—median lifetime of 71 s, n = 901 over three experiments of ~1,000 DNA molecules using different extracts). Significant difference (***) between CEN DNA and CDEIII‐80 bp CEN DNA lifetime survival plots (two‐tailed P‐value of 1.0e‐6 as determined by log‐rank test). 95% confidence intervals indicated (dashed lines), right‐censored lifetimes (plus icons) were included and unweighted in survival function estimates.
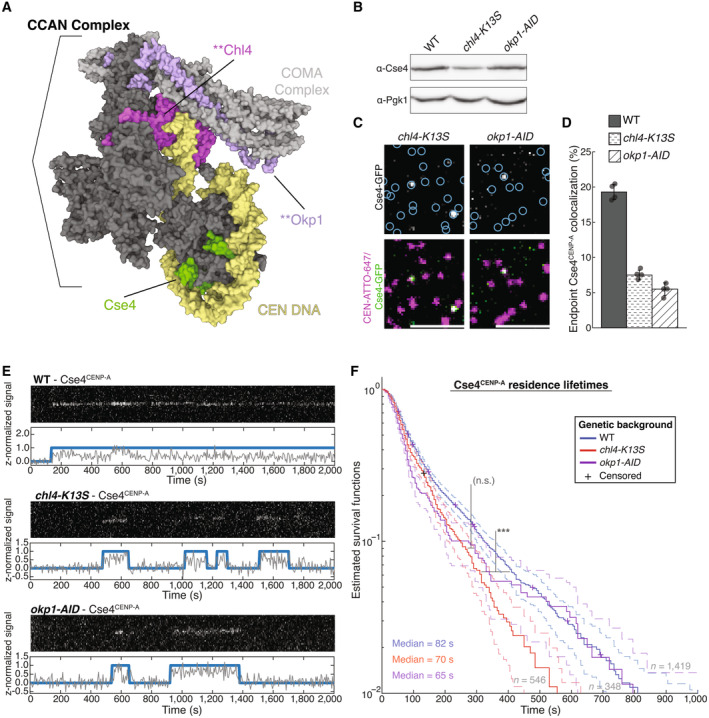
Structure of the yeast CCAN in complex with Cse4CENP‐A with CEN DNA (yellow), Cse4CENP‐A (green), Chl4CENP‐N (magenta) and Okp1CENP‐Q (purple), highlighting DNA‐adjacent regions targeted by the chl4‐K13S mutant or proteasomal degradation of Okp1CENP‐Q (okp1‐AID). Image of 6QLD (Yan et al, 2019) created with Mol* (Sehnal et al, 2021).
Immunoblot analysis of whole cell extracts from WT, chl4‐K13S and okp1‐AID cells using indicated antibodies.
Example images of TIRFM endpoint colocalization assays. Top panels show visualized Cse4CENP‐A‐GFP on CEN DNA in extracts from chl4‐K13S (top‐left panel) or auxin‐treated okp1‐AID strains (okp1‐AID, top‐right panel) with colocalization shown in relation to identified CEN DNA in blue circles. Bottom panels show overlay of CEN DNA channel (magenta) with Cse4CENP‐A‐GFP (green), Scale bars 3 μm.
Quantification of Cse4CENP‐A endpoint colocalization with CEN DNA in extracts from WT, chl4‐K13S, or okp1‐AID genetic backgrounds (19 ± 1.1%, 8 ± 0.7%, 5 ± 0.9%, avg ± s.d. n = 4 experiments, each examining ~1,000 DNA molecules from different extracts).
Representative residence traces of Cse4CENP‐A signal on CEN DNA in WT (top), chl4‐K13S (middle), or okp1‐AID (bottom) extracts. Each example includes kymographs of Cse4CENP‐A (488 nm‐top) with normalized intensity trace (gray‐bottom) as well as identified residences (blue). Images acquired every 5 s with normalized fluorescence intensity shown in arbitrary units.
Kaplan–Meier analysis of Cse4CENP‐A residence lifetimes on CEN DNA in extracts from WT (blue—median lifetime of 82 s, n = 1,419 over three experiments of ~1,000 DNA molecules using different extracts), chl4‐K13S (red—median lifetime of 70 s, n = 546 over three experiments of ~1,000 DNA molecules using different extracts) and okp1‐AID (purple—median lifetime of 61 s, n = 348 over three experiments of ~1,000 DNA molecules using different extracts) genetic backgrounds. Significant difference (***) between WT extract and chl4‐K13S extract residence lifetime plots (two‐tailed P‐value of 3.4e‐5 as determined by log‐rank test). No significant difference (n.s.) between chl4‐K13S and okp1‐AID residence lifetimes in (two‐tailed P‐value of 0.40 as determined by log‐rank test). 95% confidence intervals indicated (dashed lines), right‐censored lifetimes (plus icons) were included and unweighted in survival function estimates.
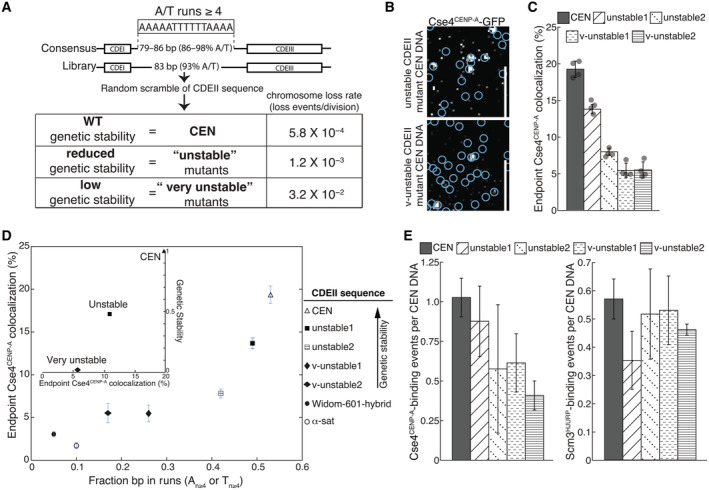
Overview of CDEII mutants generated for stability assays where overall % of A/T content was maintained while A/T run content was randomly varied and selected for genetic stability including reported chromosome loss rates of WT and CDEII mutant pools (adapted from Baker & Rogers, 2005).
Example images of TIRFM endpoint colocalization assays. Visualized Cse4CENP‐A‐GFP on unstable1 CDEII‐mutant DNA (top panel) or on v‐unstable1 CDEII‐mutant DNA (bottom panel) with colocalization shown in relation to identified CEN DNA in blue circles. Scale bars 3 μm.
Quantification of endpoint colocalization of Cse4CENP‐A on CEN, unstable1, unstable2, v‐unstable1, and v‐unstable2 CEN DNA (19.3 ± 1.1%, 13.8 ± 0.6%, 7.8 ± 0.5%, 5.5 ± 1.0%, 5.5 ± 1.1%, avg ± s.d. n = 4 experiments, each examining ~1,000 DNA molecules from different extracts).
Stable Cse4CENP‐A recruitment depends upon CDEII sequence A/T run content. Plot of fraction of all CDEII bp that occur in homopolymeric A n ≥ 4 or T n ≥ 4 repeats (fraction bp in runs, N ≥ 4) in CEN, unstable1, unstable2, v‐unstable1, v‐unstable2, Widom‐601 hybrid and α‐sat CEN DNA (0.53, 0.49, 0.41, 0.26, 0.17, 0.05, 0 0.10), versus the observed colocalization of Cse4CENP‐A on CEN, unstable1 unstable2, v‐unstable1, v‐unstable2, Widom‐601 hybrid and α‐sat CEN DNA (19.3 ± 1.1%, 13.8 ± 0.6%, 7.8 ± 0.5%, 5.5 ± 1.0%, 5.5 ± 1.1%, 3.1 ± 0.3%, 1.7 ± 0.4%, avg ± s.d. n = 4). Inset plot of Cse4CENP‐A endpoint colocalization percentage on CEN, unstable mutants (average), and very unstable mutants (average) (19.9, 10.8, and 5.5% respectively) versus genetic stability (chromosome loss normalized to CEN) of WT, unstable mutants, and very unstable mutants (1.0, 0.48, and 0.02, respectively).
Very unstable CDEII mutants have reduced average Cse4CENP‐A binding when compared to unstable counterparts. Average residences of Cse4CENP‐A per CEN DNA (left) on CEN, unstable1, unstable2, v‐unstable1, and v‐unstable2 CEN DNA (1.03 ± 0.12, 0.88 ± 0.22, 0.58 ± 0.41, 0.61 ± 0.18, 0.41 ± 0.09, avg ± s.e.m. n = 3 experiments of ~1,000 DNA molecules using different extracts) and average residences of Scm3HJURP per CEN DNA (right) on CEN, unstable1, unstable2, v‐unstable1, and v‐unstable2 CEN DNA (0.57 ± 0.07, 0.35 ± 0.10, 0.52 ± 0.16, 0.53 ± 0.12, 0.46 ± 0.02, avg ± s.e.m. n = 3 experiments of ~1,000 DNA molecules using different extracts).
Update of
-
Direct observation of coordinated assembly of individual native centromeric nucleosomes.bioRxiv [Preprint]. 2023 May 17:2023.01.20.524981. doi: 10.1101/2023.01.20.524981. bioRxiv. 2023. Update in: EMBO J. 2023 Sep 4;42(17):e114534. doi: 10.15252/embj.2023114534. PMID: 36711558 Free PMC article. Updated. Preprint.
Similar articles
-
Direct observation of coordinated assembly of individual native centromeric nucleosomes.bioRxiv [Preprint]. 2023 May 17:2023.01.20.524981. doi: 10.1101/2023.01.20.524981. bioRxiv. 2023. Update in: EMBO J. 2023 Sep 4;42(17):e114534. doi: 10.15252/embj.2023114534. PMID: 36711558 Free PMC article. Updated. Preprint.
-
Dimerization of the CENP-A assembly factor HJURP is required for centromeric nucleosome deposition.EMBO J. 2013 Jul 31;32(15):2113-24. doi: 10.1038/emboj.2013.142. Epub 2013 Jun 14. EMBO J. 2013. PMID: 23771058 Free PMC article.
-
Centromere-specific assembly of CENP-a nucleosomes is mediated by HJURP.Cell. 2009 May 1;137(3):472-84. doi: 10.1016/j.cell.2009.02.039. Cell. 2009. PMID: 19410544 Free PMC article.
-
Orchestrating the Specific Assembly of Centromeric Nucleosomes.Prog Mol Subcell Biol. 2017;56:165-192. doi: 10.1007/978-3-319-58592-5_7. Prog Mol Subcell Biol. 2017. PMID: 28840237 Free PMC article. Review.
-
Putting CENP-A in its place.Cell Mol Life Sci. 2013 Feb;70(3):387-406. doi: 10.1007/s00018-012-1048-8. Epub 2012 Jun 23. Cell Mol Life Sci. 2013. PMID: 22729156 Free PMC article. Review.
Cited by
-
Kinetochores get a grip!J Cell Biol. 2025 Jan 6;224(1):e202411040. doi: 10.1083/jcb.202411040. Epub 2024 Dec 26. J Cell Biol. 2025. PMID: 39724259
-
Evidence that transient replication errors initiate nuclear genome mutations.Nucleic Acids Res. 2025 Jul 19;53(14):gkaf679. doi: 10.1093/nar/gkaf679. Nucleic Acids Res. 2025. PMID: 40694689 Free PMC article.
-
Probing mechanical selection in diverse eukaryotic genomes through accurate prediction of 3D DNA mechanics.bioRxiv [Preprint]. 2024 Dec 23:2024.12.22.629997. doi: 10.1101/2024.12.22.629997. bioRxiv. 2024. PMID: 39763889 Free PMC article. Preprint.
-
Binding of zebrafish lipovitellin and L1‑ORF2 increases the accessibility of L1‑ORF2 via interference with histone wrapping.Int J Mol Med. 2025 Jan;55(1):2. doi: 10.3892/ijmm.2024.5443. Epub 2024 Oct 25. Int J Mol Med. 2025. PMID: 39450563 Free PMC article.
-
Stable centromere association of the yeast histone variant Cse4 requires its essential N-terminal domain.EMBO J. 2025 Mar;44(5):1488-1511. doi: 10.1038/s44318-024-00345-5. Epub 2025 Jan 14. EMBO J. 2025. PMID: 39809842 Free PMC article.
References
-
- Beutel BA, Gold L (1992) In vitro evolution of intrinsically bent DNA. J Mol Biol 228: 803–812 - PubMed
Publication types
MeSH terms
Substances
Grants and funding
LinkOut - more resources
Full Text Sources
Molecular Biology Databases
