. 2023 Jul 3:13:1207603.
doi: 10.3389/fonc.2023.1207603. eCollection 2023.

F-ATP synthase inhibitory factor 1 regulates metabolic reprogramming involving its interaction with c-Myc and PGC1α

Affiliations

F-ATP synthase inhibitory factor 1 regulates metabolic reprogramming involving its interaction with c-Myc and PGC1α

Lishu Guo et al. Front Oncol. .

Abstract

F-ATP synthase inhibitory factor 1 (IF1) is an intrinsic inhibitor of F-ATP synthase. It is known that IF1 mediates metabolic phenotypes and cell fate, yet the molecular mechanisms through which IF1 fulfills its physiological functions are not fully understood. Ablation of IF1 favors metabolic switch to oxidative metabolism from glycolysis. c-Myc and PGC1α are critical for metabolic reprogramming. This work identified that IF1 interacted with Thr-58 phosphorylated c-Myc, which might thus mediate the activity of c-Myc and promote glycolysis. The interaction of IF1 with PGC1α inhibited oxidative respiration. c-Myc and PGC1α were localized to mitochondria under mitochondrial stress in an IF1-dependent manner. Furthermore, IF1 was found to be required for the protective effect of hypoxia on c-Myc- and PGC1α-induced cell death. This study suggested that the interactions of IF1 with transcription factors c-Myc and PGC1α might be involved in IF1-regulatory metabolic reprogramming and cell fate.

Keywords: F-ATP synthase inhibitory factor 1; PGC1α; c-Myc; metabolic reprogramming; mitochondria; p-c-Myc.


Conflict of interest statement

The authors declare that the research was conducted in the absence of any commercial or financial relationships that could be construed as a potential conflict of interest.

Figures

Figure 1
Figure 1
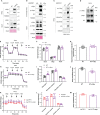
Ablation of IF1 promotes metabolic reprogramming to OXPHOS. (A) Representative blots of protein extracts of indicated cell lines analyzed by Western blotting (WB). (B) Expression of IF1 in HCT116 clonal cells after disruption of ATPIF1 gene with sgRNA-1 using the CRISPR/Cas9 technique. Colony 2 (number in bold) was selected for the following experiments. (C) Cellular protein extracts were analyzed by WB. OXPHOS (D–I) and glycolysis (G–I) activities were evaluated by Agilent Seahorse XFe24 Analyzer before and after additions of oligomycin (Oligo, 2 µM), FCCP (0.25 µM), rotenone plus antimycin A (Rot/AA, 1 µM), and 2-DG (50 mM). OCR values (pmol/min) were normalized for protein (µg). (D) Representative traces of OCR values (pmol/min/µg) in wild-type (WT, black trace) and IF1 KO (ΔATPIF1, red trace). (E) OCR values (pmol/min/µg) in WT (black column) and ΔATPIF1 (red column). In groups of Basal, Oligo, and FCCP, the OCR values were subtracted for Rot/AA. Data are expressed as mean ± SD. *** p < 0.001 vs. WT, two-way ANOVA with Bonferroni post-hoc test. (F) Oligomycin-sensitive respiration was expressed as mean ± SD. *** p < 0.001 vs. WT, one-way ANOVA with Bonferroni post-hoc test. (G, H) ECAR values (mpH/min) were normalized for protein (µg). (G) Representative traces of ECAR values (mpH/min/µg) in wild-type (WT, black trace) and IF1 KO (ΔATPIF1, red trace). (H) ECAR values (mpH/min/µg) were subtracted for 2-DG and expressed as mean ± SD. ** p < 0.01 vs. WT, *** p < 0.001 vs. WT, two-way ANOVA with Bonferroni post-hoc test. (I) Ratio of basal OCR value and basal ECAR value. *** p < 0.001 vs. WT, one-way ANOVA with Bonferroni post-hoc test.
Figure 2
Figure 2
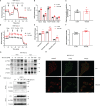
IF1 participates in enhanced glycolysis driven by c-Myc. (A, C) HEK293T cells were transfected with empty vector (EV) or plasmids carrying ATPIF1 and incubated for 24 h. In (A), cells were lysed for coIP and WB. In panel C, isolated mitochondria (mito) were lysed for coIP and WB. (B) HEK293T cells were lysed for coIP and WB. In negative control (NC), only Protein A/G Plus Agarose Beads and ATPIF1 antibody were incubated with coIP buffer at 4°C overnight. In IF1, Protein A/G Plus Agarose Beads and ATPIF1 antibody were incubated with cell lysate at 4°C overnight. PonS indicated the ponceau S staining of transferred membraned. (D–J) WT HeLa cells were transfected with EV or plasmids carrying c-Myc and incubated for 24 h. (D) Cells were collected from XF24 Cell Culture Microplates after Seahorse experiment and lysed for WB. OXPHOS (E–J) and glycolysis (H–J) activities were evaluated by Agilent Seahorse XFe24 Analyzer before and after the addition of oligomycin (Oligo, 2 µM), FCCP (0.25 µM), rotenone plus antimycin A (Rot/AA, 1 µM), and 2-DG (50 mM). OCR values (pmol/min) were normalized for protein (µg). (E) Representative traces of OCR values (pmol/min/µg) in HeLa cells transfected with EV (black trace) and plasmids carrying c-Myc (purple trace). (F) OCR values (pmol/min/µg) were subtracted for Rot/AA and expressed as mean ± SD. (G) Oligomycin-sensitive respiration was expressed as mean ± SD. (H, I) ECAR values (mpH/min) were normalized for protein (µg). (H) Representative traces of ECAR values (mpH/min/µg) in WT HeLa cells transfected with EV (black trace) and plasmids carrying c-Myc (purple trace). (I) ECAR values (mpH/min/µg) were subtracted for 2-DG and expressed as mean ± SD. * p < 0.05 vs. EV, *** p < 0.001 vs. EV, two-way ANOVA with Bonferroni post-hoc test. (J) Ratio of basal OCR value and basal ECAR value in WT HeLa cells. *** p < 0.001 vs. EV, one-way ANOVA with Bonferroni post-hoc test. (K–M) Glycolysis activities of ΔATPIF1 HeLa cells. (K, L) ECAR values (mpH/min) were normalized for protein (µg). (K) Representative traces of ECAR values (mpH/min/µg) in ΔATPIF1 HeLa cells transfected with EV (red trace) and plasmids carrying c-Myc (violet trace). (L) ECAR values (mpH/min/µg) were subtracted for 2-DG and expressed as mean ± SD. (M) Ratio of basal OCR value and basal ECAR value in ΔATPIF1 HeLa cells.
Figure 3
Figure 3
High glucose promotes cellular metabolism involving stimulation of c-Myc localization to mitochondria and its interactions with IF1. (A–F) OXPHOS (A–C, F) and glycolysis (D–F) activities were evaluated by Agilent Seahorse XFe24 Analyzer before and after additions of oligomycin (Oligo, 2 µM), FCCP (0.2 µM), rotenone plus antimycin A (Rot/AA, 1 µM), and 2-DG (50 mM). MIA PaCa-2 cells were suspended in DMEM (no sodium pyruvate, no glucose, Gibco #11966025) supplemented with 10% FBS and seeded in XF24 microplates at 1.6×10⁴ cells/well, then incubated at 37°C in a 5% CO2 humidified incubator 24 h later, and cells were treated with indicated concentrations of glucose for 48 h. OCR values (pmol/min) and ECAR values (mpH/min) were normalized for protein (µg). (A) Representative traces of OCR values (pmol/min/µg) of MIA PaCa-2 cells cultured in DMEM medium without glucose (black trace) and in DMEM medium with 100 mM glucose (red trace). (B) OCR values (pmol/min) were normalized for protein (µg) and expressed as OCR (pmol/min/µg). In groups of Basal, Oligo, and FCCP, the OCR values were subtracted for Rot/AA. Data are expressed as mean ± SD. ** p < 0.01 vs. 0 mM, *** p < 0.001 vs. 0 mM, two-way ANOVA with Bonferroni post-hoc test. (C) oligomycin-sensitive respiration was expressed as mean ± SD. (D–F) ECAR values (mpH/min) were normalized for protein (µg). (D) Representative traces of ECAR values (mpH/min/µg) of MIA PaCa-2 cells cultured in DMEM medium without glucose (black trace) and in DMEM medium with 100 mM glucose (red trace). (E) ECAR values (mpH/min/µg) were subtracted for 2-DG and expressed as mean ± SD. ** p < 0.01 vs. 0 mM, *** p < 0.001 vs. 0 mM, two-way ANOVA with Bonferroni post-hoc test. (F) Ratio of basal OCR value and basal ECAR value. *** p < 0.001 vs. 0 mM, one-way ANOVA with Bonferroni post-hoc test. (G–I) MIA PaCa-2 cells were cultured in DMEM (no sodium pyruvate, no glucose, Gibco #11966025) supplemented with 10% FBS. (G) Representative blots of protein extracts of isolated mitochondria (mito) and cytosolic fraction (cyto) from MIA PaCa-2 cells treated by indicated concentrations of glucose for 48 h. (H) Representative immunofluorescence images (scale bar: 36.8 µm) of MIA PaCa-2 cells treated without (CTL) or with 200 mM glucose for 48 h. Cells were stained with anti-TOM20 (red) and anti-c-Myc (green). (I) MIA PaCa-2 cells were treated by indicated concentrations of glucose for 48 h and transfected with EV or plasmids carrying ATPIF1 for 24 h. Cells were collected and lysed for coIP and WB. The blots are representative of three independent experiments.
Figure 4
Figure 4
IF1 binds to PGC1α and inhibits mitochondrial oxidative respiration. (A) Representative immunofluorescence images (scale bar: 10 µm) of HEK293T cells stained with anti-IF1 (red) and anti-PGC1α (green), and co-labeled with DAPI (blue). (B) HEK293T cells were transfected with EV or plasmids carrying ATPIF1 and incubated for 24 h. Cells were lysed for coIP and WB. (C) HEK293T cells were lysed for coIP and WB. In NC, only Protein A/G Plus Agarose Beads and ATPIF1 antibody were incubated with coIP buffer at 4°C overnight. In IF1, Protein A/G Plus Agarose Beads and ATPIF1 antibody were incubated with cell lysate at 4°C overnight. PonS indicated the ponceau S staining of transferred membranes. (D–I) ΔATPIF1 HCT116 cells were transfected with plasmids carrying c-MycATPIF1+c-Myc) or PPARGC1A (encoding PGC1α) (ΔATPIF1+PGC1α), and WT HCT116 cells were transfected with plasmid carrying PPARGC1A (WT+PGC1α), then co-cultured for 24 h. OXPHOS (D–I) and glycolysis (G–I) activities were evaluated by Agilent Seahorse XFe24 Analyzer before and after the addition of oligomycin (Oligo, 2 µM), FCCP (0.25 µM), rotenone plus antimycin A (Rot/AA, 1 µM), and 2-DG (50 mM). OCR values (pmol/min) were normalized for protein (µg). (D) Representative traces of OCR values (pmol/min/µg) in ΔATPIF1+c-Myc (purple trace), ΔATPIF1+PGC1α (blue trace), and WT+PGC1α (gray trace). (E) OCR values (pmol/min/µg) were subtracted for Rot/AA and expressed as mean ± SD. *** p < 0.001 vs. ΔATPIF1+PGC1α, two-way ANOVA with Bonferroni post-hoc test. (F) oligomycin-sensitive respiration was expressed as mean ± SD. *** p < 0.001 vs. ΔATPIF1+PGC1α, one-way ANOVA with Bonferroni post-hoc test. (G, H) ECAR values (mpH/min) were normalized for protein (µg). (G) Representative traces of ECAR values (mpH/min/µg) in ΔATPIF1+c-Myc (purple trace), ΔATPIF1+PGC1α (blue trace), and WT+PGC1α (gray trace). (H) ECAR values (mpH/min/µg) were subtracted for 2-DG and expressed as mean ± SD. *** p < 0.001 vs. ΔATPIF1+PGC1α, two-way ANOVA with Bonferroni post-hoc test. (I) Ratio of basal OCR value and basal ECAR value. ** p < 0.01 vs. ΔATPIF1+PGC1α, *** p < 0.001 vs. ΔATPIF1+PGC1α, one-way ANOVA with Bonferroni post-hoc test.
Figure 5
Figure 5
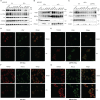
The presence of IF1 is required for c-Myc and PGC1α imported into mitochondria under mitochondrial stress. (A) Representative blots of protein extracts of HEK293T cells treated by equivalent DMSO (Control), 10 µM rotenone (Rot), 10 µM antimycin A (AA), 10 µM oligomycin (Oligo), 0.2 mM CoCl2, and 10 µM FCCP for 6 h or 24 h. The blots are representative of three independent experiments. (B) Representative blots of protein extracts of isolated mitochondria (mito) and cytosolic fraction (cyto) from HEK293T cells treated by Control, Rot, AA, Oligo, CoCl2, and FCCP for 6 h. The blots are representative of four independent experiments. (C) Representative blots of protein extracts of isolated mitochondria from WT and ΔATPIF1 HeLa cells treated by Control, Rot, AA, Oligo, CoCl2, and FCCP for 6 h. The blots are representative of five independent experiments. (D–G) Representative immunofluorescence images (scale bar: 10 µm) of WT (D, F) and ΔATPIF1 (E, G) HeLa cells treated by DMSO or AA for 6 h. Cells were stained with anti-TOM20 (red) and anti-c-Myc (green) or anti-PGC1α (green).
Figure 6
Figure 6
IF1 is required for the protective effect of hypoxia on c-Myc/PGC1α-induced cell death. (A, C–E) The effects of IF1/c-Myc/PGC1α overexpression and CoCl2-induced hypoxic environment on cell viability in WT and ΔATPIF1 HeLa cells revealed by MTT assay. Viable (%) was expressed as mean ± SD. * p < 0.05, ** p < 0.01, *** p < 0.001 vs. EV or WT, two-way ANOVA with Bonferroni post-hoc test. (F) The images of WT and ΔATPIF1 HeLa cells with overexpression of IF1/c-Myc/PGC1α and CoCl2 treatment for 24 h. The figures are representative of at least three independent experiments. (B) Expression of IF1 in HeLa clonal cells after disruption of ATPIF1 gene with sgRNA-2 using the CRISPR/Cas9 technique. Colony 3 (number in bold) was used for MTT assay as shown in (A, C–F). (G) HCT116 WT and IF1 KO cells were transfected with EV or plasmids carrying ATPIF1 for IF1 overexpression (IF1 OE), then incubated for 24 h, followed by MitoSOX staining.

Similar articles

References

    1. Pullman ME, Monroy GC. A naturally occurring inhibitor of mitochondrial adenosine triphosphatase occurring adenosine inhibitor of mitochondrial triphosphatase. J Biol Chem (1963) 238:3762–9. - PubMed
    1. Cabezon E, Butler PJG, Runswick MJ, Walker JE. Modulation of the oligomerization state of the bovine F1-ATPase inhibitor protein, IF1, by pH. J Biol Chem (2000) 275:25460–4. doi: 10.1074/jbc.M003859200 - DOI - PubMed
    1. Walker JE. The regulation of catalysis in ATP synthase. Curr Opin Struct Biol (1994) 4:912–8. doi: 10.1016/0959-440X(94)90274-7 - DOI - PubMed
    1. Aggeler R, Coons J, Taylor SW, Ghosh SS, García JJ, Capaldi RA, et al. . A functionally active human F1F0 ATPase can be purified by immunocapture from heart tissue and fibroblast cell lines. subunit structure and activity studies. J Biol Chem (2002) 277:33906–12. doi: 10.1074/jbc.M204538200 - DOI - PubMed
    1. García-Bermúdez J, Sánchez-Aragó M, Soldevilla B, del Arco A, Nuevo-Tapioles C, Cuezva JM. PKA phosphorylates the ATPase inhibitory factor 1 and inactivates its capacity to bind and inhibit the mitochondrial h+-ATP synthase. Cell Rep (2015) 12:2143–55. doi: 10.1016/j.celrep.2015.08.052 - DOI - PubMed

LinkOut - more resources