

Exploration of prognosis and immunometabolism landscapes in ER+ breast cancer based on a novel lipid metabolism-related signature
- PMID: 37469520
- PMCID: PMC10352658
- DOI: 10.3389/fimmu.2023.1199465
Exploration of prognosis and immunometabolism landscapes in ER+ breast cancer based on a novel lipid metabolism-related signature
Abstract
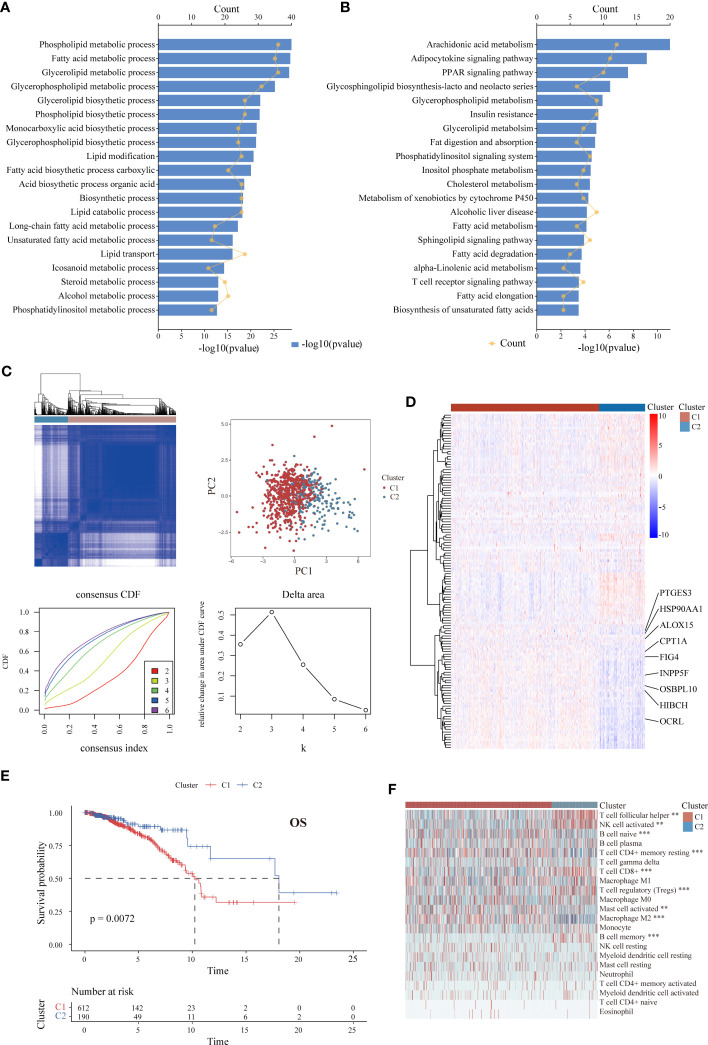
Introduction: Lipid metabolic reprogramming is gaining attention as a hallmark of cancers. Recent mounting evidence indicates that the malignant behavior of breast cancer (BC) is closely related to lipid metabolism. Here, we focus on the estrogen receptor-positive (ER+) subtype, the most common subgroup of BC, to explore immunometabolism landscapes and prognostic significance according to lipid metabolism-related genes (LMRGs).
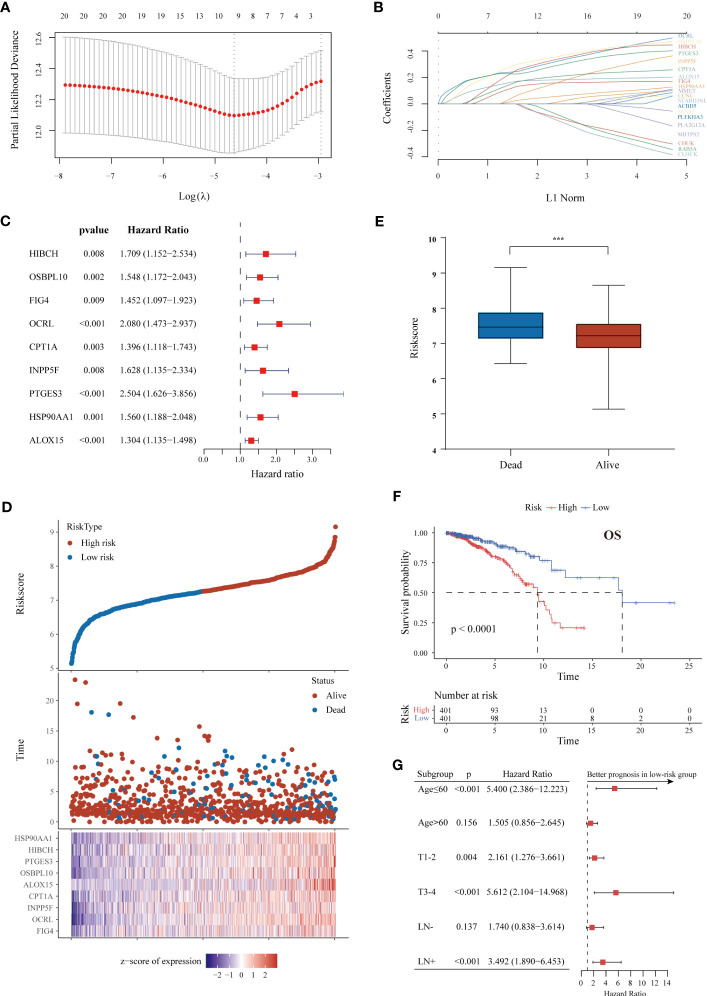
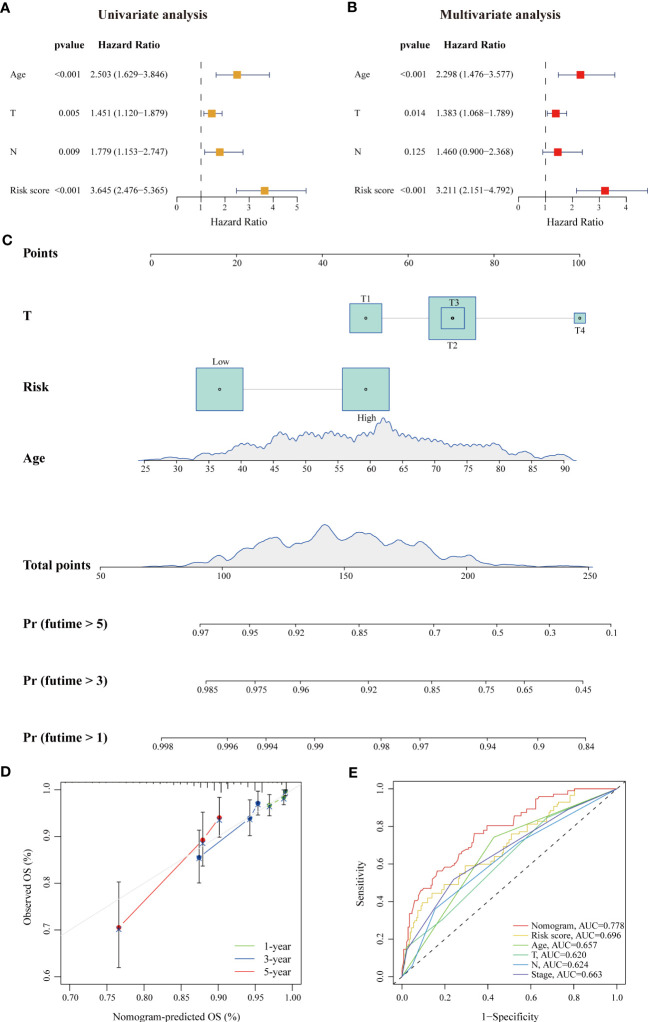
Methods: Samples from The Cancer Genome Atlas (TCGA) database were used as training cohort, and samples from the Molecular Taxonomy of Breast Cancer International Consortium (METABRIC), Gene Expression Omnibus (GEO) datasets and our cohort were applied for external validation. The survival-related LMRG molecular pattern and signature were constructed by unsupervised consensus clustering and least absolute shrinkage and selection operator (LASSO) analysis. A lipid metabolism-related clinicopathologic nomogram was established. Gene enrichment and pathway analysis were performed to explore the underlying mechanism. Immune landscapes, immunotherapy and chemotherapy response were further explored. Moreover, the relationship between gene expression and clinicopathological features was assessed by immunohistochemistry.
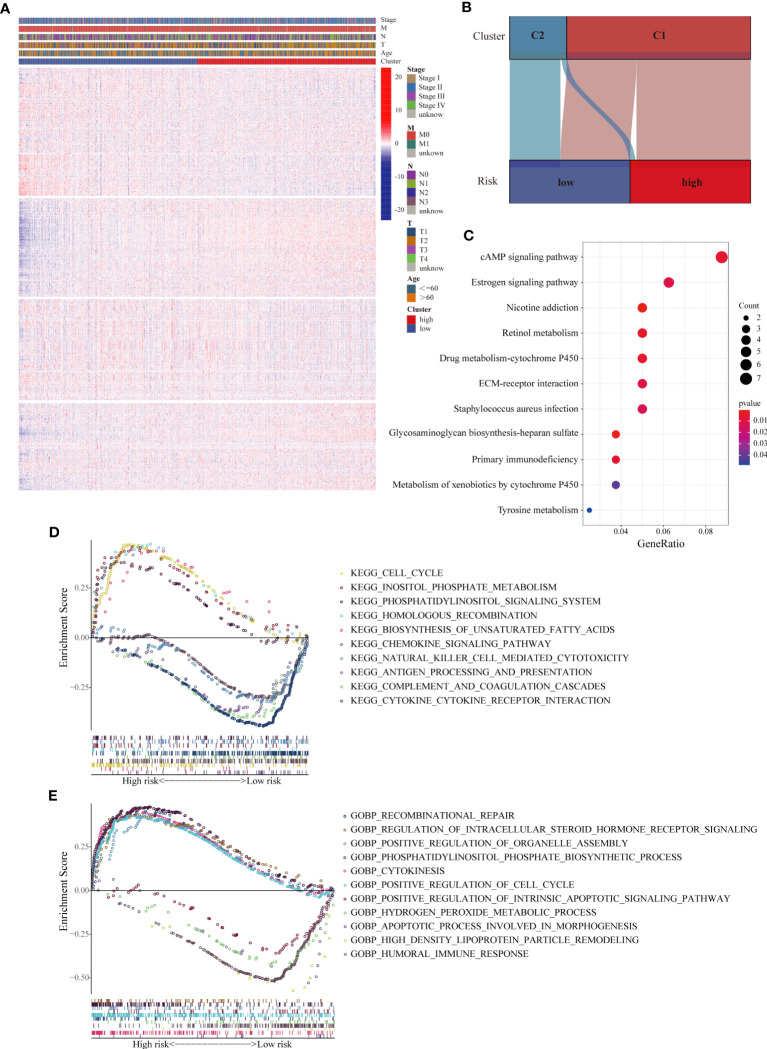
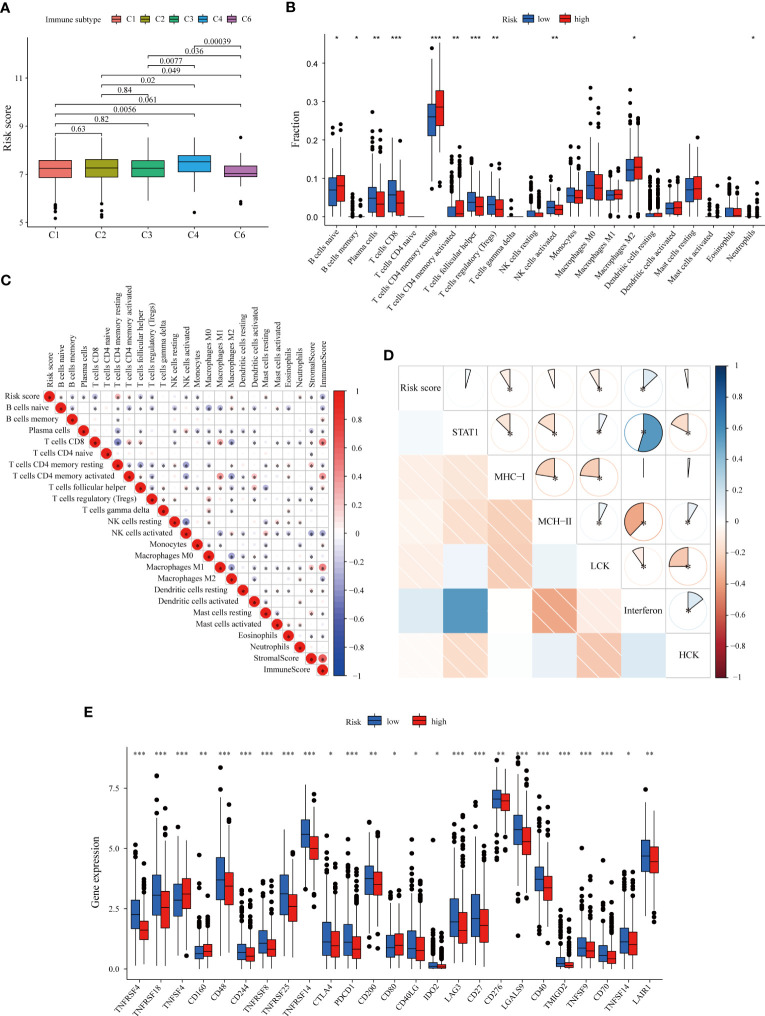
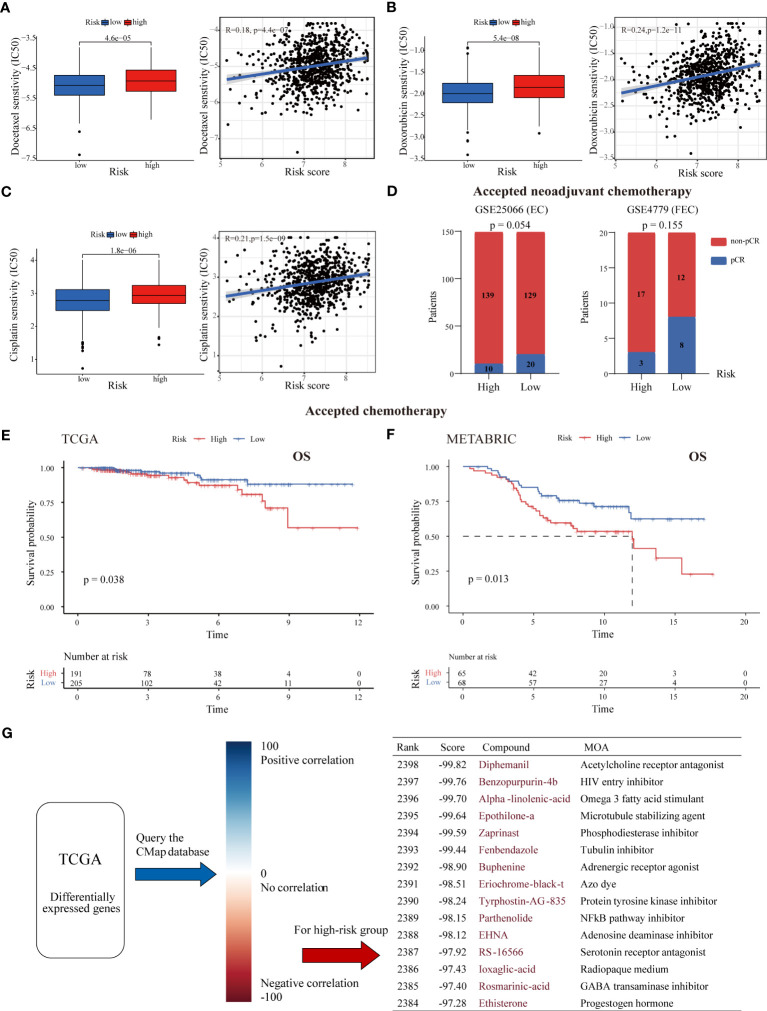
Results: Two LMRG molecular patterns were identified and associated with distinct prognoses and immune cell infiltration. Next, a prognostic signature based on nine survival-related LMRGs was established and validated. The signature was confirmed to be an independent prognostic factor and an optimal nomogram incorporating age and T stage (AUC of 5-year overall survival: 0.778). Pathway enrichment analysis revealed differences in immune activities, lipid biosynthesis and drug metabolism by comparing groups with low- and high-risk scores. Further exploration verified different immune microenvironment profiles, immune checkpoint expression, and sensitivity to immunotherapy and chemotherapy between the two groups. Finally, arachidonate 15-lipoxygenase (ALOX15) was selected as the most prominent differentially expressed gene between the two groups. Its expression was positively related to larger tumor size, more advanced tumor stage and vascular invasion in our cohort (n = 149).
Discussion: This is the first lipid metabolism-based signature with value for prognosis prediction and immunotherapy or chemotherapy guidance for ER+ BC.
Keywords: estrogen receptor-positive breast cancer; lipid metabolism; prognostic signature; therapy response; tumor immune microenvironment.
Copyright © 2023 Shen, Huang, Li, Chen, Yao, Hu, Zhou, Huang and Ni.
Conflict of interest statement
The authors declare that the research was conducted in the absence of any commercial or financial relationships that could be construed as a potential conflict of interest.
Figures
Similar articles
-
Clinical Significance and Immunometabolism Landscapes of a Novel Recurrence-Associated Lipid Metabolism Signature In Early-Stage Lung Adenocarcinoma: A Comprehensive Analysis.Front Immunol. 2022 Feb 10;13:783495. doi: 10.3389/fimmu.2022.783495. eCollection 2022. Front Immunol. 2022. PMID: 35222371 Free PMC article.
-
Establishment and validation of an aging-related risk signature associated with prognosis and tumor immune microenvironment in breast cancer.Eur J Med Res. 2022 Dec 29;27(1):317. doi: 10.1186/s40001-022-00924-4. Eur J Med Res. 2022. PMID: 36581948 Free PMC article.
-
Comprehensive FGFR3 alteration-related transcriptomic characterization is involved in immune infiltration and correlated with prognosis and immunotherapy response of bladder cancer.Front Immunol. 2022 Jul 26;13:931906. doi: 10.3389/fimmu.2022.931906. eCollection 2022. Front Immunol. 2022. PMID: 35958598 Free PMC article.
-
Lipid metabolic reprograming: the unsung hero in breast cancer progression and tumor microenvironment.Mol Cancer. 2025 Mar 3;24(1):61. doi: 10.1186/s12943-025-02258-1. Mol Cancer. 2025. PMID: 40025508 Free PMC article. Review.
-
The impact of lipid metabolism on breast cancer: a review about its role in tumorigenesis and immune escape.Cell Commun Signal. 2023 Jun 27;21(1):161. doi: 10.1186/s12964-023-01178-1. Cell Commun Signal. 2023. PMID: 37370164 Free PMC article. Review.
Cited by
-
Exploring lipidomic profiles and their correlation with hormone receptor and HER2 status in breast cancer.Oncol Lett. 2024 Oct 29;29(1):34. doi: 10.3892/ol.2024.14781. eCollection 2025 Jan. Oncol Lett. 2024. PMID: 39512509 Free PMC article.
-
Analyzing the impact of metabolism on immune cells in tumor microenvironment to promote the development of immunotherapy.Front Immunol. 2024 Jan 8;14:1307228. doi: 10.3389/fimmu.2023.1307228. eCollection 2023. Front Immunol. 2024. PMID: 38264667 Free PMC article. Review.
-
Identification of hub genes significantly linked to tuberous sclerosis related-epilepsy and lipid metabolism via bioinformatics analysis.Front Neurol. 2024 Feb 14;15:1354062. doi: 10.3389/fneur.2024.1354062. eCollection 2024. Front Neurol. 2024. PMID: 38419709 Free PMC article.
-
Association of microtubule-based processes gene expression with immune microenvironment and its predictive value for drug response in oestrogen receptor-positive breast cancer.Front Immunol. 2025 Jul 30;16:1608991. doi: 10.3389/fimmu.2025.1608991. eCollection 2025. Front Immunol. 2025. PMID: 40808956 Free PMC article.
-
Current Status of Breast Cancer Immunotherapy and Prognosis-Related Markers.Breast Cancer (Dove Med Press). 2025 Apr 15;17:339-348. doi: 10.2147/BCTT.S506949. eCollection 2025. Breast Cancer (Dove Med Press). 2025. PMID: 40256248 Free PMC article. Review.
References
Publication types
MeSH terms
Substances
LinkOut - more resources
Full Text Sources
Medical