

Staphylococcus epidermidis biofilms undergo metabolic and matrix remodeling under nitrosative stress
- PMID: 37469594
- PMCID: PMC10352803
- DOI: 10.3389/fcimb.2023.1200923
Staphylococcus epidermidis biofilms undergo metabolic and matrix remodeling under nitrosative stress
Abstract
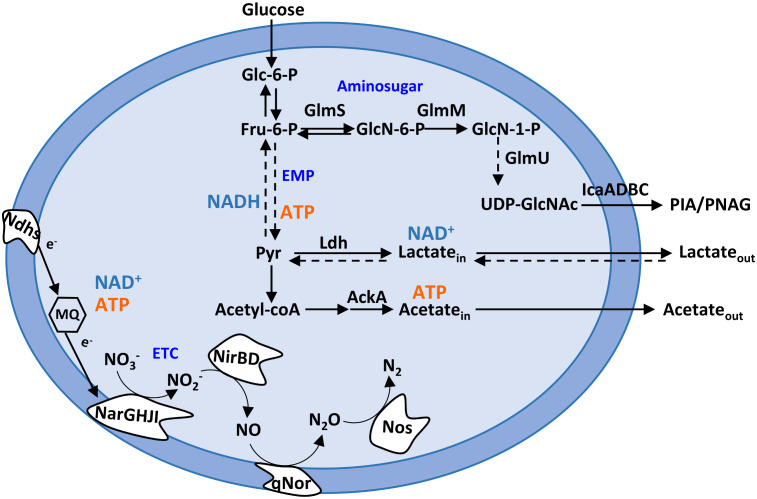
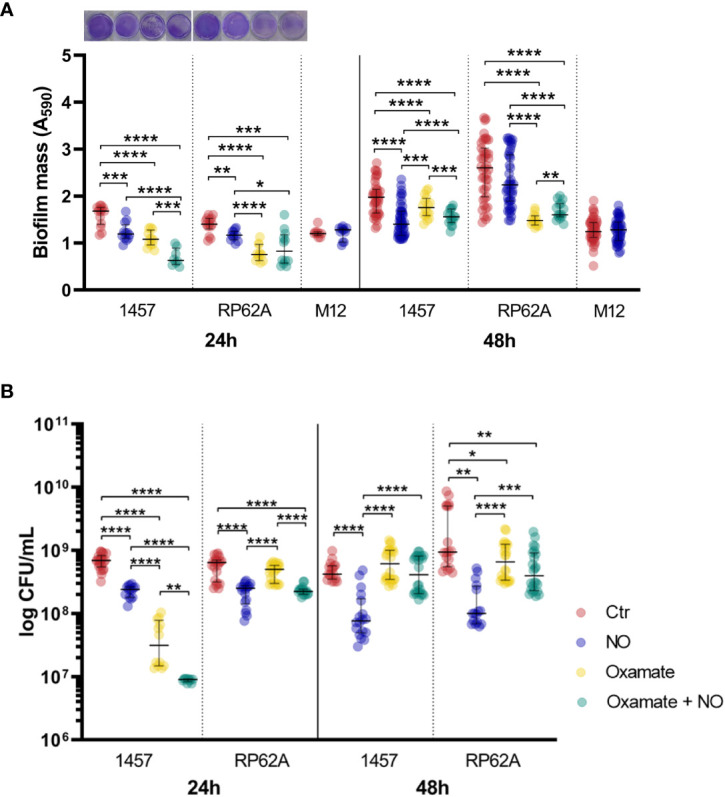
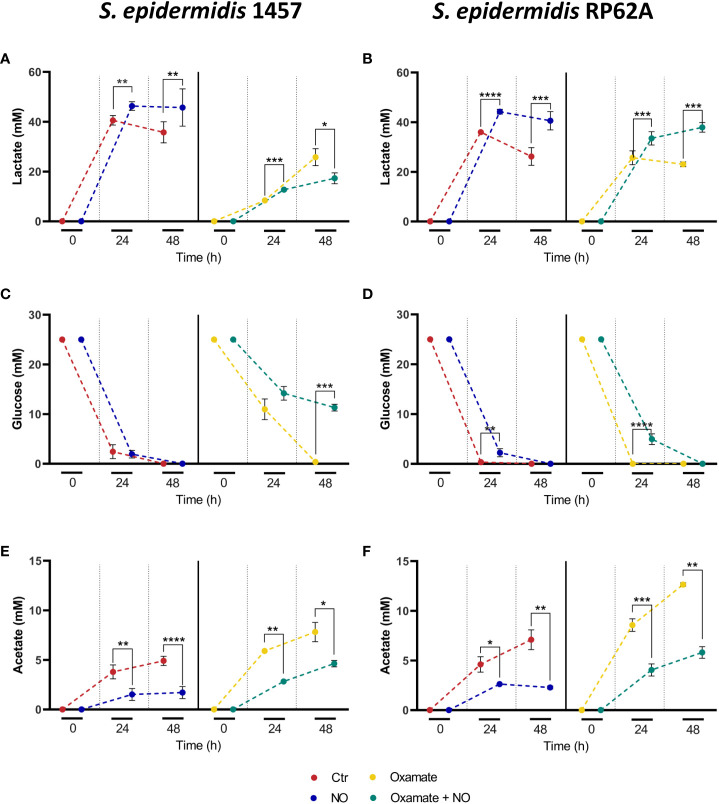
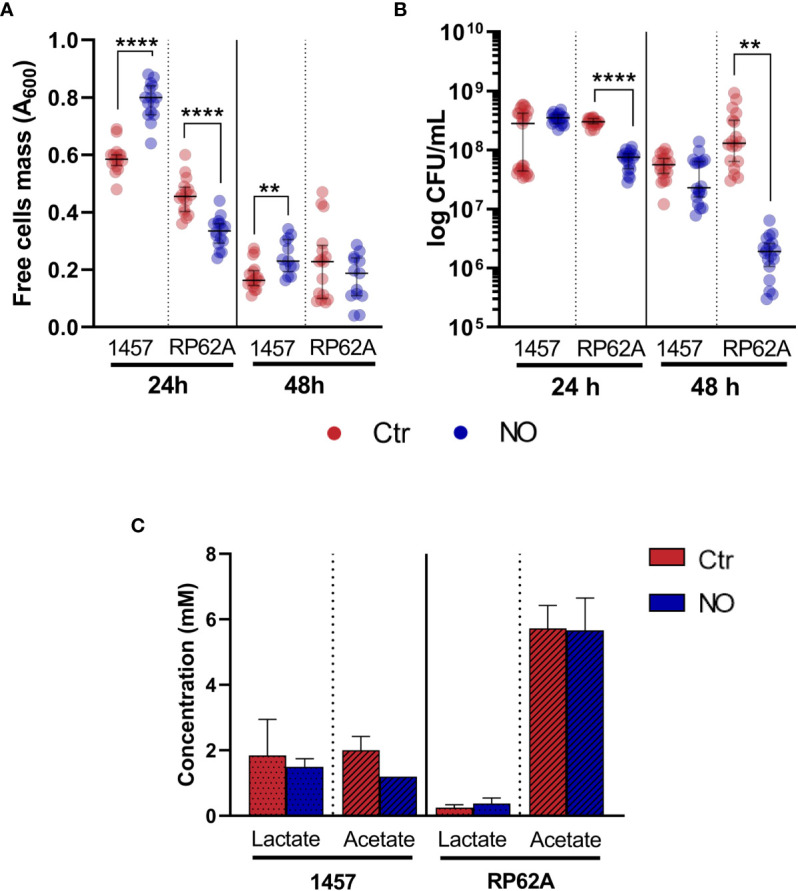
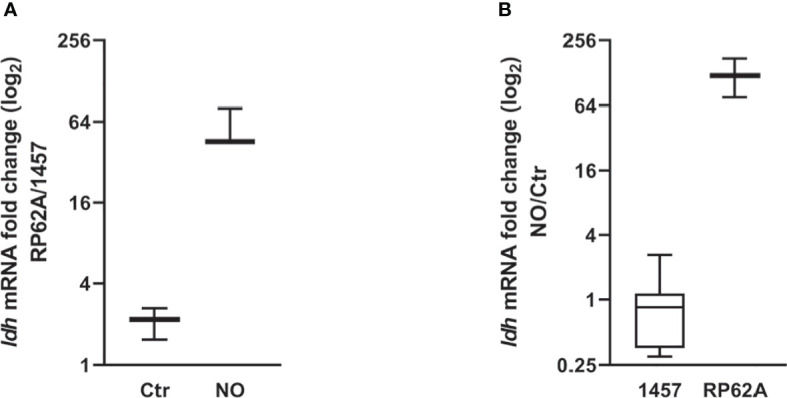
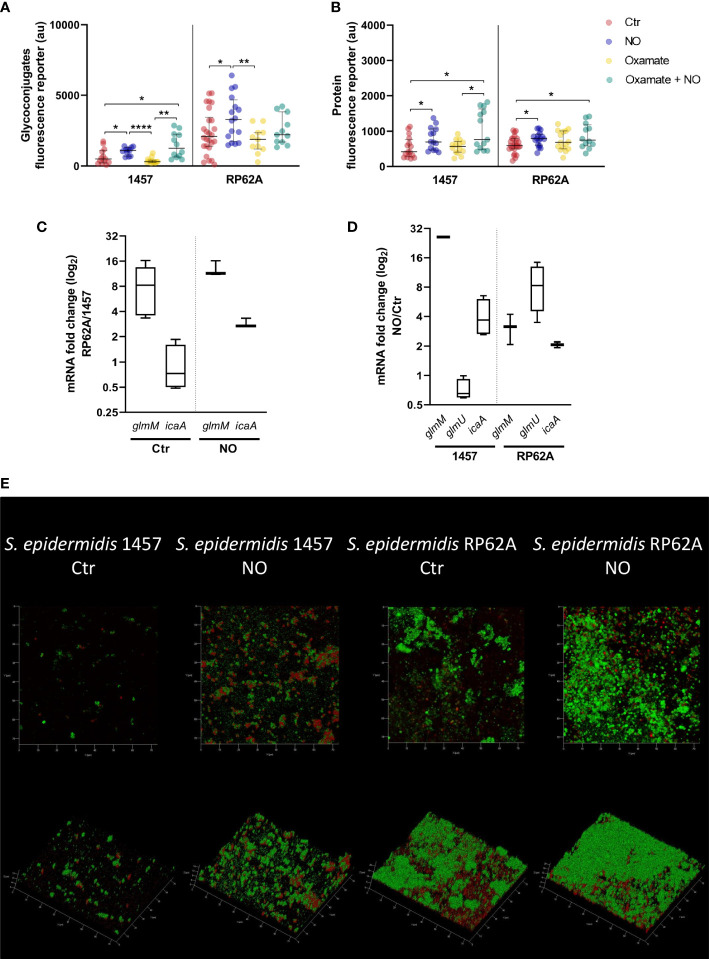
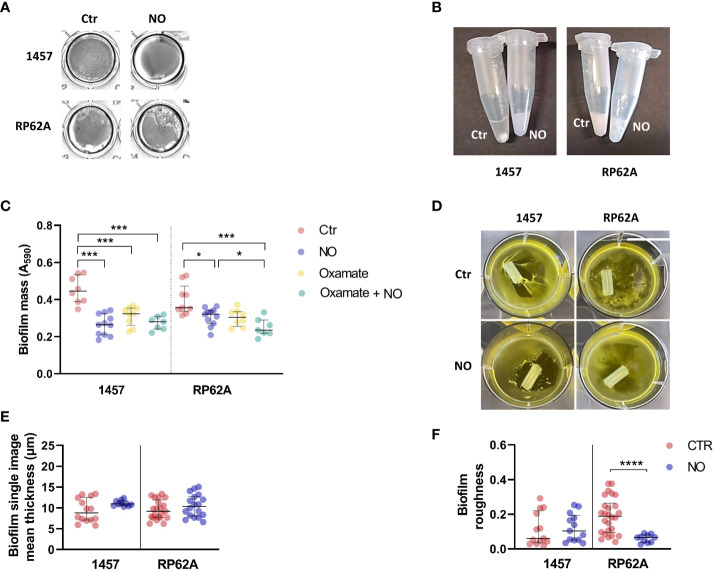
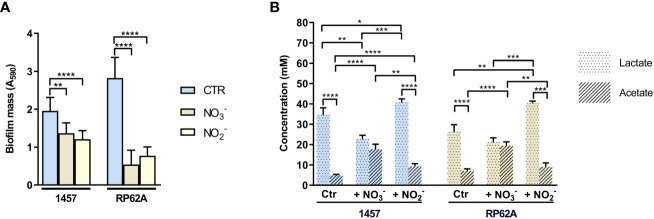
Staphylococcus epidermidis is a commensal skin bacterium that forms host- and antibiotic-resistant biofilms that are a major cause of implant-associated infections. Most research has focused on studying the responses to host-imposed stresses on planktonic bacteria. In this work, we addressed the open question of how S. epidermidis thrives on toxic concentrations of nitric oxide (NO) produced by host innate immune cells during biofilm assembly. We analyzed alterations of gene expression, metabolism, and matrix structure of biofilms of two clinical isolates of S. epidermidis, namely, 1457 and RP62A, formed under NO stress conditions. In both strains, NO lowers the amount of biofilm mass and causes increased production of lactate and decreased acetate excretion from biofilm glucose metabolism. Transcriptional analysis revealed that NO induces icaA, which is directly involved in polysaccharide intercellular adhesion (PIA) production, and genes encoding proteins of the amino sugar pathway (glmM and glmU) that link glycolysis to PIA synthesis. However, the strains seem to have distinct regulatory mechanisms to boost lactate production, as NO causes a substantial upregulation of ldh gene in strain RP62A but not in strain 1457. The analysis of the matrix components of the staphylococcal biofilms, assessed by confocal laser scanning microscopy (CLSM), showed that NO stimulates PIA and protein production and interferes with biofilm structure in a strain-dependent manner, but independently of the Ldh level. Thus, NO resistance is attained by remodeling the staphylococcal matrix architecture and adaptation of main metabolic processes, likely providing in vivo fitness of S. epidermidis biofilms contacting NO-proficient macrophages.
Keywords: Staphylococcus epidermidis; biofilm metabolism; confocal laser scanning microscopy (CLSM); nitrosative stress; nuclear magnetic resonance (NMR).
Copyright © 2023 Oliveira, Saraiva and Carvalho.
Conflict of interest statement
The authors declare that the research was conducted in the absence of any commercial or financial relationships that could be construed as a potential conflict of interest.
Figures
 ,
,  ) and
) and  ,
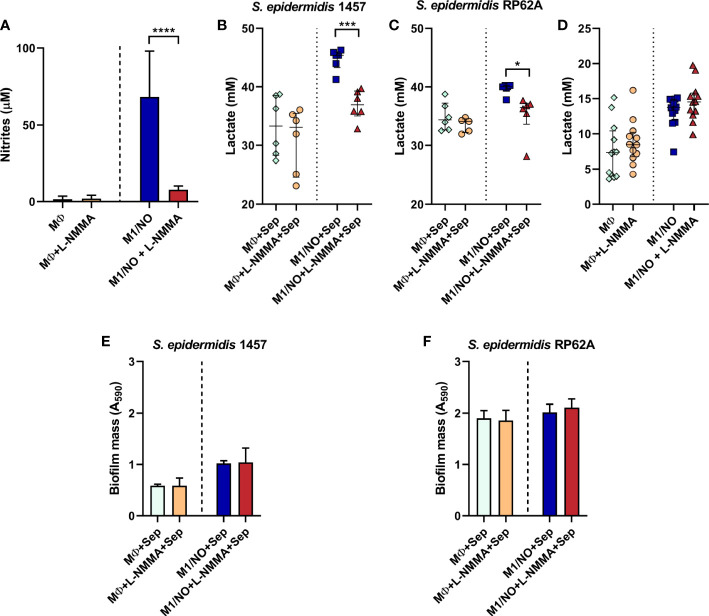
,  ), M1-activated (, ), and non-activated (, ) macrophages (MØ) co-cultivated with S. epidermidis strains 1457 (B) and RP62A (C) in inserts/transwells for 24 h in high-glucose DMEM/FBS medium. (D) Lactate accumulation in the supernatants of , ) and , ), M1-activated (, ), and non-activated (, ) macrophages (MØ) grown for 24 h. Nitrites were determined by the Griess method, and lactate concentrations were determined by 1H-NMR. (E, F) Biofilm formed by S. epidermidis 1457 (E) and RP62A (F) grown for 24 h in high-glucose DMEM/FBS medium in the presence of M1-activated (dark blue and red bars) and MØ non-activated (light blue and orange bars) macrophages that were untreated (light and dark blue bars) or
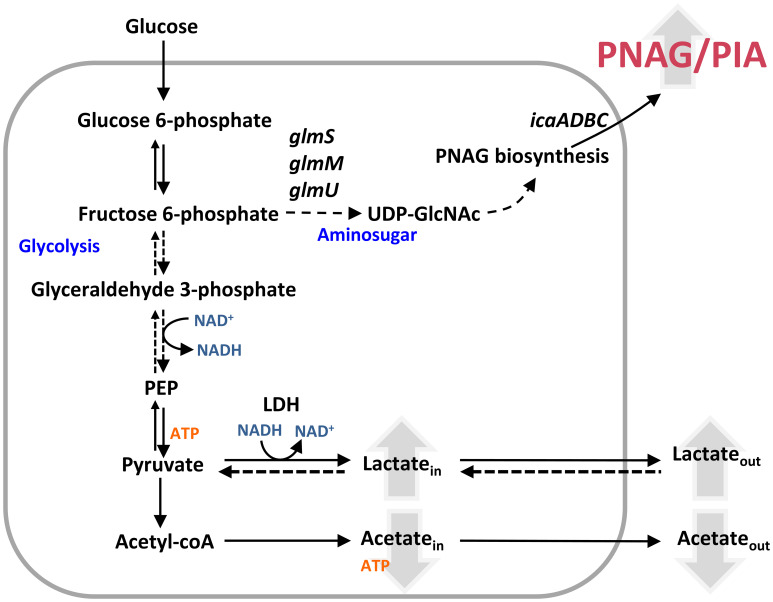
Similar articles
-
The small non-coding RNA RsaE influences extracellular matrix composition in Staphylococcus epidermidis biofilm communities.PLoS Pathog. 2019 Mar 14;15(3):e1007618. doi: 10.1371/journal.ppat.1007618. eCollection 2019 Mar. PLoS Pathog. 2019. PMID: 30870530 Free PMC article.
-
Host factors abolish the need for polysaccharides and extracellular matrix-binding protein in Staphylococcus epidermidis biofilm formation.J Med Microbiol. 2021 Mar;70(3):001287. doi: 10.1099/jmm.0.001287. Epub 2021 Jan 22. J Med Microbiol. 2021. PMID: 33492206 Free PMC article.
-
Does Extracellular DNA Production Vary in Staphylococcal Biofilms Isolated From Infected Implants versus Controls?Clin Orthop Relat Res. 2017 Aug;475(8):2105-2113. doi: 10.1007/s11999-017-5266-0. Epub 2017 Feb 13. Clin Orthop Relat Res. 2017. PMID: 28194715 Free PMC article.
-
Polysaccharide intercellular adhesin in biofilm: structural and regulatory aspects.Front Cell Infect Microbiol. 2015 Feb 10;5:7. doi: 10.3389/fcimb.2015.00007. eCollection 2015. Front Cell Infect Microbiol. 2015. PMID: 25713785 Free PMC article. Review.
-
Structural basis of Staphylococcus epidermidis biofilm formation: mechanisms and molecular interactions.Front Cell Infect Microbiol. 2015 Feb 17;5:14. doi: 10.3389/fcimb.2015.00014. eCollection 2015. Front Cell Infect Microbiol. 2015. PMID: 25741476 Free PMC article. Review.
Cited by
-
The Metabolic Potential of the Human Lung Microbiome.Microorganisms. 2024 Jul 17;12(7):1448. doi: 10.3390/microorganisms12071448. Microorganisms. 2024. PMID: 39065215 Free PMC article.
-
In vitro evaluation of microbial D- and L-lactate production as biomarkers of infection.Front Microbiol. 2024 Aug 8;15:1406350. doi: 10.3389/fmicb.2024.1406350. eCollection 2024. Front Microbiol. 2024. PMID: 39176282 Free PMC article.
-
Multitasking functions of bacterial extracellular DNA in biofilms.J Bacteriol. 2024 Apr 18;206(4):e0000624. doi: 10.1128/jb.00006-24. Epub 2024 Mar 6. J Bacteriol. 2024. PMID: 38445859 Free PMC article. Review.
-
Antibacterial, antifungal, and antibiofilm activities of biogenic zinc nanoparticles against pathogenic microorganisms.Front Cell Infect Microbiol. 2025 Jul 14;15:1545119. doi: 10.3389/fcimb.2025.1545119. eCollection 2025. Front Cell Infect Microbiol. 2025. PMID: 40727704 Free PMC article.
References
Publication types
MeSH terms
LinkOut - more resources
Full Text Sources
Medical