. 2023 Jul 3:11:1199780.
doi: 10.3389/fped.2023.1199780. eCollection 2023.

Identification of miRNAs in extracellular vesicles as potential diagnostic markers for pediatric epilepsy and drug-resistant epilepsy via bioinformatics analysis

Affiliations

Identification of miRNAs in extracellular vesicles as potential diagnostic markers for pediatric epilepsy and drug-resistant epilepsy via bioinformatics analysis

Yucai Ruan et al. Front Pediatr. .

Abstract

Background: Pediatric epilepsy (PE) is a common neurological disease. However, many challenges regarding the clinical diagnosis and treatment of PE and drug-resistant epilepsy (DRE) remain unsettled. Our study aimed to identify potential miRNA biomarkers in children with epilepsy and drug-resistant epilepsy by scrutinizing differential miRNA expression profiles.

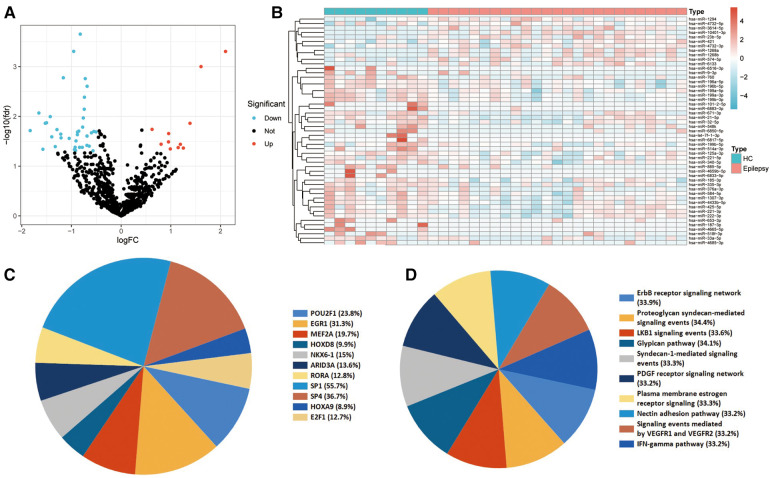
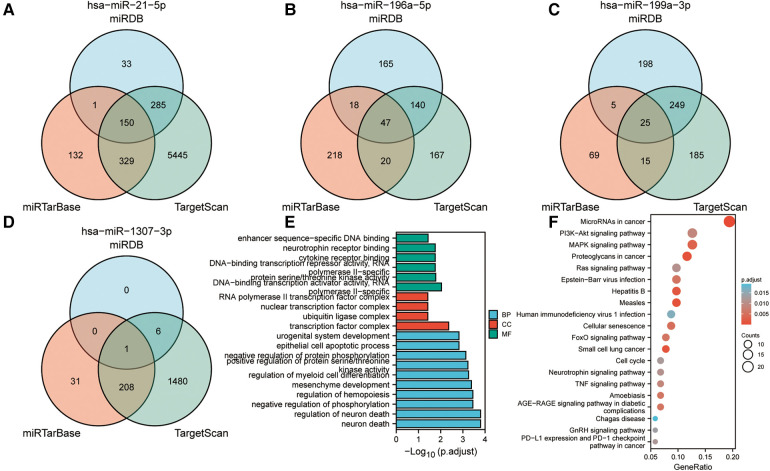
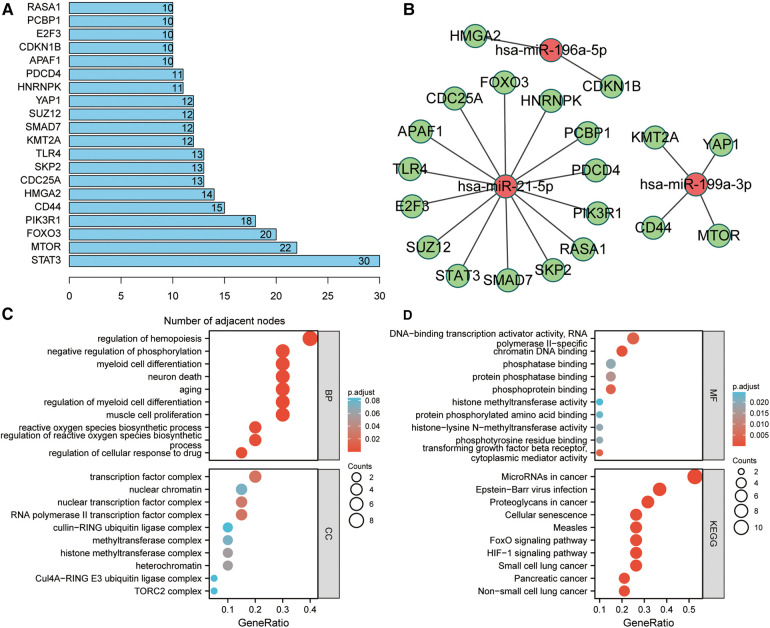
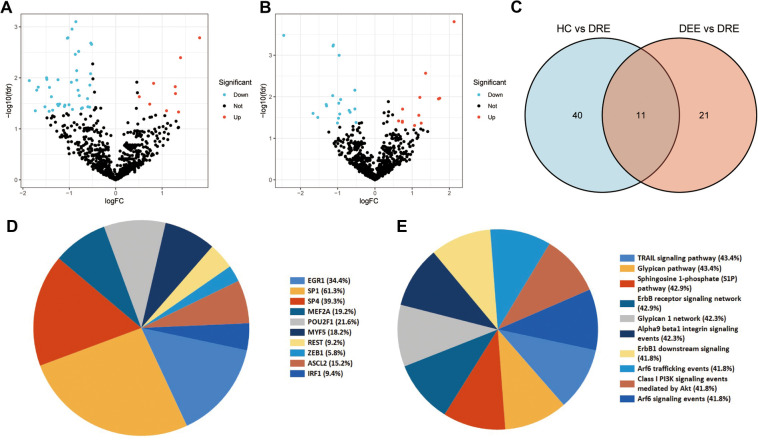
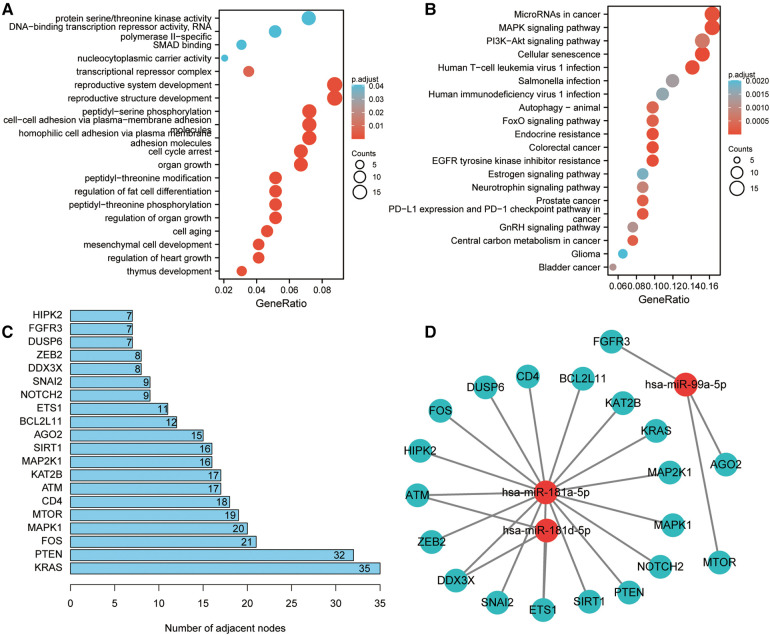
Methods: In this study, miRNA expression profiles in plasma extracellular vesicles (EV) of normal controls, children with drug-effective epilepsy (DEE), and children with DRE were obtained. In addition, differential analysis, transcription factor (TF) enrichment analysis, Gene ontology (GO) analysis and Kyoto Encyclopedia of Genes and Genomes (KEGG) enrichment analyses, and target gene prediction were used to identify specifically expressed miRNAs and their potential mechanisms of action. Potential diagnostic markers for DRE were identified using machine learning algorithms, and their diagnostic efficiency was assessed by the receiver operating characteristic curve (ROC).

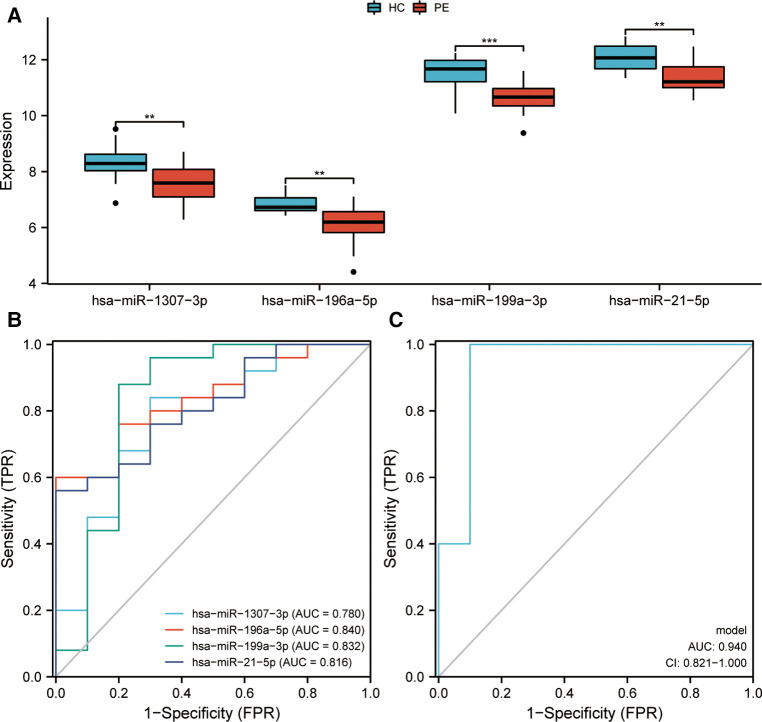
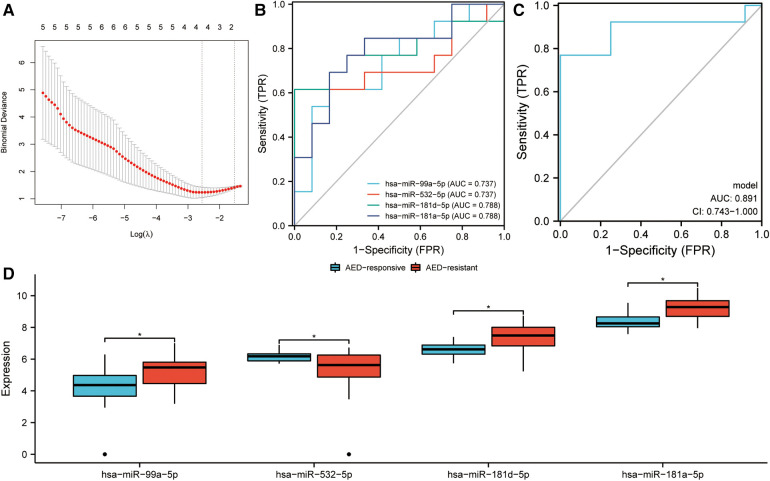
Results: The hsa-miR-1307-3p, hsa-miR-196a-5p, hsa-miR-199a-3p, and hsa-miR-21-5p were identified as diagnostic markers for PE, with values of area under curve (AUC) 0.780, 0.840, 0.832, and 0.816, respectively. In addition, the logistic regression model incorporating these four miRNAs had an AUC value of 0.940, and its target gene enrichment analysis highlighted that these miRNAs were primarily enriched in the PI3K-Akt, MAPK signaling pathways, and cell cycle. Furthermore, hsa-miR-99a-5p, hsa-miR-532-5p, hsa-miR-181d-5p, and hsa-miR-181a-5p showed good performance in differentiating children with DRE from those with DEE, with AUC values of 0.737 (0.534-0.940), 0.737 (0.523-0.952), 0.788 (0.592-0.985), and 0.788 (0.603-0.974), respectively.

Conclusion: This study characterized the expression profile of miRNAs in plasma EVs of children with epilepsy and identified miRNAs that can be used for the diagnosis of DRE.

Keywords: biomarkers; drug-resistant epilepsy; extracellular vesicles; miRNAs; pediatric epilepsy.


Conflict of interest statement

The authors declare that the research was conducted in the absence of any commercial or financial relationships that could be construed as a potential conflict of interest.

Figures

Figure 1
Figure 1
Identification and functional enrichment analyses of the differentially expressed miRNA (DEmiRNAs). (A) Differential expression of plasma EV-derived miRNAs between children with epilepsy and normal controls. The blue dots denote miRNAs that have undergone down-regulation, while the red dots indicate miRNAs that have undergone up-regulation. (B) Heat map of differential miRNA expression between children with epilepsy and normal controls. (C) Transcription factors (TFs) enrichment analysis of DEmiRNAs. TFs exhibiting P values below 0.05 were chosen for presentation. (D) Pathway enrichment analysis of DEmiRNAs. The top ten enrichment pathways were selected for display.
Figure 2
Figure 2
Identification and evaluation of markers for pediatric epilepsy (PE). (A) Expression of miRNAs between children with epilepsy and healthy control (HC). (B) Receiver Operating Characteristic (ROC) curves assessing the diagnostic efficiency of miRNAs. Area Under Curve, AUC. (C) A ROC analysis was conducted to evaluate the diagnostic efficacy of a diagnostic model that was developed through logistic regression. CI, confidence interval.
Figure 3
Figure 3
Target gene prediction of miRNA and enrichment analyses. (A) Target gene prediction of miR-21-5p, (B) miR-196-5p, (C) miR-199a-3p, and (D) miR-1307-3p. The target genes were predicted using three distinct databases, and the intersection of the predicted target genes across all three databases was visualized through a Venn diagram. (E) Gene ontology (GO) enrichment analysis of target genes. (F) Kyoto Encyclopedia of Genes and Genomes (KEGG) enrichment analysis of target genes. The presented items of enrichment exhibit a adjust P < 0.05.
Figure 4
Figure 4
Identification of key target genes and miRNA–mRNA regulatory network construction. (A) Screening of top 20 genes in terms of molecular connectivity as key target genes as per the protein-protein interaction (PPI) network, which was constructed by STRING database. Each entry's numerical value indicates the level of connectivity among its genes, with higher values indicating greater connectivity. (B) Regulatory network of key target genes and miRNAs. The correlation between miRNA and gene suggests the presence of a regulatory association between the two entities. (C,D) GO and KEGG enrichment analyses of key target genes. The presented items of enrichment exhibit a adjust P < 0.05.
Figure 5
Figure 5
Identification and enrichment analysis of differential expression miRNAs (DEmiRNAs) in children with drug-resistant epilepsy (DRE). (A) Differential expression of plasma EV-derived miRNAs between children with DRE and healthy controls (HC). (B) Differential expression of plasma EV-derived miRNAs between children with DRE and children with drug-effective epilepsy (DEE). The blue dots denote miRNAs that have undergone down-regulation, while the red dots indicate miRNAs that have undergone up-regulation. (C) Identification of DEmiRNAs in children with DRE. Venn diagrams depict the intersections of differentially expressed miRNAs between two distinct groups. (D) Enrichment analysis of transcription factors (TFs) for differentially expressed miRNAs. (E) Pathway enrichment analysis of DEmiRNAs.
Figure 6
Figure 6
Identification of diagnostic markers in children with drug-resistant epilepsy (DRE). (A) LASSO regression was used to screen potential candidate miRNAs. (B) ROC curves assessing the diagnostic potential of the miRNAs. (C) ROC curves assessing the diagnostic efficiency of the diagnostic model, which was developed through logistic regression. CI, confidence interval. (D) Expression of four miRNAs in children with DRE and drug-effective epilepsy (DEE).
Figure 7
Figure 7
Target gene enrichment analysis and miRNA regulatory network construction. (A) GO enrichment analysis of target genes. (B) KEGG enrichment analysis of target genes. (C) Screening of top 20 genes in terms of molecular connectivity as key target genes as per the protein-protein interaction (PPI) network, which was constructed by STRING database. Each entry's numerical value indicates the level of connectivity among its genes, with higher values indicating greater connectivity. (D) Regulatory network of key target genes and miRNAs. The correlation between miRNA and gene suggests the presence of a regulatory association between the two entities.

Similar articles

Cited by

References

    1. Singh G, Sander JW. The global burden of epilepsy report: implications for low- and middle-income countries. Epilepsy Behav. (2020) 105:106949. 10.1016/j.yebeh.2020.106949 - DOI - PubMed
    1. Tenney JR. Epilepsy-work-up and management in children. Semin Neurol. (2020) 40:638–46. 10.1055/s-0040-1718720 - DOI - PubMed
    1. Lin Y, Hu S, Hao X, Duan L, Wang W, Zhou D, et al. Epilepsy centers in China: current status and ways forward. Epilepsia. (2021) 62:2640–50. 10.1111/epi.17058 - DOI - PubMed
    1. Symonds JD, Elliott KS, Shetty J, Armstrong M, Brunklaus A, Cutcutache I, et al. Early childhood epilepsies: epidemiology, classification, aetiology, and socio-economic determinants. Brain. (2021) 144:2879–91. 10.1093/brain/awab162 - DOI - PMC - PubMed
    1. Abdel-Mannan O, Hughes E, Dunkley C. Epilepsy deaths in children: improvements driven by data and surveillance in pediatrics. Epilepsy Behav. (2020) 103:106493. 10.1016/j.yebeh.2019.106493 - DOI - PubMed