

Performance analysis of two typical greenhouse lettuce production systems: commercial hydroponic production and traditional soil cultivation
- PMID: 37469780
- PMCID: PMC10353484
- DOI: 10.3389/fpls.2023.1165856
Performance analysis of two typical greenhouse lettuce production systems: commercial hydroponic production and traditional soil cultivation
Abstract
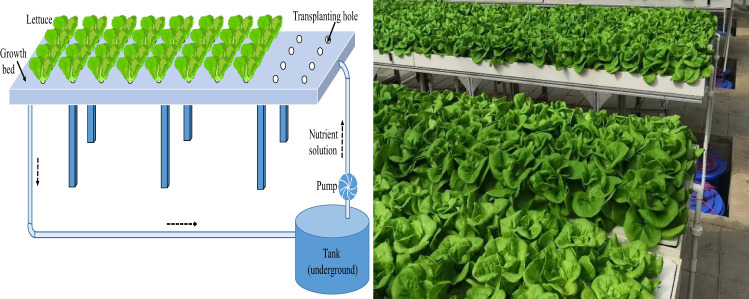
Introduction: Due to the shortage of land and water resource, optimization of systems for production in commercial greenhouses is essential for sustainable vegetable supply. The performance of lettuce productivity and the economic benefit in greenhouses using a soil-based system (SBS) and a hydroponic production system (HPS) were compared in this study.
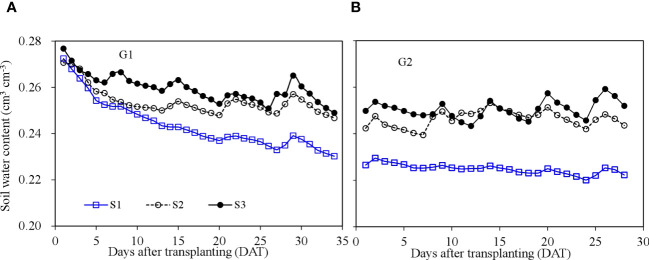
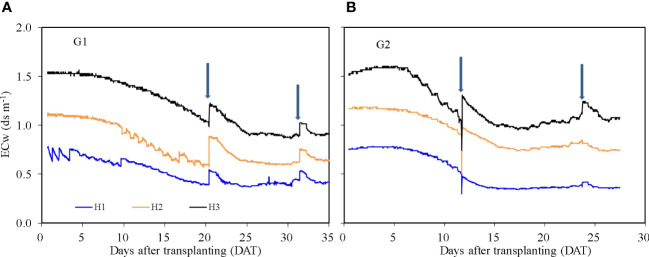
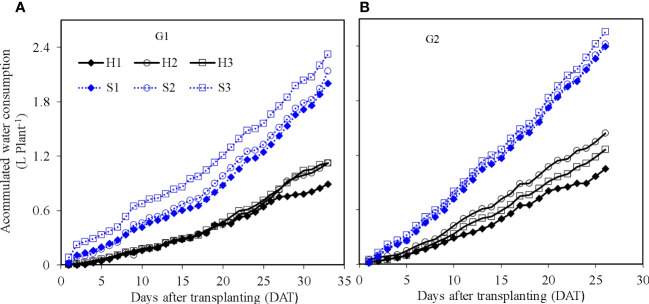
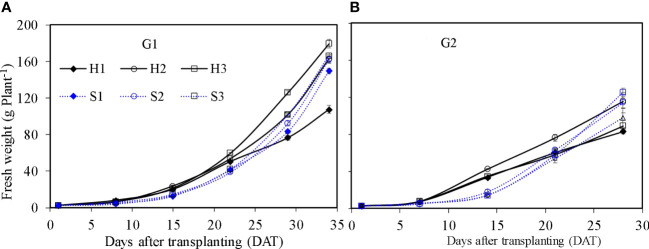
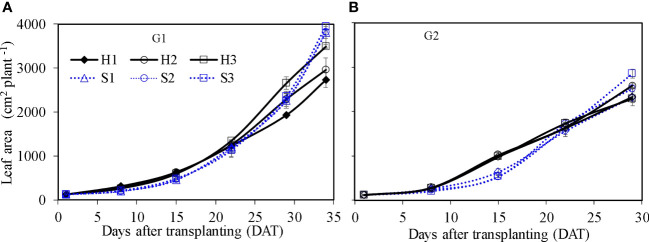
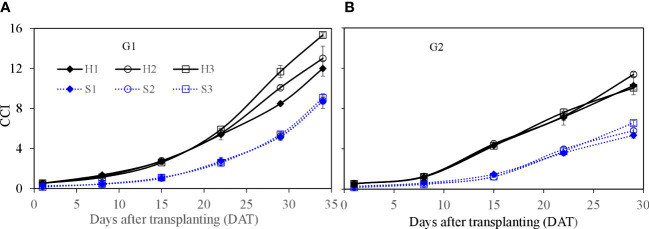
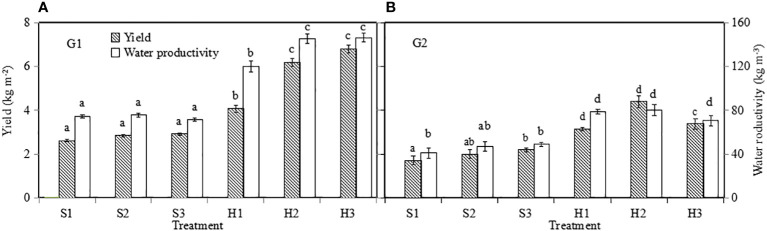
Methods: Experiments were conducted in two identical greenhouses over two growth cycles (G1 and G2). Three treatments of irrigation volumes (S1, S2, and S3) were evaluated for SBS while three treatments of nutrient solution concentration (H1, H2, and H3) were evaluated for HPS; the optimal levels from each system were then compared.
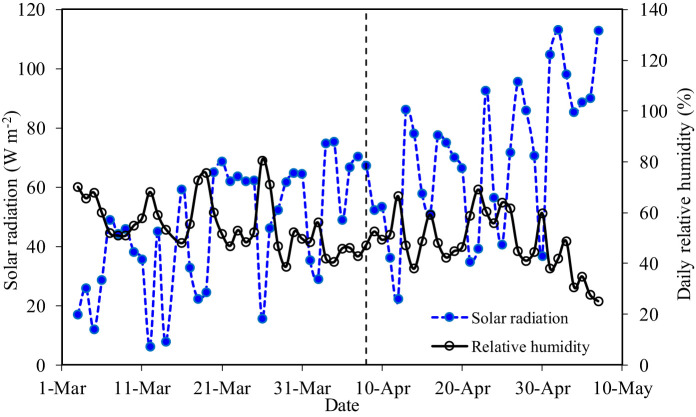
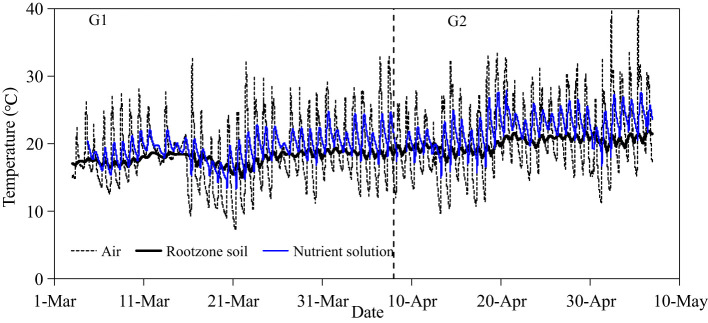
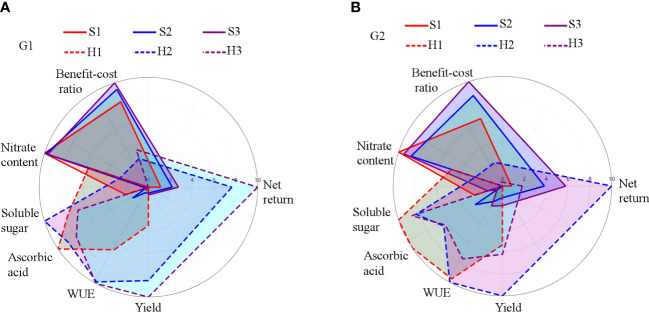
Results and discussion: HPS was more sensitive to the effects of environmental temperature than SBS because of higher soil buffer capacity. Compared with SBS, higher yield (more than 134%) and higher water productivity (more than 50%) were observed in HPS. We detected significant increases in ascorbic acid by 28.31% and 16.67% and in soluble sugar by 57.84% and 32.23% during G1 and G2, respectively, compared with SBS. However, nitrate accumulated in HPS-grown lettuce. When the nutrient solution was replaced with fresh water 3 days before harvest, the excess nitrate content of harvested lettuce in HPS was removed. The initial investment and total operating cost in HPS were 21.76 times and 47.09% higher than those in SBS, respectively. Consideration of agronomic, quality, and economic indicators showed an overall optimal performance of the H2 treatment. These findings indicated that, in spite of its higher initial investment and requirement of advanced technology and management, HPS was more profitable than SBS for commercial lettuce production.
Keywords: buffer capacity; economic benefit; nitrate; quality; vegetable production; water productivity.
Copyright © 2023 Wang, Ning, Zheng, Guo, Li, Li, Chen, Ben-Gal and Wei.
Conflict of interest statement
The authors declare that the research was conducted in the absence of any commercial or financial relationships that could be construed as a potential conflict of interest.
Figures
Similar articles
-
Dynamics of micro and macronutrients in a hydroponic nutrient film technique system under lettuce cultivation.Heliyon. 2024 Jun 1;10(11):e32316. doi: 10.1016/j.heliyon.2024.e32316. eCollection 2024 Jun 15. Heliyon. 2024. PMID: 38947472 Free PMC article.
-
Management of Fertigation in Horticultural Crops through Automation with Electrotensiometers: Effect on the Productivity of Water and Nutrients.Sensors (Basel). 2020 Dec 30;21(1):190. doi: 10.3390/s21010190. Sensors (Basel). 2020. PMID: 33396728 Free PMC article.
-
Lettuce Production in Intelligent Greenhouses-3D Imaging and Computer Vision for Plant Spacing Decisions.Sensors (Basel). 2023 Mar 8;23(6):2929. doi: 10.3390/s23062929. Sensors (Basel). 2023. PMID: 36991638 Free PMC article.
-
Reduced Fertilization to Improve Sustainable Use of Resources and Preserve Postharvest Quality of Fresh-Cut Wild Rocket (Diplotaxis tenuifolia L.) in Soil-Bound and Soilless Cultivation.Plants (Basel). 2024 Feb 10;13(4):499. doi: 10.3390/plants13040499. Plants (Basel). 2024. PMID: 38502041 Free PMC article.
-
Reduction of Nitrate Content in Baby-Leaf Lettuce and Cichorium endivia Through the Soilless Cultivation System, Electrical Conductivity and Management of Nutrient Solution.Front Plant Sci. 2021 Apr 29;12:645671. doi: 10.3389/fpls.2021.645671. eCollection 2021. Front Plant Sci. 2021. PMID: 33995445 Free PMC article.
Cited by
-
Acclimation of functional traits leads to biomass increases in leafy green species grown in aquaponics.AoB Plants. 2025 Jan 20;17(2):plaf005. doi: 10.1093/aobpla/plaf005. eCollection 2025 Feb. AoB Plants. 2025. PMID: 40007953 Free PMC article.
-
Vertical farming for lettuce production in limited space: a case study in Northern Thailand.PeerJ. 2024 Apr 10;12:e17085. doi: 10.7717/peerj.17085. eCollection 2024. PeerJ. 2024. PMID: 38618565 Free PMC article.
-
Hydroponics with Microalgae and Cyanobacteria: Emerging Trends and Opportunities in Modern Agriculture.BioTech (Basel). 2024 Jul 22;13(3):27. doi: 10.3390/biotech13030027. BioTech (Basel). 2024. PMID: 39051342 Free PMC article. Review.
-
Characterisation of combined abiotic and biotic stresses effects on lettuce plants via a multi-analysis approach.Front Plant Sci. 2025 May 13;16:1550577. doi: 10.3389/fpls.2025.1550577. eCollection 2025. Front Plant Sci. 2025. PMID: 40433152 Free PMC article.
-
Deficit Irrigation with Silicon Application as Strategy to Increase Yield, Photosynthesis and Water Productivity in Lettuce Crops.Plants (Basel). 2024 Apr 5;13(7):1029. doi: 10.3390/plants13071029. Plants (Basel). 2024. PMID: 38611558 Free PMC article.
References
-
- Abu-Rayyan A., Khraiwesh B. H., Al-Ismail K. (2004). Nitrate content in lettuce (Lactuca sativa l.) heads in relation to plant spacing, nitrogen form and irrigation level. J. Sci. Food Agr. 84, 931–936. doi: 10.1002/jsfa.1733 - DOI
-
- Alahi A., Hossain M. I., Kabir K., Shahjahan M., Hosain M. T. (2014). Effect of phosphorus and plant spacing on the growth and yield of lettuce. Adv. Agric. Biol. 2, 1–7. doi: 10.15192/PSCP.AAB.2014.2.1.17 - DOI
-
- Amos C. C., Rahman A., Karim F., Gathenya J. M. (2018). A scoping review of roof harvested rainwater usage in urban agriculture: australia and kenya in focus. J. Clean. Prod. 202, 174–190. doi: 10.1016/j.jclepro.2018.08.108 - DOI
-
- NBSC RMB exchange rate (Accessed September 26th, 2020).
-
- Barbosa G. L., Gadelha F. D. A., Kublik N., Proctor A., Reichelm L., Weissinger E., et al. . (2015). Comparison of land, water, and energy requirements of lettuce grown using hydroponic vs. conventional agricultural methods. Int. J. Env. Res. Pub. He. 12, 6879–6891. doi: 10.3390/ijerph120606879 - DOI - PMC - PubMed
LinkOut - more resources
Full Text Sources