. 2023 Jul 17;7(8):e925.
doi: 10.1097/HS9.0000000000000925. eCollection 2023 Aug.

Optical Genome Mapping Identifies Novel Recurrent Structural Alterations in Childhood ETV6::RUNX1+ and High Hyperdiploid Acute Lymphoblastic Leukemia

Affiliations

Optical Genome Mapping Identifies Novel Recurrent Structural Alterations in Childhood ETV6::RUNX1+ and High Hyperdiploid Acute Lymphoblastic Leukemia

Danielle Brandes et al. Hemasphere. .

Abstract

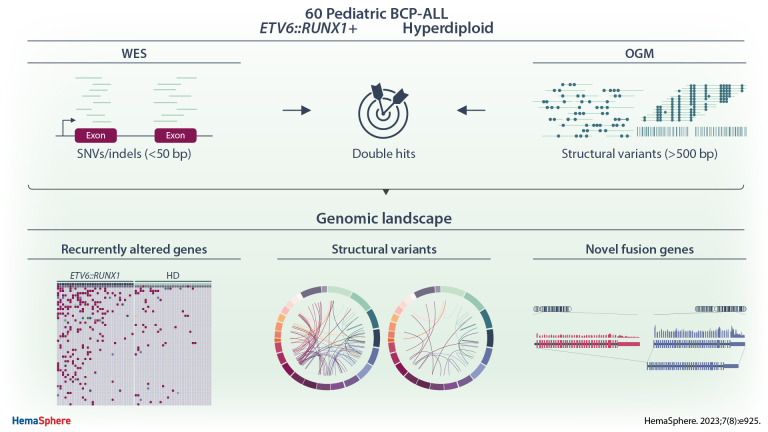
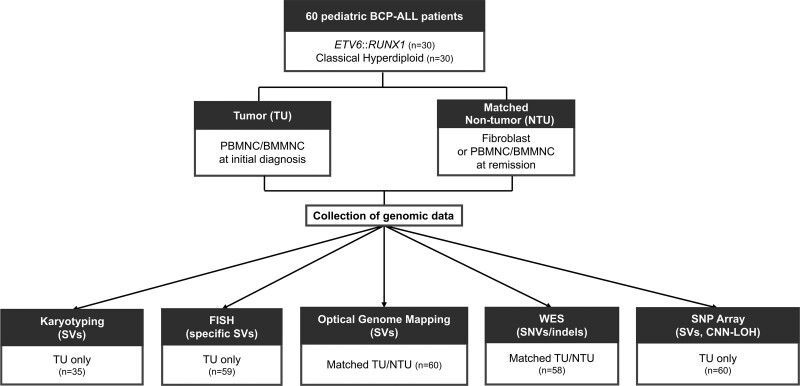
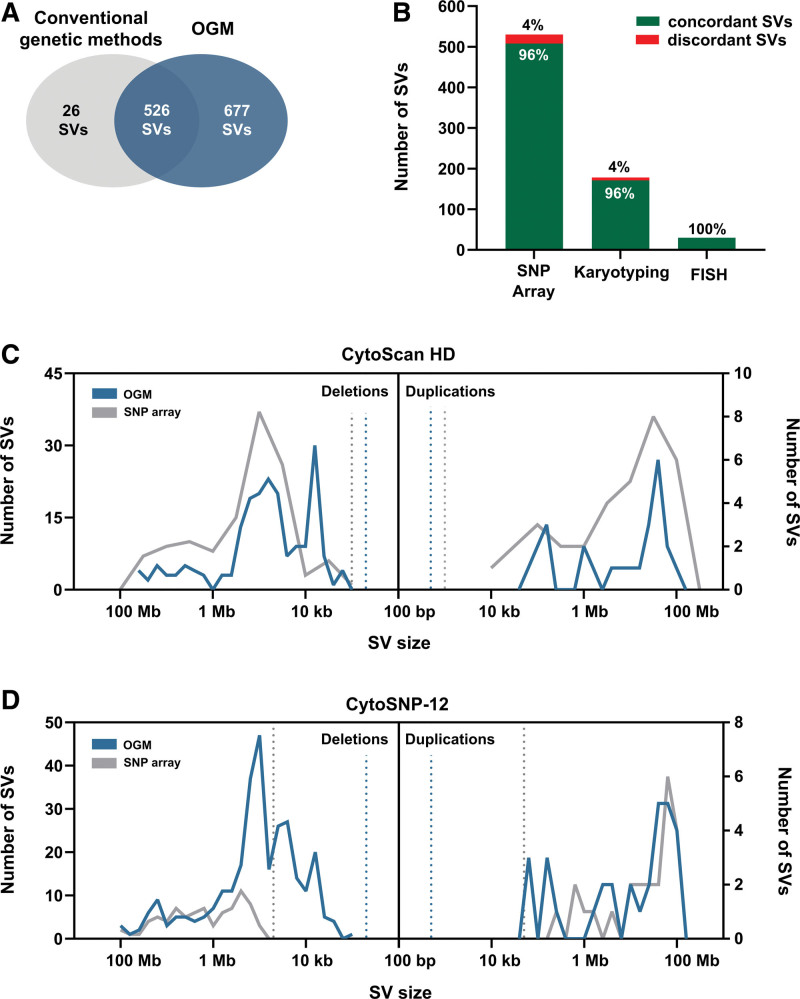
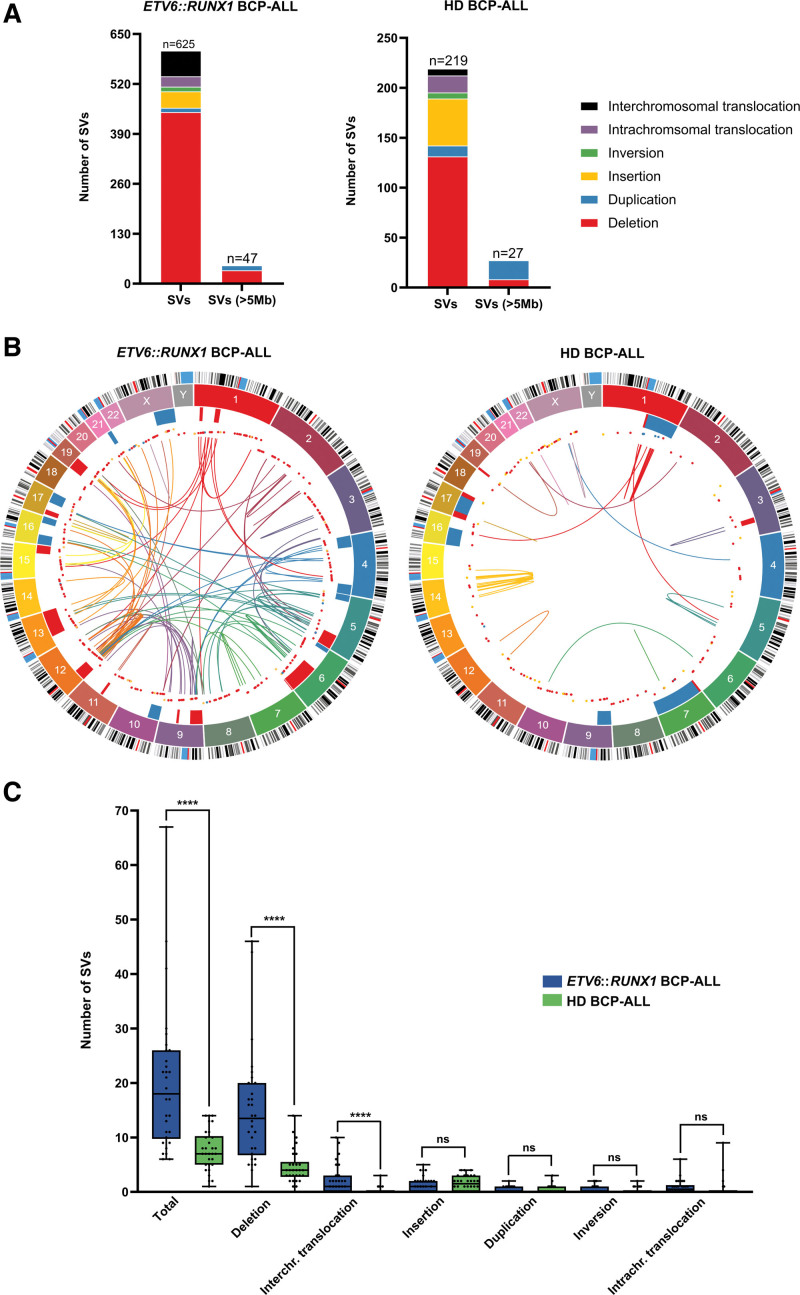
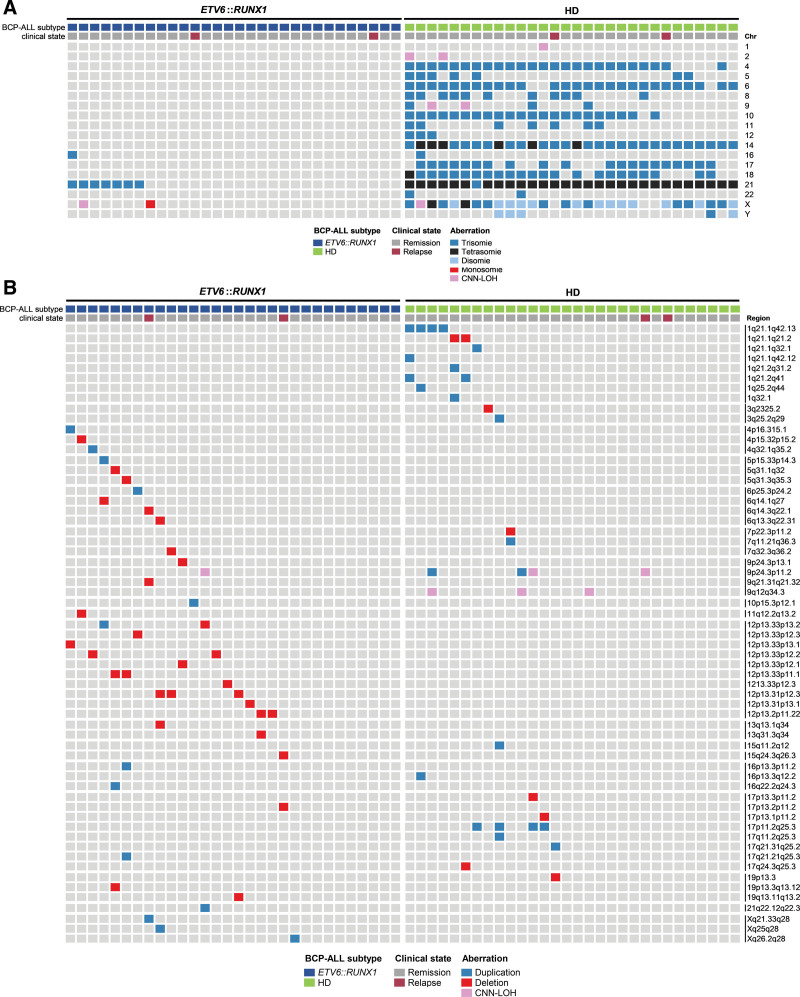
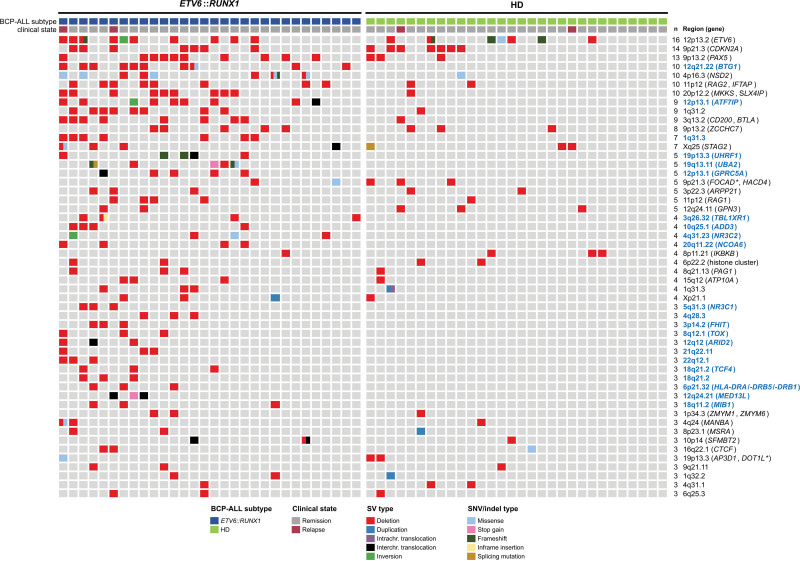
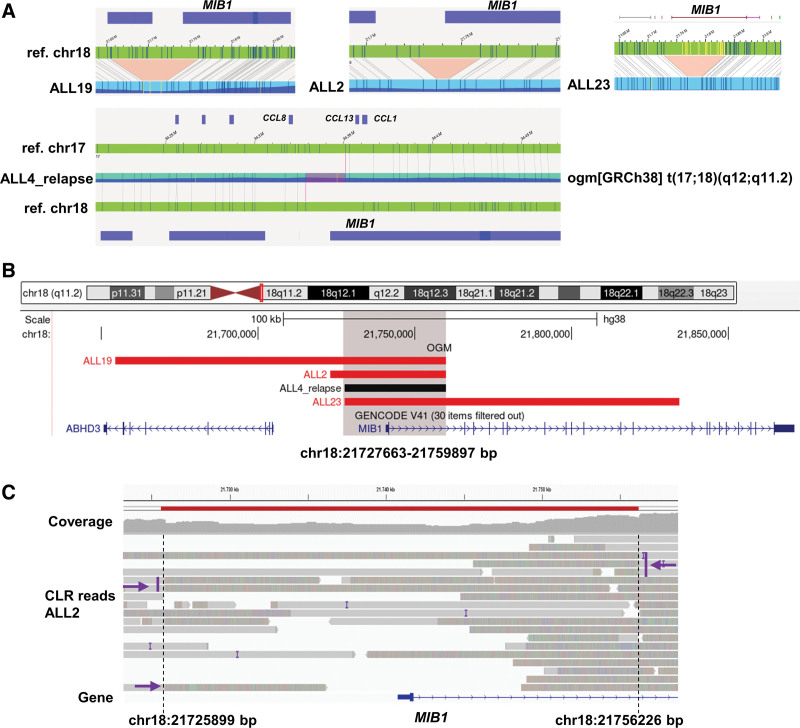
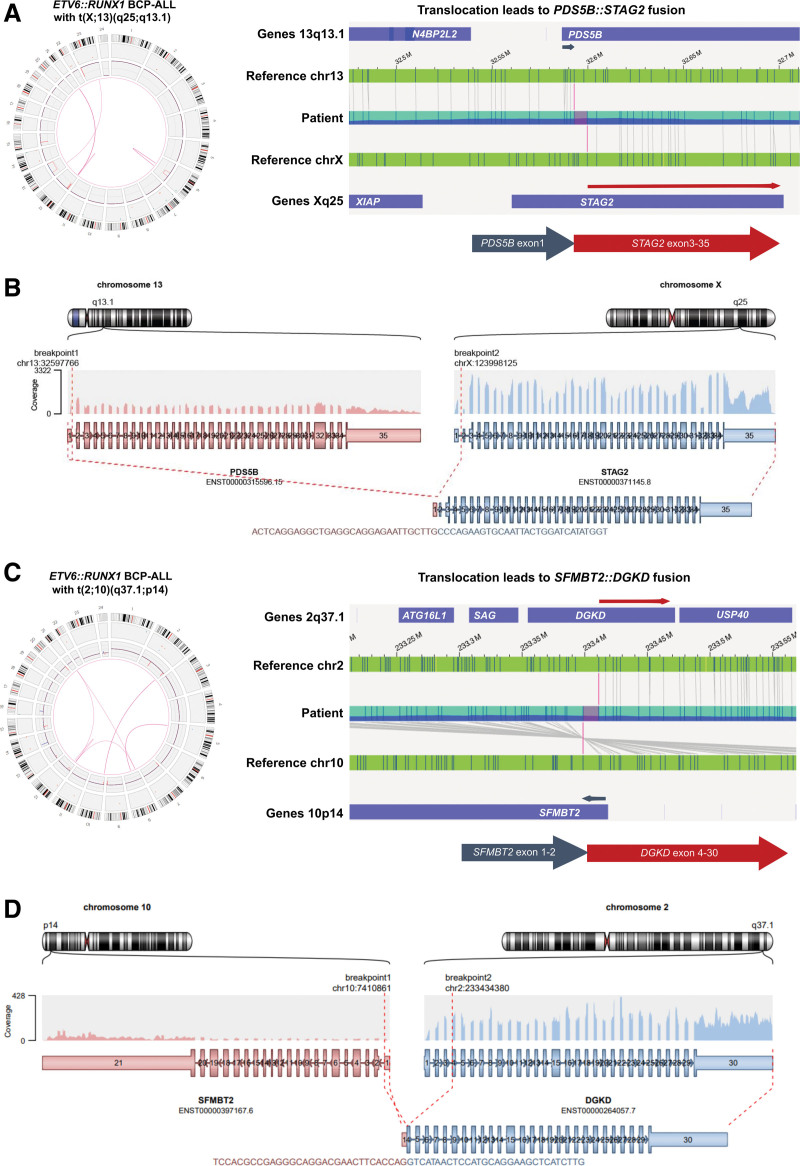
The mutational landscape of B-cell precursor acute lymphoblastic leukemia (BCP-ALL), the most common pediatric cancer, is not fully described partially because commonly applied short-read next generation sequencing has a limited ability to identify structural variations. By combining comprehensive analysis of structural variants (SVs), single-nucleotide variants (SNVs), and small insertions-deletions, new subtype-defining and therapeutic targets may be detected. We analyzed the landscape of somatic alterations in 60 pediatric patients diagnosed with the most common BCP-ALL subtypes, ETV6::RUNX1+ and classical hyperdiploid (HD), using conventional cytogenetics, single nucleotide polymorphism (SNP) array, whole exome sequencing (WES), and the novel optical genome mapping (OGM) technique. Ninety-five percent of SVs detected by cytogenetics and SNP-array were verified by OGM. OGM detected an additional 677 SVs not identified using the conventional methods, including (subclonal) IKZF1 deletions. Based on OGM, ETV6::RUNX1+ BCP-ALL harbored 2.7 times more SVs than HD BCP-ALL, mainly focal deletions. Besides SVs in known leukemia development genes (ETV6, PAX5, BTG1, CDKN2A), we identified 19 novel recurrently altered regions (in n ≥ 3) including 9p21.3 (FOCAD/HACD4), 8p11.21 (IKBKB), 1p34.3 (ZMYM1), 4q24 (MANBA), 8p23.1 (MSRA), and 10p14 (SFMBT2), as well as ETV6::RUNX1+ subtype-specific SVs (12p13.1 (GPRC5A), 12q24.21 (MED13L), 18q11.2 (MIB1), 20q11.22 (NCOA6)). We detected 3 novel fusion genes (SFMBT2::DGKD, PDS5B::STAG2, and TDRD5::LPCAT2), for which the sequence and expression were validated by long-read and whole transcriptome sequencing, respectively. OGM and WES identified double hits of SVs and SNVs (ETV6, BTG1, STAG2, MANBA, TBL1XR1, NSD2) in the same patient demonstrating the power of the combined approach to define the landscape of genomic alterations in BCP-ALL.


Conflict of interest statement

The authors have no conflicts of interest to disclose.

Figures

None
Graphical abstract
Figure 1.
Figure 1.
Overview of genomic data collection from 60 pediatric BCP-ALL patients. Tumor and matched non-tumor samples from 30 ETV6::RUNX1 and 30 classical HD BCP-ALL patients were analyzed. A comprehensive data set was collected to detect SVs, CNN-LOHs, and SNVs/indels using karyotyping, FISH, OGM, WES, and SNP-array. BCP-ALL = B-cell precursor acute lymphoblastic leukemia; BMMNC = bone marrow mononuclear cells; CNN-LOHs = copy number neutral loss of heterozygosity; FISH = fluorescence in situ hybridization; HD = hyperdiploid; OGM = optical genome mapping; PBMMNC = peripheral blood mononuclear cells; SNP = single nucleotide polymorphism; SV = structural variants; WES = whole exome sequencing.
Figure 2.
Figure 2.
Comparison of SVs detected by conventional genetic techniques and OGM in 60 primary BCP-ALL cases. (A) OGM reliably detects 95% (526/552) of SVs detected by conventional genetic methods (SNP-array, karyotyping, and FISH), including all hallmark aberrations such as the ETV6::RUNX1 translocation and hyperdiploidy. OGM detected 677 additional SVs compared with standard methods. (B) Frequencies of concordant and discordant SVs detected by karyotyping, SNP-array, and FISH compared with OGM. (C) Size distribution of deletions and duplications detected by OGM (green) and CytoScanHD (SNP-array, gray) in 18 cases. Dashed lines indicate the detection limit of 1 kbp (SNP-array, gray) and 500 bp (OGM, green). (D) Size distribution of deletions and duplications detected by OGM (green) and CytoSNP-12 (SNP-array, gray) in 42 cases. Dashed lines indicate the detection limit of 50 kbp (SNP-array, gray) and 500 bp (OGM, green). BCP-ALL = B-cell precursor acute lymphoblastic leukemia; FISH = fluorescence in situ hybridization; HD = hyperdiploid; OGM = optical genome mapping; SNP = single nucleotide polymophism; SV = structural variants.
Figure 3.
Figure 3.
Frequencies of SVs detected in 60 primary BCP-ALL cases by OGM in addition to their hallmark alterations. The defining ETV6::RUNX1 translocation and numerical whole chromosomal alterations are not included. (A) Total numbers of SVs and SVs ≥5 Mb in 60 primary BCP-ALLs. (B) Circos plots showing from the outer to the inner circle: the chromosomal ideogram; the chromosome number; chromosomal regions of deletions (red) and duplications (blue) ≥5 Mb, focal deletions (red), duplications (blue) and insertions (yellow); and intra and interchromosomal translocations and inversions of ETV6::RUNX1+ (n = 30, left circos plot) and HD (n = 30, right circosplot) BCP-ALL. (C) Box plots depicting the number of SVs per case for all SVs (total) and for each SV type in ETV6::RUNX1+ (blue) and HD (green) BCP-ALL subtypes. Box and whiskers indicate median, 25 of and 75% quartiles and ±range. Statistical significance was assessed between the 2 BCP-ALL subtypes using the Mann-Whitney U Test. ****P < 0.0001. BCP-ALL = B-cell precursor acute lymphoblastic leukemia; HD = hyperdiploid; ns = not significant; OGM = optical genome mapping; SV = structural variants.
Figure 4.
Figure 4.
Landscape of aneuploidy and SVs ≥5 Mb in ETV6::RUNX1+ and HD BCP-ALL identified by OGM and SNP-array. Depicted are (A) aneuploidies and whole chromosomal CNN-LOHs and (B) SVs ≥5 Mb and CNN-LOHs not affecting the whole chromosome, identified ETV6::RUNX1+ and HD BCP-ALL cases. Each column represents a case and each line an altered region. The color code indicates the type of alteration detected. BCP-ALL = B-cell precursor acute lymphoblastic leukemia; CNN-LOHs = copy number neutral loss of heterozygosity; HD = hyperdiploid; OGM = optical genome mapping; SNP = single nucleotide polymorphism; SV = structural variants.
Figure 5.
Figure 5.
Combination of OGM and short-read whole exome sequencing reveals recurrently altered regions and genes in 60 primary BCP-ALL cases. The oncoprint depicting the combined dataset of MARs by SVs identified by OGM and SNVs/indels affecting the potential target gene, which are recurrently affected in n≥3 BCP-ALL (5%). Every column indicates a case and each line a recurrently altered region. The color code indicates the type of SV and SNV/indel alteration. The number of cases (n) with the specific region of the MARs is given on the right. Subtype-specific alterations are highlighted in blue for ETV6::RUNX1+ BCP-ALL. If 2 or more potential target genes are located in the MAR, an asterisk (*) indicates the gene affected by SNV/indel. BCP-ALL = B-cell precursor acute lymphoblastic leukemia; HD = hyperdiploid; MARs = minimal altered regions; OGM = optical genome mapping; SV = structural variant.
Figure 6.
Figure 6.
Examples of herein novel recurrently altered region affecting MIB1 as potential target gene in ETV6::RUNX1 BCP-ALL detected by OGM. (A) Optical maps (blue) of 4 ETV6::RUNX1 BCP-ALLs (ALL19, ALL2, ALL23, ALL4_relapse) aligning to reference map of chromosome 18 (green) are shown. Top: Red highlights indicate deleted regions overlapping with the MIB1 gene locus in 3 BCP-ALL cases. Bottom: t(17;18)(q12;q11.2) occurring in a relapsed leukemia with potential breakpoint in MIB1 (indicated by pink line) is shown. (B) Detailed chromosomal locations of the SVs affecting the MIB1 gene locus of four BCP-ALL are shown in the UCSC genome browser. Red bars indicate potentially deleted regions. Black bar shows region of the potential translocation breakpoint. Minimal altered region on 18q11.2 (chr18:21,727,663–21,759,897 bp) is highlighted in gray and overlaps with promotor region of MIB1. (C) CLR sequencing of ALL2 validate the deletion (chr18:21,725,899–21,756,226 bp) of the MIB1 promotor region. CLR reads of the MIB1 locus are shown (gray bars). Dashed lines indicate breakpoints of the deletion. Split reads supporting the deletion are marked by purple arrows. Decreased coverage of aligned reads indicates a deletion (red bar). Dashed lines indicate breakpoints of the deletion. Split reads supporting the deletion are marked by purple arrows. Decreased coverage of aligned reads indicates a deletion (red bar). BCP-ALL = B-cell precursor acute lymphoblastic leukemia; CLR = continuous long-read; OGM = optical genome mapping; SV = structural variants.
Figure 7.
Figure 7.
OGM and RNA-seq reveal expression of novel fusion genes in ETV6::RUNX1 BCP-ALL. (A) Left: Circos plot showing somatic SVs of ALL28 with secondary translocation t(X;13)(q25;q13.1) detected by OGM (left). Right: Detailed view of patient optical map (blue) partly aligning to reference chromosomes (green) 13 and X, indicating a translocation that leads to potential fusion of PDS5B exon1 (gray arrow) to STAG2 exon 3–35 (red arrow). Potential breakpoints are indicated in pink. (B) Validation of PDS5B::STAG2 expression in ALL28 by RNA-seq. Arriba output of RNA-sequencing data is shown indicating a t(X;13)(q25;q13.1) that leads to in-frame fusion of PDS5B exon1 to STAG2 exon 3–34. Coverage of the aligned reads is indicated. (C) Left: Circos plot showing somatic SVs of ALL10 with secondary translocation t(2;10)(q37.1;p14) detected by OGM (left). Right: Detailed view of patient optical map (blue) partly aligning to reference chromosomes (green) 2 and 10, indicating a translocation that leads to potential fusion of SFMBT2 exon1-2 (gray arrow) to DGKD exon 4–30 (red arrow). Potential breakpoints are indicated in pink. (D) Validation of SFMBT2::DGKD expression in ALL10 by RNA-seq. Arriba output of RNA-sequencing data is shown indicating a t(2;10)(q37.1;p14) that leads to in-frame fusion of SFMBT2 exon1 to DGKD exon 4–30. Coverage of the aligned reads is indicated. BCP-ALL = B-cell precursor acute lymphoblastic leukemia; OGM = optical genome mapping; SV = structural variants.
Figure 8.
Figure 8.
OGM resolved complex IGH rearrangements in an HD leukemia patient. (A) FISH result (with IGH 5′ and 3′ break-apart probes) is shown, indicating a t(14;14) with additional complex aberrations of the derivative chromosome 14 in ALL51. (B) Circos plot of chromosome 14 of ALL51 is depicted showing several intrachromosomal translocations including juxtaposition of the IGH region to the PTGER2 loci and inversion of the SNAPC1 region. (C) Optical map (blue) showing the juxtaposition of the IGH locus on 14q32.33 to the SNAPC1 locus on 14q23.2. (D) Arriba output of RNA-sequencing data is shown indicating a t(14;14)(q23.2;p32.33) that leads to fusion of SNAPC1 exon 1–9 to the IGHVII-26-2/IGHV7-27 locus. Coverage of the aligned reads is indicated. HD = hyperdiploid; IGH = immunoglobulin heavy locus; OGM = optical genome mapping.

Similar articles

Cited by

References

    1. Haas OA, Borkhardt A. Hyperdiploidy: the longest known, most prevalent, and most enigmatic form of acute lymphoblastic leukemia in children. Leukemia. 2022;36:2769–2783. - PMC - PubMed
    1. Pui CH. Precision medicine in acute lymphoblastic leukemia. Front Med. 2020;14:689–700. - PMC - PubMed
    1. Brady SW, Roberts KG, Gu Z, et al. The genomic landscape of pediatric acute lymphoblastic leukemia. Nat Genet. 2022;54:1376–1389. - PMC - PubMed
    1. Enshaei A, Vora A, Harrison CJ, et al. Defining low-risk high hyperdiploidy in patients with paediatric acute lymphoblastic leukaemia: a retrospective analysis of data from the UKALL97/99 and UKALL2003 clinical trials. Lancet Haematol. 2021;8:e828–e839. - PMC - PubMed
    1. Greaves M. A causal mechanism for childhood acute lymphoblastic leukaemia. Nat Rev Cancer. 2018;18:471–484. - PMC - PubMed