

Identification of the biological processes, immune cell landscape, and hub genes shared by acute anaphylaxis and ST-segment elevation myocardial infarction
- PMID: 37469874
- PMCID: PMC10353022
- DOI: 10.3389/fphar.2023.1211332
Identification of the biological processes, immune cell landscape, and hub genes shared by acute anaphylaxis and ST-segment elevation myocardial infarction
Abstract
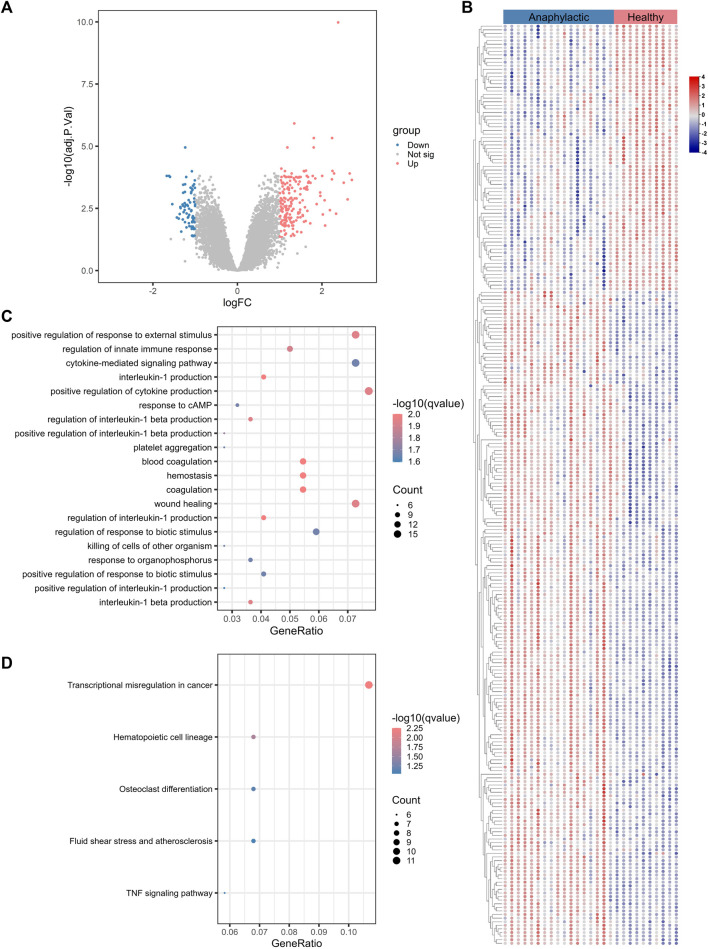
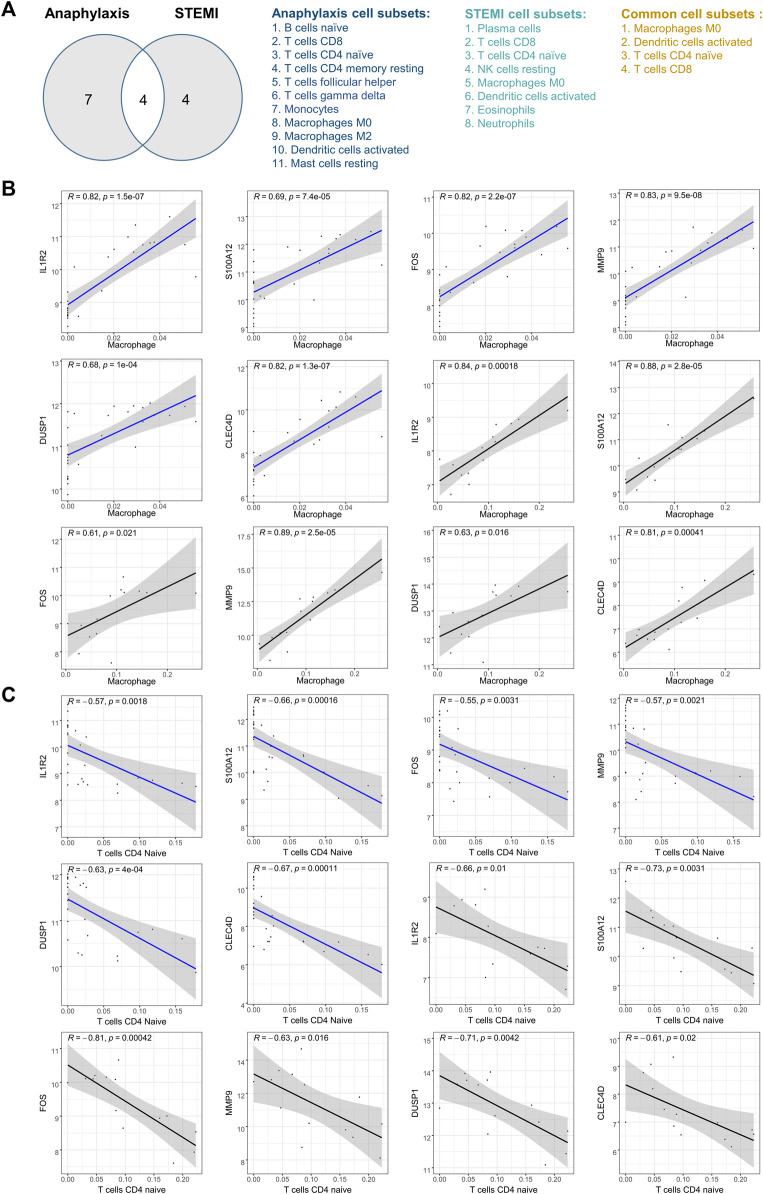
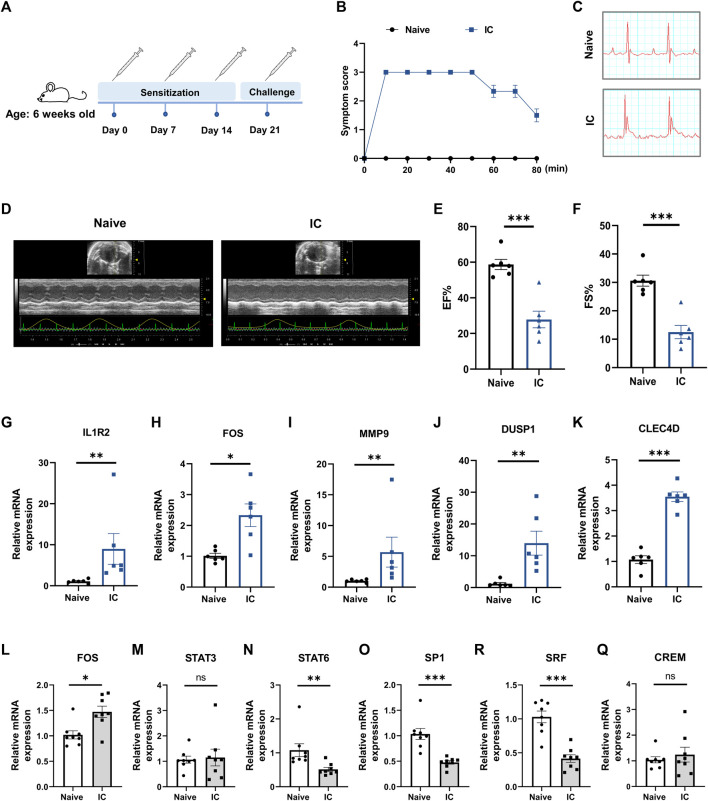
Background: Patients with anaphylaxis are at risk for ST-segment elevation myocardial infarction (STEMI). However, the pathological links between anaphylaxis and STEMI remain unclear. Here, we aimed to explore shared biological processes, immune effector cells, and hub genes of anaphylaxis and STEMI. Methods: Gene expression data for anaphylactic (GSE69063) and STEMI (GSE60993) patients with corresponding healthy controls were pooled from the Gene Expression Omnibus database. Differential expression analysis, enrichment analysis, and CIBERSORT were used to reveal transcriptomic signatures and immune infiltration profiles of anaphylaxis and STEMI, respectively. Based on common differentially expressed genes (DEGs), Gene Ontology analysis, cytoHubba algorithms, and correlation analyses were performed to identify biological processes, hub genes, and hub gene-related immune cells shared by anaphylaxis and STEMI. The robustness of hub genes was assessed in external anaphylactic (GSE47655) and STEMI (GSE61144) datasets. Furthermore, a murine model of anaphylaxis complicated STEMI was established to verify hub gene expressions. The logistic regression analysis was used to evaluate the diagnostic efficiency of hub genes. Results: 265 anaphylaxis-related DEGs were identified, which were associated with immune-inflammatory responses. 237 STEMI-related DEGs were screened, which were involved in innate immune response and myeloid leukocyte activation. M0 macrophages and dendritic cells were markedly higher in both anaphylactic and STEMI samples compared with healthy controls, while CD4+ naïve T cells and CD8+ T cells were significantly lower. Enrichment analysis of 33 common DEGs illustrated shared biological processes of anaphylaxis and STEMI, including cytokine-mediated signaling pathway, response to reactive oxygen species, and positive regulation of defense response. Six hub genes were identified, and their expression levels were positively correlated with M0 macrophage abundance and negatively correlated with CD4+ naïve T cell abundance. In external anaphylactic and STEMI samples, five hub genes (IL1R2, FOS, MMP9, DUSP1, CLEC4D) were confirmed to be markedly upregulated. Moreover, experimentally induced anaphylactic mice developed impaired heart function featuring STEMI and significantly increased expression of the five hub genes. DUSP1 and CLEC4D were screened as blood diagnostic biomarkers of anaphylaxis and STEMI based on the logistic regression analysis. Conclusion: Anaphylaxis and STEMI share the biological processes of inflammation and defense responses. Macrophages, dendritic cells, CD8+ T cells, and CD4+ naïve T cells constitute an immune cell population that acts in both anaphylaxis and STEMI. Hub genes (DUSP1 and CLEC4D) identified here provide candidate genes for diagnosis, prognosis, and therapeutic targeting of STEMI in anaphylactic patients.
Keywords: STEMI; anaphylaxis; hub gene; immune response; inflammation.
Copyright © 2023 Peng, Chen and Wang.
Conflict of interest statement
The authors declare that the research was conducted in the absence of any commercial or financial relationships that could be construed as a potential conflict of interest.
Figures


Similar articles
-
Integrated Multichip Analysis and WGCNA Identify Potential Diagnostic Markers in the Pathogenesis of ST-Elevation Myocardial Infarction.Contrast Media Mol Imaging. 2022 Apr 7;2022:7343412. doi: 10.1155/2022/7343412. eCollection 2022. Contrast Media Mol Imaging. 2022. PMID: 35475279 Free PMC article.
-
Bioinformatics-based Analysis and Verification of Chromatin Regulators and the Mechanism of Immune Infiltration Associated with Myocardial Infarction.Curr Med Chem. 2025;32(1):188-209. doi: 10.2174/0109298673265089231117054348. Curr Med Chem. 2025. PMID: 39354722
-
Integrated Gene Expression Profiling Analysis Reveals Potential Molecular Mechanisms and Candidate Biomarkers for Early Risk Stratification and Prediction of STEMI and Post-STEMI Heart Failure Patients.Front Cardiovasc Med. 2021 Dec 10;8:736497. doi: 10.3389/fcvm.2021.736497. eCollection 2021. Front Cardiovasc Med. 2021. PMID: 34957234 Free PMC article.
-
Identification of Effective Diagnostic Biomarkers and Immune Cell Infiltration in Atopic Dermatitis by Comprehensive Bioinformatics Analysis.Front Mol Biosci. 2022 Jul 14;9:917077. doi: 10.3389/fmolb.2022.917077. eCollection 2022. Front Mol Biosci. 2022. PMID: 35911963 Free PMC article.
-
Integrated Bioinformatics-Based Analysis of Hub Genes and the Mechanism of Immune Infiltration Associated With Acute Myocardial Infarction.Front Cardiovasc Med. 2022 Apr 6;9:831605. doi: 10.3389/fcvm.2022.831605. eCollection 2022. Front Cardiovasc Med. 2022. PMID: 35463752 Free PMC article.
Cited by
-
Ferroptosis genes and ST-segment elevation myocardial infarction outcomes: A predictive signature.Heliyon. 2024 Dec 27;11(1):e41534. doi: 10.1016/j.heliyon.2024.e41534. eCollection 2025 Jan 15. Heliyon. 2024. PMID: 39844993 Free PMC article.
-
Towards a Multi-omics Understanding of Anaphylaxis: Insights into Pathogenesis and Biomarker Identification.Clin Rev Allergy Immunol. 2025 Jun 30;68(1):61. doi: 10.1007/s12016-025-09069-8. Clin Rev Allergy Immunol. 2025. PMID: 40588688 Free PMC article. Review.
References
-
- Abbate A., Trankle C. R., Buckley L. F., Lipinski M. J., Appleton D., Kadariya D., et al. (2020). Interleukin-1 blockade inhibits the acute inflammatory response in patients with ST-segment-elevation myocardial infarction. J. Am. Heart Assoc. 9 (5), e014941. 10.1161/JAHA.119.014941 - DOI - PMC - PubMed
-
- Abbate A., Van Tassell B. W., Biondi-Zoccai G., Kontos M. C., Grizzard J. D., Spillman D. W., et al. (2013). Effects of interleukin-1 blockade with anakinra on adverse cardiac remodeling and heart failure after acute myocardial infarction [from the Virginia Commonwealth University-Anakinra Remodeling Trial (2) (VCU-ART2) pilot study]. Am. J. Cardiol. 111 (10), 1394–1400. 10.1016/j.amjcard.2013.01.287 - DOI - PMC - PubMed
LinkOut - more resources
Full Text Sources
Research Materials
Miscellaneous