. 2023 Jul 4:16:1146109.
doi: 10.3389/fnmol.2023.1146109. eCollection 2023.

Minimal influence of estrous cycle on studies of female mouse behaviors

Affiliations

Minimal influence of estrous cycle on studies of female mouse behaviors

Pei-Yun Zeng et al. Front Mol Neurosci. .

Abstract

Introduction: Sex bias has been an issue in many biomedical fields, especially in neuroscience. In rodent research, many scientists only focused on male animals due to the belief that female estrous cycle gives rise to unacceptable, high levels of variance in the experiments. However, even though female sexual behaviors are well known to be regulated by estrous cycle, which effects on other non-sexual behaviors were not always consistent in previous reports. Recent reviews analyzing published literature even suggested that there is no evidence for larger variation in female than male in several phenotypes.

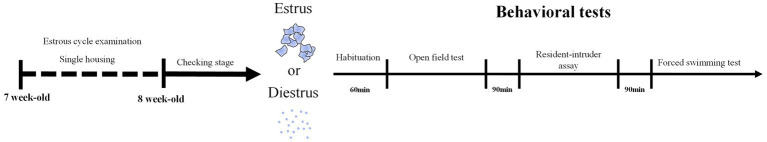
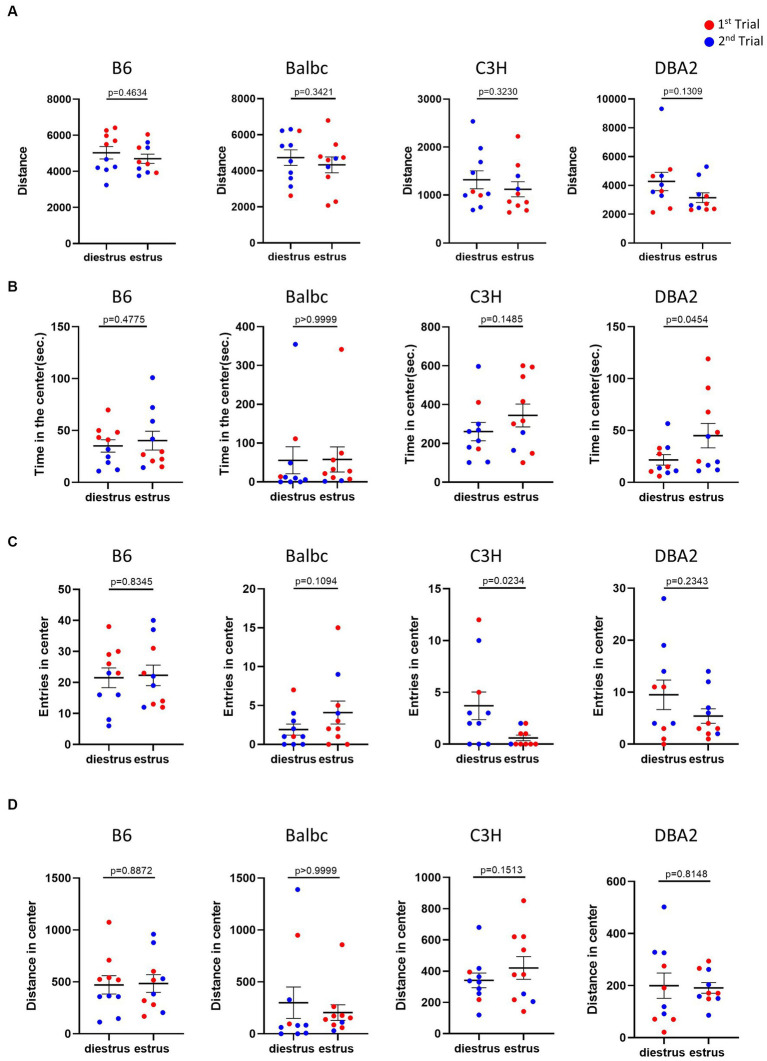
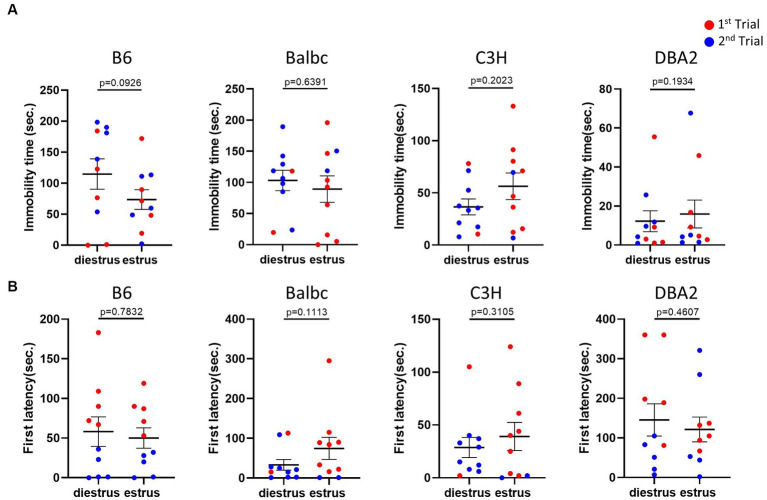
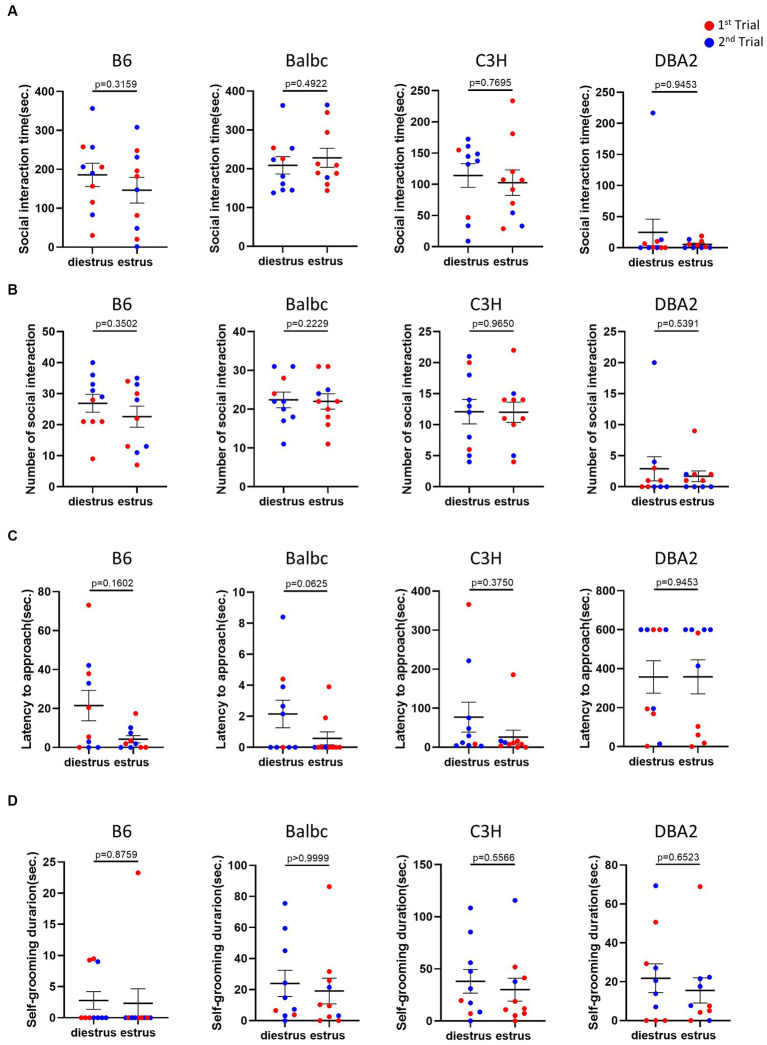
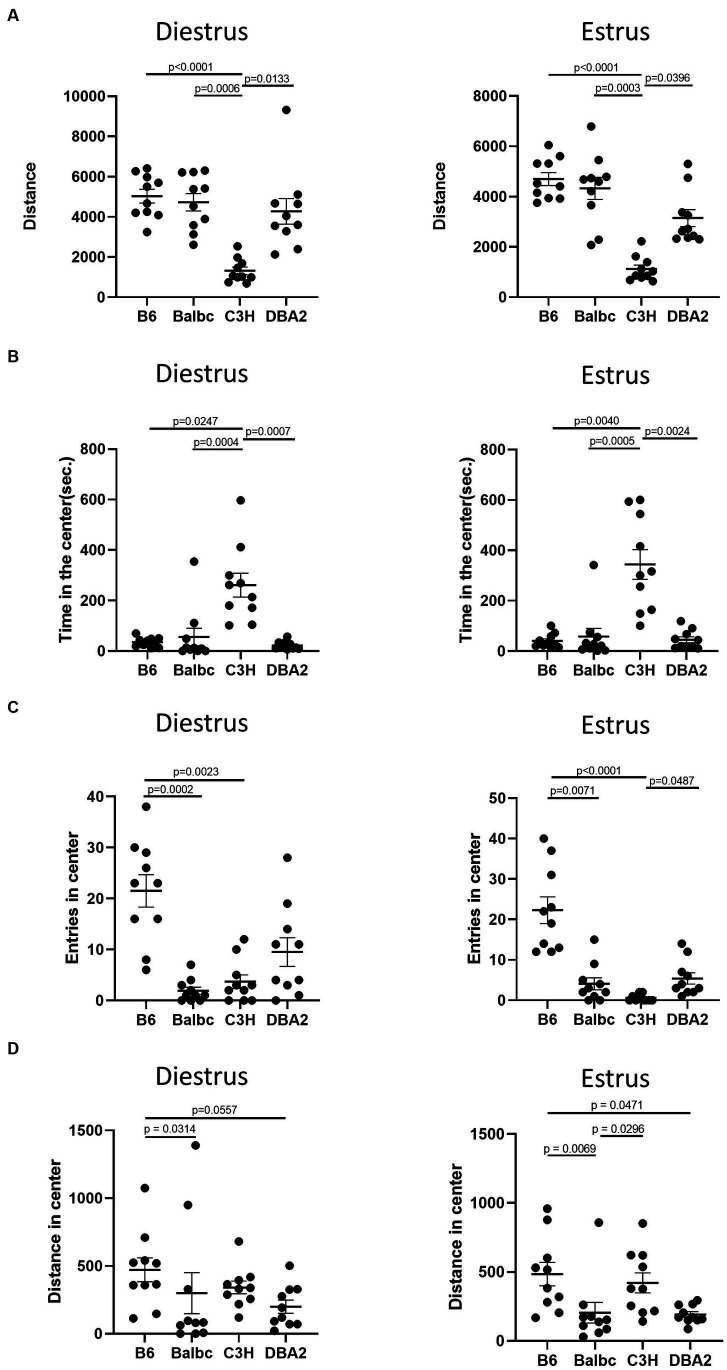
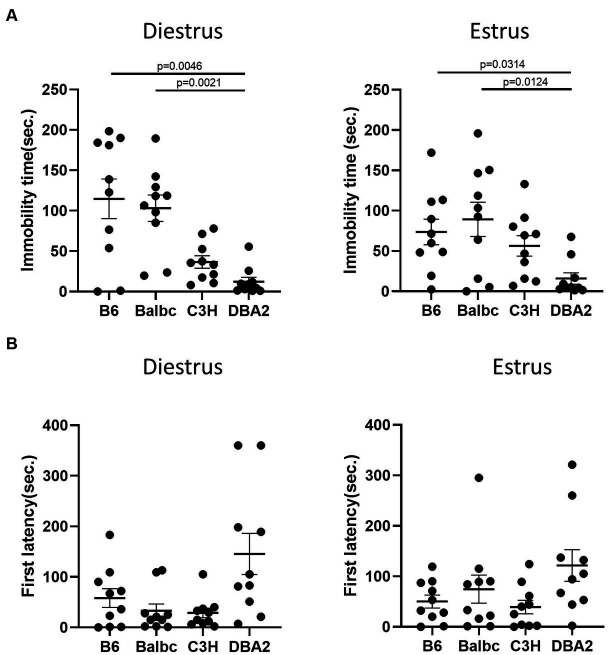
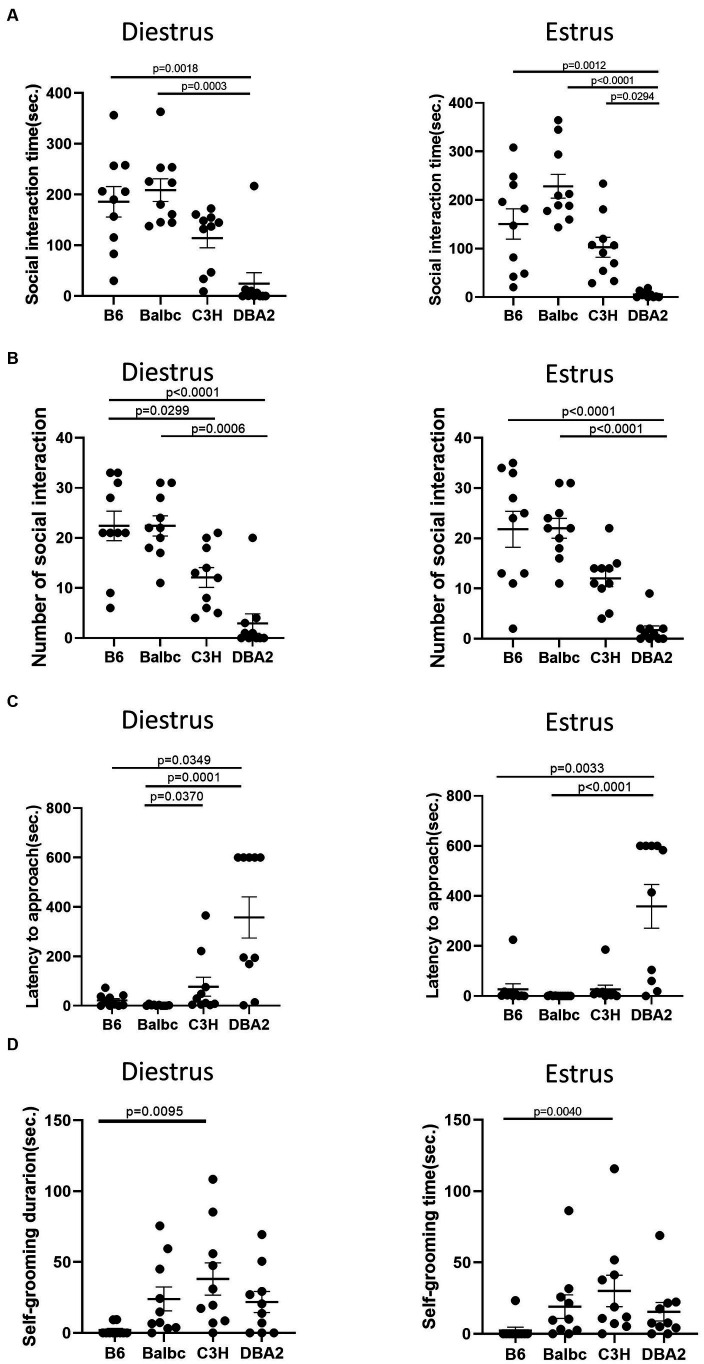
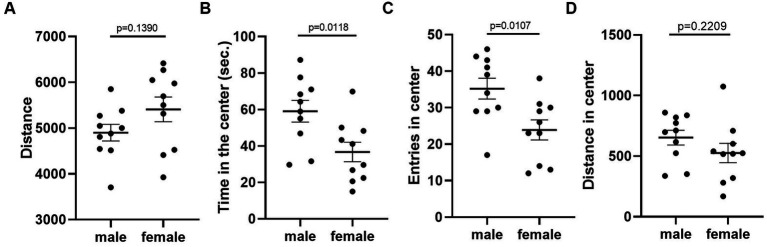
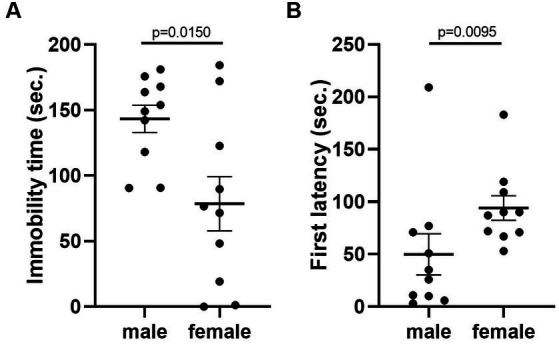
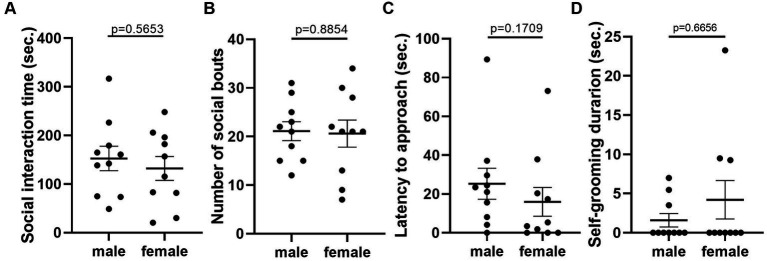
Methods: To further investigate the impact of estrous cycle on the variability of female behaviors, we conducted multiple behavioral assays, including the open field test, forced swimming test, and resident-intruder assay to assess anxiety-, depression-like behaviors, as well as social interaction respectively. We compared females in the estrus and diestrus stages across four different mouse strains: C57BL/6, BALB/c, C3H, and DBA/2.

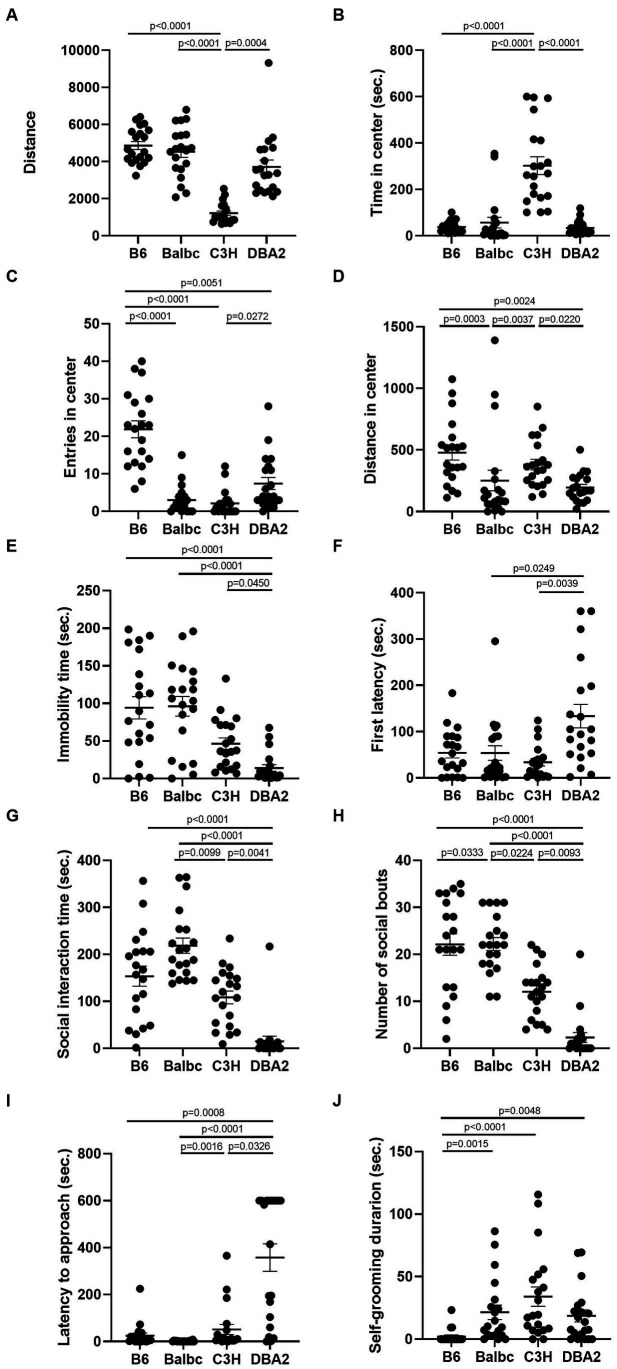
Results: Our results found no significant difference in most behavioral parameters between females in these two stages. On the other hand, the differences in behaviors among certain strains are relatively consistent in both stages, suggesting a very minimal effect of estrous cycle for detecting the behavioral difference. Last, we compared the behavioral variation between male and female and found very similar variations in most behaviors between the two sexes.

Discussion: While our study successfully identified behavioral differences among strains and between the sexes, we did not find solid evidence to support the notion that female behaviors are influenced by the estrous cycle. Additionally, we observed similar levels of behavioral variability between males and females. Female mice, therefore, have no reason to be excluded in future behavioral research.

Keywords: behavioral variation; estrous cycle; female mouse behaviors; sex bias; sex differences.


Conflict of interest statement

The authors declare that the research was conducted in the absence of any commercial or financial relationships that could be construed as a potential conflict of interest.

Figures

Figure 1
Figure 1
Experiment Flowchart. At 7-week-old, mice were single-housed and examined for the estrous cycle stage for a week. At 8-week-old, estrus and diestrus female mice went through the open-field test, resident-intruder assay followed by the forced swimming test.
Figure 2
Figure 2
Estrous stage has no significant influence on female mouse activity and anxiety-like behavior, except for time in center in DBA2 and number of entries in C3H. (A) The total travel distance of estrus and diestrus female mice in the open-field test. (B) The time of estrus and diestrus female mice in the center area of the open-field test. (C) The number of estrus and diestrus female mice entered the center area of the open-field test. (D) The distance of estrus and diestrus female mice in the center area of the open-field test. Red and blue indicate the first and the second time, respectively, that mice were run in the behavioral assays. Paired t-test or Wilcoxon matched-pairs signed-rank test, Mean ± S.E.M. (n = 10 for each group).
Figure 3
Figure 3
Estrous stage has no significant influence on female mouse depression-like behavior. (A) The immobile time of estrus and diestrus female mice in the forced-swimming test. (B) The latency to immobility of estrus and diestrus female mice in the forced-swimming test. Red and blue indicate the first and the second time, respectively, that mice were run in the behavioral assays. Paired t-test or Wilcoxon matched-pairs signed-rank test, Mean ± S.E.M. (n = 10 for each group).
Figure 4
Figure 4
Estrous stage has no significant influence on female mouse social and self-grooming behaviors. (A) The total social interaction time of estrus and diestrus female mice with intruders in the resident-intruder assay. (B) The number of social bouts of estrus and diestrus female mice in the resident-intruder assay. (C) The latency of the estrus and diestrus female approaching the intruder in the resident-intruder assay. (D) The self-grooming time of estrus and diestrus female mice in the resident-intruder assay. Red and blue indicate the first and the second time, respectively, that mice were run in the behavioral assays. Paired t-test or Wilcoxon matched-pairs signed-rank test, Mean ± S.E.M. (n = 10 for each group).
Figure 5
Figure 5
Females showed similar differences among four strains between the estrus and diestrus stage on locomotor and anxiety-like behavior. (A) The total travel distance of estrus and diestrus female mice among four different strains in the open-field test (Diestrus: H (3) = 23.15, p < 0.0001, Estrus: H (3) = 25.74, p = 0.0001). (B) The time of estrus and diestrus female mice among four different strains in the center area of the open-field test (Diestrus: H (3) = 20.62, p < 0.0001, Estrus: H (3) = 19.96, p = 0.0002). (C) The number of estrus and diestrus female mice entered the center area of the open-field test (Diestrus: H (3) = 20.89, p = 0.0001, Estrus: H (3) = 27.25, p < 0.0001). (D) The distance of estrus and diestrus female mice in the center area of the open-field test (Diestrus: H (3) = 11.22, p = 0.0106, Estrus: H (3) = 15.51, p = 0.0014). Kruskal-Wallis test followed by the Dunn’s Multiple comparisons, Mean ± S.E.M. (n = 10 for each group).
Figure 6
Figure 6
Females showed similar differences among four strains between the estrus and diestrus stages on depression-like behavior. (A) The immobile time of estrus and diestrus female mice among four different strains in the forced-swimming test (Diestrus: H (3) = 16.99, p = 0.0007, Estrus: H (3) = 11.69, p = 0.0085). (B) The latency to immobility of the estrus and diestrus female mice among four different strains in the forced-swimming test (Diestrus: H (3) = 7.963, p = 0.0468, Estrus: H (3) = 6.605, p = 0.0856). Kruskal-Wallis test followed by the Dunn’s Multiple comparisons, Mean ± S.E.M. (n = 10 for each group).
Figure 7
Figure 7
Females showed similar differences among four strains between the estrus and diestrus stage on social behavior. (A) The social interaction time of estrus and diestrus female mice among four different strains in the resident-intruder assay (Diestrus: H (3) = 19.66, p = 0.0002, Estrus: H (3) = 25.32, p < 0.0001). (B) The number of social bouts of estrus and diestrus female mice among four different strains in the resident-intruder assay (Diestrus: H (3) = 24.33, p < 0.0001, Estrus: H (3) = 25.36, p < 0.0001). (C) The latency of the estrus and diestrus female mice approaching the intruder among four different strains in the resident-intruder assay (Diestrus: H (3) = 20.69, p = 0.0001, Estrus: H (3) = 22.47, p < 0.0001). (D) The self-grooming time of estrus and diestrus female mice among four different strains in the resident-intruder assay (Diestrus: H (3) = 12.68, p = 0.0054, Estrus: H (3) = 12.65, p = 0.0055). Kruskal-Wallis test followed by the Dunn’s Multiple comparisons, Mean ± S.E.M. (n = 10 for each group).
Figure 8
Figure 8
Combining female data from both estrus and diestrus stages revealed many behavioral differences among the four strains. (A) The total travel distance of female mice among four different strains in the open-field test (H (3) = 48.75, p < 0.0001). (B) The time of female mice among four different strains in the center area of the open-field test (H (3) = 40.78, p < 0.0001). (C) The number of female mice among four different strains entered the center area of the open-field test (H (3) = 45.46, p < 0.0001). (D) The distance of female mice among four different strains in the center area of the open-field test (Diestrus: H (3) = 24.95, p < 0.0001). (E) The immobile time of female mice among four different strains in the forced-swimming test (H (3) = 28.39, p < 0.0001). (F) The latency to immobility of female mice among four different strains in the forced-swimming test (H (3) = 13.76, p = 0.0033). (G) The social interaction time of female mice among four different strains in the resident-intruder assay (H (3) = 46.00, p < 0.0001). (H) The number of social bouts of female mice among four different strains in the resident-intruder assay (H (3) = 42.47, p < 0.0001). (I) The latency of the female mice approaching the intruder among four different strains in the resident-intruder assay (H (3) = 49.10, p < 0.0001). (J) The self-grooming time of female mice among four different strains in the resident-intruder assay (H (3) = 25.65, p < 0.0001). Kruskal-Wallis test followed by Dunn’s Multiple comparisons, Mean ± S.E.M. (n = 20 for each group, 10 mice tested in both estrus and diestrus stages).
Figure 9
Figure 9
C57BL/6 males showed less anxiety-like behavior than females. (A) The total travel distance of male and female mice in the open-field test. (B) The time of male and female mice in the center area of the open-field test. (C) The number of male and female mice entered the center area of the open-field test. (D) The distance of male and female mice in the center area of the open-field test. Welch’s t-test, Mean ± S.E.M. (n = 10 for each group).
Figure 10
Figure 10
C57BL/6 males showed higher depression-like behavior than females. (A) The immobile time of male and female mice in the forced-swimming test. Welch’s t-test. (B) The latency to immobility of male and female mice in the forced-swimming test. Mann–Whitney U test. Mean ± S.E.M. (n = 10 for each group).
Figure 11
Figure 11
There was no significant difference in social and self-grooming behaviors between C57BL/6 male and female mice. (A) The total social interaction time of male and female mice with same-sex intruders in the resident-intruder assay. Welch’s t-test. (B) The number of social bouts of male and female mice in the resident-intruder assay. Mann–Whitney U test. (C) The latency of the male and female resident approaching the intruder in the resident-intruder assay. Welch’s t-test. (D) The self-grooming time of male and female mice in the resident-intruder assay. Mann–Whitney U test. Mean ± S.E.M. (n = 10 for each group).

References

    1. Ajayi A. F., Akhigbe R. E. (2020). Staging of the estrous cycle and induction of estrus in experimental rodents: an update. Fertil. Res. Pract. 6:5. doi: 10.1186/s40738-020-00074-3, PMID: - DOI - PMC - PubMed
    1. Bangasser D. A., Cuarenta A. (2021). Sex differences in anxiety and depression: circuits and mechanisms. Nat. Rev. Neurosci. 22, 674–684. doi: 10.1038/s41583-021-00513-0, PMID: - DOI - PubMed
    1. Becker J. B., Hu M. (2008). Sex differences in drug abuse. Front. Neuroendocrinol. 29, 36–47. doi: 10.1016/j.yfrne.2007.07.003, PMID: - DOI - PMC - PubMed
    1. Becker J. B., Koob G. F. (2016). Sex differences in animal models: focus on addiction. Pharmacol. Rev. 68, 242–263. doi: 10.1124/pr.115.011163 - DOI - PMC - PubMed
    1. Beery A. K., Zucker I. (2011). Sex bias in neuroscience and biomedical research. Neurosci. Biobehav. Rev. 35, 565–572. doi: 10.1016/j.neubiorev.2010.07.002, PMID: - DOI - PMC - PubMed

LinkOut - more resources