. 2023 Aug 2;25(9):euad213.
doi: 10.1093/europace/euad213.

Manual vs. automatic assessment of the QT-interval and corrected QT

Affiliations

Manual vs. automatic assessment of the QT-interval and corrected QT

Benjamin Neumann et al. Europace. .

Abstract

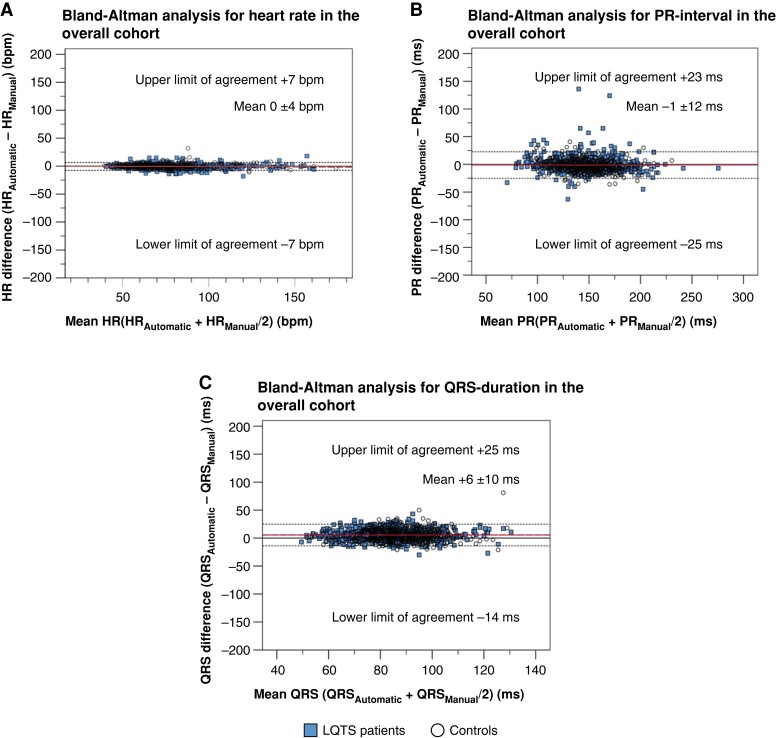
Aims: Sudden cardiac death (SCD) is challenging to predict. Electrocardiogram (ECG)-derived heart rate-corrected QT-interval (QTc) is used for SCD-risk assessment. QTc is preferably determined manually, but vendor-provided automatic results from ECG recorders are convenient. Agreement between manual and automatic assessments is unclear for populations with aberrant QTc. We aimed to systematically assess pairwise agreement of automatic and manual QT-intervals and QTc.

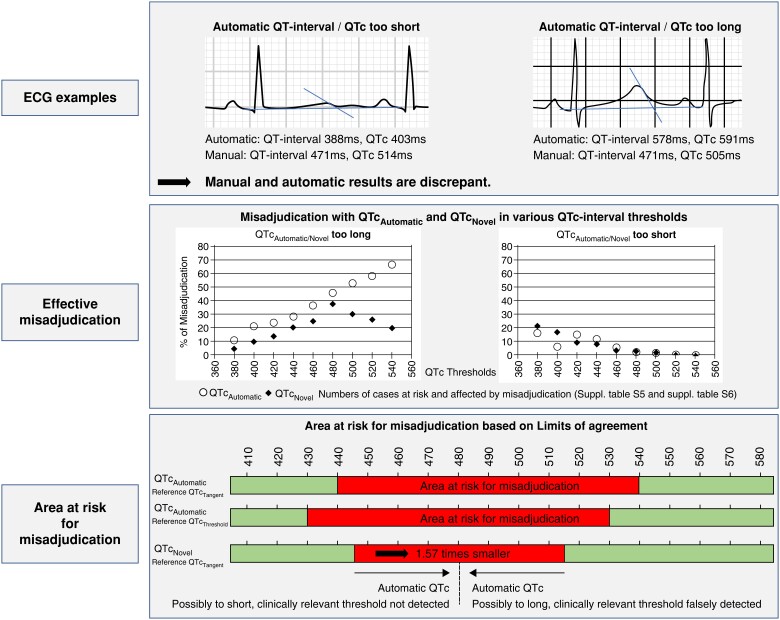
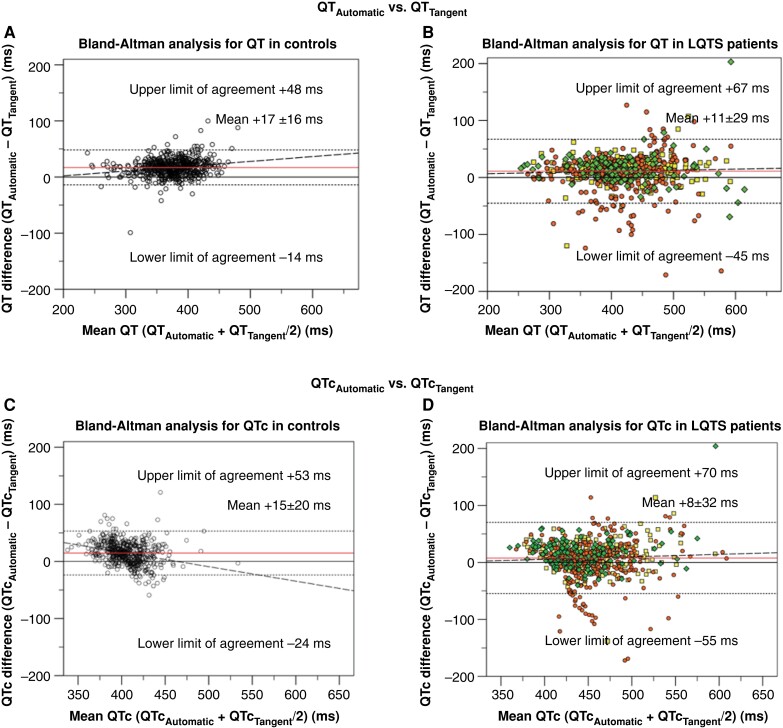
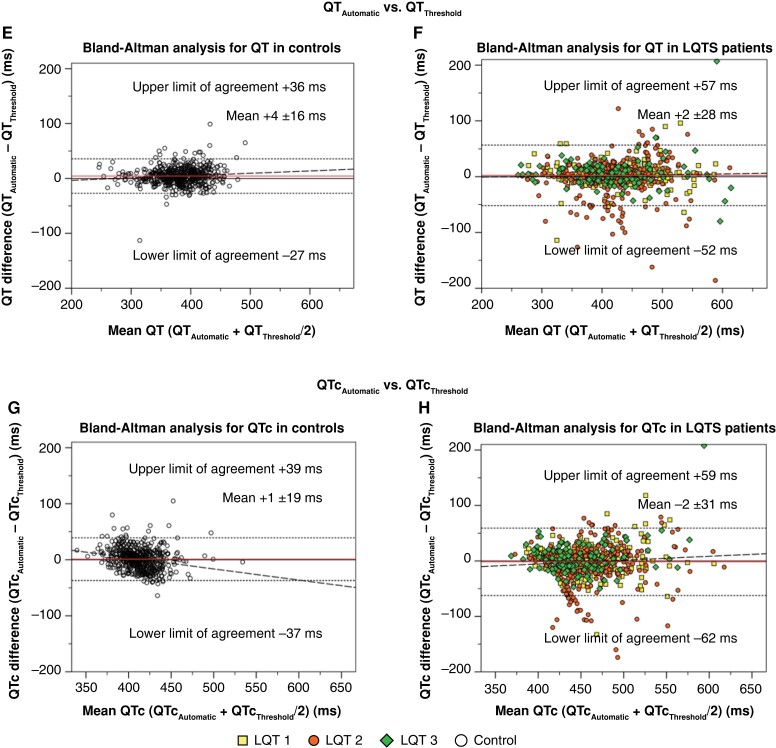
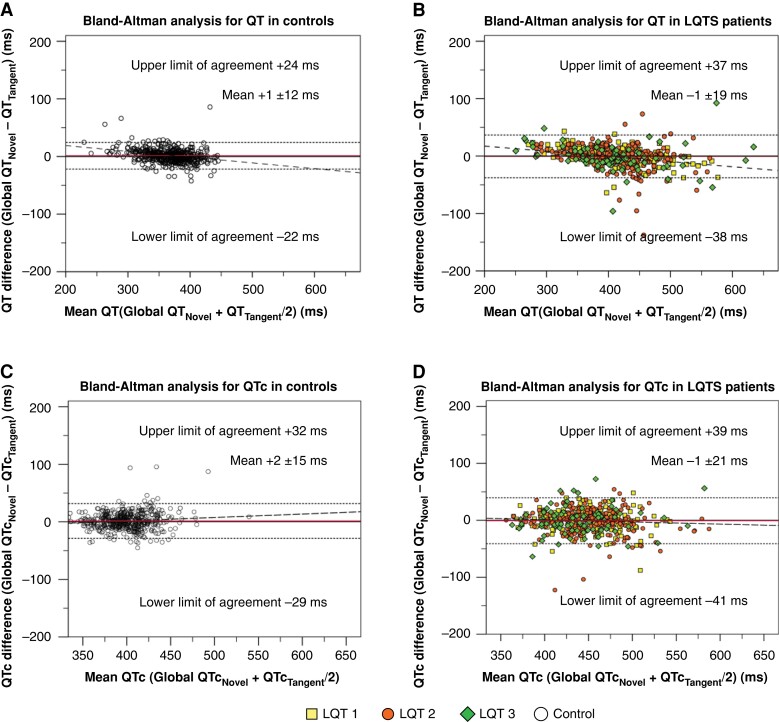
Methods and results: A multi-centre cohort enriching aberrant QTc comprised ECGs of healthy controls and long-QT syndrome (LQTS) patients. Manual QT-intervals and QTc were determined by the tangent and threshold methods and compared to automatically generated, vendor-provided values. We assessed agreement globally by intra-class correlation coefficients and pairwise by Bland-Altman analyses and 95% limits of agreement (LoA). Further, manual results were compared to a novel automatic QT-interval algorithm. ECGs of 1263 participants (720 LQTS patients; 543 controls) were available [median age 34 (inter-quartile range 35) years, 55% women]. Comparing cohort means, automatic and manual QT-intervals and QTc were similar. However, pairwise Bland-Altman-based agreement was highly discrepant. For QT-interval, LoAs spanned 95 (tangent) and 92 ms (threshold), respectively. For QTc, the spread was 108 and 105 ms, respectively. LQTS patients exhibited more pronounced differences. For automatic QTc results from 440-540 ms (tangent) and 430-530 ms (threshold), misassessment risk was highest. Novel automatic QT-interval algorithms may narrow this range.

Conclusion: Pairwise vendor-provided automatic and manual QT-interval and QTc results can be highly discrepant. Novel automatic algorithms may improve agreement. Within the above ranges, automatic QT-interval and QTc results require manual confirmation, particularly if T-wave morphology is challenging.

Keywords: Electrocardiogram; Long QT syndrome; Misassessment; QT-interval; QTc; Sudden cardiac death.


Conflict of interest statement

Conflict of interest: None declared.

Figures

Graphical abstract
Graphical abstract
Figure 1
Figure 1
Bland–Altman analysis for pairwise automatic vs. manual QT-interval and heart-rate corrected QT (QTc) agreement. All panels display Bland–Altman analyses. Horizontal (red) lines indicate the mean difference between assessment methods. Horizontal dotted lines indicate the upper and lower limits of agreement. Dashed lines indicate the regression line of pairwise differences. (A) Pairwise agreement between automatic QT-interval (QTAutomatic) and tangent QT-interval (QTTangent) among controls. (B) Pairwise agreement between QTAutomatic and QTTangent among LQTS patients. (C) Pairwise agreement between automatic corrected QT-interval (QTcAutomatic) and tangent corrected QT-interval (QTcTangent) among controls. (D) Pairwise agreement between QTcAutomatic and QTcTangent among long QT syndrome (LQTS) patients. (E) Pairwise agreement between QTAutomatic and threshold method QT-interval (QTThreshold) among controls. (F) Pairwise agreement between QTAutomatic and QTThreshold among LQTS patients. (G) Pairwise agreement between QTcAutomatic and threshold method corrected QT-interval (QTcThreshold) among controls. (H) Pairwise agreement between QTcAutomatic and QTcThreshold among LQTS patients.
Figure 1
Figure 1
Bland–Altman analysis for pairwise automatic vs. manual QT-interval and heart-rate corrected QT (QTc) agreement. All panels display Bland–Altman analyses. Horizontal (red) lines indicate the mean difference between assessment methods. Horizontal dotted lines indicate the upper and lower limits of agreement. Dashed lines indicate the regression line of pairwise differences. (A) Pairwise agreement between automatic QT-interval (QTAutomatic) and tangent QT-interval (QTTangent) among controls. (B) Pairwise agreement between QTAutomatic and QTTangent among LQTS patients. (C) Pairwise agreement between automatic corrected QT-interval (QTcAutomatic) and tangent corrected QT-interval (QTcTangent) among controls. (D) Pairwise agreement between QTcAutomatic and QTcTangent among long QT syndrome (LQTS) patients. (E) Pairwise agreement between QTAutomatic and threshold method QT-interval (QTThreshold) among controls. (F) Pairwise agreement between QTAutomatic and QTThreshold among LQTS patients. (G) Pairwise agreement between QTcAutomatic and threshold method corrected QT-interval (QTcThreshold) among controls. (H) Pairwise agreement between QTcAutomatic and QTcThreshold among LQTS patients.
Figure 2
Figure 2
Upper section depicts electrocardiogram (ECG) examples where automatic QT-analysis results in too short (left) or too long (right) measurements compared to manual assessment. Middle section visualizes percentage of automatic corrected QT-interval (QTcAutomatic) and QTcNovel results that are too long (left) or too short (right) compared to manual assessment. Percentage of misassessed ECGs is provided for select corrected QT (QTc) cut-offs from 380 to 540 ms. Lower section illustrates ranges (red) at risk for clinically relevant mis-assessment of QTcAutomatic relative to tangent corrected QT-interval (QTcTangent) (upper bar), QTcAutomatic relative to threshold corrected QT-interval (QTcThreshold) (middle bar), or QTcNovel (lower bar). Findings within red zones should be reviewed manually.
Figure 3
Figure 3
Bland–Altman analysis for pairwise automatic vs. manual QT-interval and corrected QT (QTc) agreement using a novel automatic algorithm. All panels display Bland–Altman analyses. Horizontal (red) lines indicate the mean difference between assessment methods. Horizontal dotted lines indicate the upper and lower limits of agreement. Dashed lines indicate the regression line of pairwise differences. (A) Pairwise agreement between QTNovel and tangent QT-interval (QTTangent) among controls. (B) Pairwise agreement between QTNovel and QTTangent among long QT syndrome (LQTS) patients. (C) Pairwise agreement between QTcNovel and tangent corrected QT-interval (QTcTangent) among controls. (D) Pairwise agreement between QTcNovel and QTcTangent among LQTS patients.
Figure 4
Figure 4
Bland–Altman analysis for pairwise automatic vs. manual heart rate, PR-interval, and QRS-duration agreement. All panels display Bland–Altman analyses. Horizontal (red) lines indicate the mean difference between assessment methods. Horizontal dotted lines indicate the upper and lower limits of agreement. Dashed lines indicate the regression line of pairwise differences. (A) Pairwise agreement for heart rate (HR) between automatic (HRAutomatic) and manual (HRManual). (B) Pairwise agreement for PR-interval between automatic (PRAutomatic) and manual (PRManual). (C) Pairwise agreement for QRS duration between automatic (QRSAutomatic) and manual (QRSManual).

References

    1. Bagnall RD, Weintraub RG, Ingles J, Duflou J, Yeates L, Lam Let al. . A prospective study of sudden cardiac death among children and young adults. N Engl J Med 2016;374:2441–52. - PubMed
    1. Eckart RE, Shry EA, Burke AP, McNear JA, Appel DA, Castillo-Rojas LMet al. . Sudden death in young adults: an autopsy-based series of a population undergoing active surveillance. J Am Coll Cardiol 2011;58:1254–61. - PubMed
    1. Priori SG, Aliot E, Blomstrom-Lundqvist C, Bossaert L, Breithardt G, Brugada Pet al. . Task force on sudden cardiac death of the European society of cardiology. Eur Heart J 2001;22:1374–450. - PubMed
    1. Myerburg RJ, Goldberger JJ. Sudden cardiac arrest risk assessment: population science and the individual risk mandate. JAMA Cardiol 2017;2:689–94. - PubMed
    1. Al-Khatib SM, Stevenson WG, Ackerman MJ, Bryant WJ, Callans DJ, Curtis ABet al. . 2017 AHA/ACC/HRS guideline for management of patients with ventricular arrhythmias and the prevention of sudden cardiac death: executive summary: a report of the American College of Cardiology/American Heart Association task force on clinical practice guidelines and the Heart Rhythm Society. Heart Rhythm 2018;15:e190–252. - PubMed