. 2023 Sep 1;4(5):394-417.
doi: 10.1158/2643-3230.BCD-23-0043.

A Single-Cell Taxonomy Predicts Inflammatory Niche Remodeling to Drive Tissue Failure and Outcome in Human AML

Affiliations

A Single-Cell Taxonomy Predicts Inflammatory Niche Remodeling to Drive Tissue Failure and Outcome in Human AML

Lanpeng Chen et al. Blood Cancer Discov. .

Abstract

Cancer initiation is orchestrated by an interplay between tumor-initiating cells and their stromal/immune environment. Here, by adapted single-cell RNA sequencing, we decipher the predicted signaling between tissue-resident hematopoietic stem/progenitor cells (HSPC) and their neoplastic counterparts with their native niches in the human bone marrow. LEPR+ stromal cells are identified as central regulators of hematopoiesis through predicted interactions with all cells in the marrow. Inflammatory niche remodeling and the resulting deprivation of critical HSPC regulatory factors are predicted to repress high-output hematopoietic stem cell subsets in NPM1-mutated acute myeloid leukemia (AML), with relative resistance of clonal cells. Stromal gene signatures reflective of niche remodeling are associated with reduced relapse rates and favorable outcomes after chemotherapy across all genetic risk categories. Elucidation of the intercellular signaling defining human AML, thus, predicts that inflammatory remodeling of stem cell niches drives tissue repression and clonal selection but may pose a vulnerability for relapse-initiating cells in the context of chemotherapeutic treatment.

Significance: Tumor-promoting inflammation is considered an enabling characteristic of tumorigenesis, but mechanisms remain incompletely understood. By deciphering the predicted signaling between tissue-resident stem cells and their neoplastic counterparts with their environment, we identify inflammatory remodeling of stromal niches as a determinant of normal tissue repression and clinical outcomes in human AML. See related commentary by Lisi-Vega and Méndez-Ferrer, p. 349. This article is featured in Selected Articles from This Issue, p. 337.


Figures

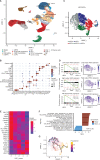
Figure 1. A cellular taxonomy of the human NBM. A, Uniform manifold approximation and projection (UMAP) plot of mononuclear cells from BM aspirates, representing 46,740 cells from 4 healthy donors. GMP, granulocyte–monocyte progenitors; MPP, multipotent progenitors; LMPP, lymphomyeloid primed progenitors; CLP, common lymphoid progenitors; MEP, megakaryocytes and erythroid progenitors; EC, endothelial cells. B, Expression of cell type–defining genes across all cell types. Color scale and dot size reflect levels and percentages of cells with detectable gene expression. C, Heterogeneity of the HSC/MPP population reflected in a UMAP plot, representing 2,763 cells. D and E, Identification of low-output HSCs (cluster 0) and high-output (clusters 1–4) HSC/MPPs, based on transcriptional homology with these subsets identified in mice. D, Gene signatures for low-output, high-output, and megakaryocyte (MK)-biased HSCs in the HSC/MPP subpopulations. E, Heat map showing differential expression of genes between clusters. F, Differentially expressed transcriptional programs in HSC cluster 0 in comparison with clusters 1–4, as demonstrated by Hallmark analysis. Positive normalized enrichment score (NES) reflects programs enriched in cluster 0, whereas negative scores indicate enrichment in clusters 1–4. FDR <0.05. G, Predicted HSC lineage progression by trajectory analysis. Calculated pseudotime is represented by color scale. HSC cluster 0 is set as a starting point.
Figure 1.
A cellular taxonomy of the human NBM. A, Uniform manifold approximation and projection (UMAP) plot of mononuclear cells from BM aspirates, representing 46,740 cells from 4 healthy donors. GMP, granulocyte–monocyte progenitors; MPP, multipotent progenitors; LMPP, lymphomyeloid primed progenitors; CLP, common lymphoid progenitors; MEP, megakaryocytes and erythroid progenitors; EC, endothelial cells. B, Expression of cell type–defining genes across all cell types. Color scale and dot size reflect levels and percentages of cells with detectable gene expression. C, Heterogeneity of the HSC/MPP population reflected in a UMAP plot, representing 2,763 cells. D and E, Identification of low-output HSCs (cluster 0) and high-output (clusters 1–4) HSC/MPPs, based on transcriptional homology with these subsets identified in mice. D, Gene signatures for low-output, high-output, and megakaryocyte (MK)-biased HSCs in the HSC/MPP subpopulations. E, Heat map showing differential expression of genes between clusters. F, Differentially expressed transcriptional programs in HSC cluster 0 in comparison with clusters 1–4, as demonstrated by Hallmark analysis. Positive normalized enrichment score (NES) reflects programs enriched in cluster 0, whereas negative scores indicate enrichment in clusters 1–4. FDR <0.05. G, Predicted HSC lineage progression by trajectory analysis. Calculated pseudotime is represented by color scale. HSC cluster 0 is set as a starting point.
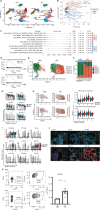
Figure 2. Transcriptional identification of BMSC heterogeneity in the human NBM. A, Predicted cellular interactions based on transcriptional networking by CellChat, identifying BMSCs as the dominant source of signaling to all other cells. In the circle plot, colors represent signal senders and width represents signal strength. In the heat map, signal strength is represented by the color scale. B, Predicted ligand–receptor interactions between BMSCs and other cell types. Color scale and dot size represent the probability and P value of interactions, respectively. C, Heterogeneity of the BMSC population reflected in the uniform manifold approximation and projection (UMAP) plot representing 3,236 cells. D, Differential expression of LEPR and genes encoding key HSPC regulatory factors in BMSC subset 0 represented by UMAP and Violin plots. ***, FDR-adjusted P value (Padj) < 0.001. ****, Padj < 0.0001. Differential gene-expression analysis is performed using the pseudoDE R package at the sample level (pair-wise comparison in individual samples). E, Relative strength of predicted HSPC-supportive signaling originating from distinct BMSC subsets, as assessed by CellphoneDB. Color scale and dot size represent the relative mean strength and P value of interactions, respectively.
Figure 2.
Transcriptional identification of BMSC heterogeneity in the human NBM. A, Predicted cellular interactions based on transcriptional networking by CellChat, identifying BMSCs as the dominant source of signaling to all other cells. In the circle plot, colors represent signal senders and width represents signal strength. In the heat map, signal strength is represented by the color scale. B, Predicted ligand–receptor interactions between BMSCs and other cell types. Color scale and dot size represent the probability and P value of interactions, respectively. C, Heterogeneity of the BMSC population reflected in the uniform manifold approximation and projection (UMAP) plot representing 3,236 cells. D, Differential expression of LEPR and genes encoding key HSPC regulatory factors in BMSC subset 0 represented by UMAP and Violin plots. ***, FDR-adjusted P value (Padj) < 0.001. ****, Padj < 0.0001. Differential gene-expression analysis is performed using the pseudoDE R package at the sample level (pair-wise comparison in individual samples). E, Relative strength of predicted HSPC-supportive signaling originating from distinct BMSC subsets, as assessed by CellphoneDB. Color scale and dot size represent the relative mean strength and P value of interactions, respectively.
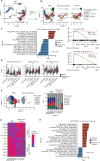
Figure 3. Remodeling of BMSC in NPM1m AML. A, Uniform manifold approximation and projection (UMAP) distribution of BM cells in NBM and AML. For AML, 49,758 cells from 6 patients are presented. B, Volcano plot of differentially (Padj < 0.05) expressed genes in BMSCs in AML versus NBM. Differential expression gene analysis is performed at the sample level using the pseudoDE R package. C and D, Differentially expressed transcriptional programs in BMSCs from AML in comparison with NBM, as demonstrated by Hallmark analysis (C) and GO term (D). Positive NES (normalized enrichment score) reflects programs enriched in AML, whereas negative scores indicate enrichment in NBM. E and F, Distribution and frequencies of BMSC subsets in AML and NBM. G, Expression of genes encoding HSPC regulatory factors in BMSC subsets in NBM and AML. H and I, Activation of transcriptional programs related to inflammation and connective tissue development in BMSC cluster 2, as demonstrated by gene signature calculation (H) and expression of inflammation- and ECM remodeling-associated genes (I). J and K, Inflammation of BMSCs in AML as demonstrated by expression of CD44 using fluorescence IHC on bone marrow biopsies. Scale bar, 50 μm (J) and flow cytometry on BM aspirate (K). n = 2 for NBM and n = 5 for AML. Investigations were performed in patients not included in the scRNA-seq analyses. *, P < 0.05 by an unpaired t test. Error bar represents mean ± SE.
Figure 3.
Remodeling of BMSC in NPM1m AML. A, Uniform manifold approximation and projection (UMAP) distribution of BM cells in NBM and AML. For AML, 49,758 cells from 6 patients are presented. B, Volcano plot of differentially (Padj < 0.05) expressed genes in BMSCs in AML versus NBM. Differential expression gene analysis is performed at the sample level using the pseudoDE R package. C and D, Differentially expressed transcriptional programs in BMSCs from AML in comparison with NBM, as demonstrated by Hallmark analysis (C) and GO term (D). Positive NES (normalized enrichment score) reflects programs enriched in AML, whereas negative scores indicate enrichment in NBM. E and F, Distribution and frequencies of BMSC subsets in AML and NBM. G, Expression of genes encoding HSPC regulatory factors in BMSC subsets in NBM and AML. H and I, Activation of transcriptional programs related to inflammation and connective tissue development in BMSC cluster 2, as demonstrated by gene signature calculation (H) and expression of inflammation- and ECM remodeling-associated genes (I). J and K, Inflammation of BMSCs in AML as demonstrated by expression of CD44 using fluorescence IHC on bone marrow biopsies. Scale bar, 50 μm (J) and flow cytometry on BM aspirate (K). n = 2 for NBM and n = 5 for AML. Investigations were performed in patients not included in the scRNA-seq analyses. *, P < 0.05 by an unpaired t test. Error bar represents mean ± SE.
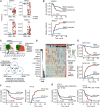
Figure 4. Nonleukemic hematopoiesis is suppressed in patients with AML, whereas NPM1-mutant cells display relative resistance. A, Uniform manifold approximation and projection (UMAP) distribution of NPM1-mutant (NPM1m; red) and residual normal/preleukemic cells (resid.norm/preleuk; blue) in the AML BM. NA (gray), not assignable. B, Distribution of normal, residual normal/preleukemic, and NPM1m cells within the HSPC and myeloid fractions in NBM and AML. C, Differentially expressed transcriptional programs in residual normal/preleukemic HSPCs in AML compared with HSPCs in NBM, as demonstrated by Hallmark analysis. Positive NES (normalized enrichment score) reflects programs enriched in residual normal, whereas negative scores indicate enrichment in NBM. All cells in HSC/MPPs, LMPPs, MEPs, erythroid progenitors, and GMP/monoblasts clusters were analyzed. D, Overexpression of Hallmark transcriptional signatures indicative of NFkB signaling, Apoptosis and P53 signaling in residual normal/preleukemic HSPC in comparison with their counterparts in the human NBM. ****, Padj < 0.0001 by the Wilcoxon test. E, Distribution and frequencies of HSC/MPP subsets of residual normal/preleukemic HSPCs in comparison with NBM. In two (out of six) AML samples, insufficient cells could be retrieved in the HSC/MPP subset for analysis. F, Enrichment of transcriptional programs indicative of low-output, quiescent, HSCs in residual normal/preleukemic HSC/MPPs in AML in comparison with their counterparts in the human NBM. G, Heat map for low- and high-output HSC marker genes in NBM and residual normal/preleukemic HSC/MPP population across all samples. H, Differentially expressed transcriptional programs in NPMm cells within the HSPC subsets in comparison with residual normal/preleukemic HSPCs, as demonstrated by Hallmark analysis. Positive NES (normalized enrichment score) reflects programs enriched in NPM1m HSPCs, whereas negative scores indicate enrichment in residual normal/preleukemic HSPCs. All cells in HSC/MPPs, LMPPs, MEPs, erythroid progenitors, and GMP/monoblasts clusters were used in the analysis.
Figure 4.
Nonleukemic hematopoiesis is suppressed in patients with AML, whereas NPM1-mutant cells display relative resistance. A, Uniform manifold approximation and projection (UMAP) distribution of NPM1-mutant (NPM1m; red) and residual normal/preleukemic cells (resid.norm/preleuk; blue) in the AML BM. NA (gray), not assignable. B, Distribution of normal, residual normal/preleukemic, and NPM1m cells within the HSPC and myeloid fractions in NBM and AML. C, Differentially expressed transcriptional programs in residual normal/preleukemic HSPCs in AML compared with HSPCs in NBM, as demonstrated by Hallmark analysis. Positive NES (normalized enrichment score) reflects programs enriched in residual normal, whereas negative scores indicate enrichment in NBM. All cells in HSC/MPPs, LMPPs, MEPs, erythroid progenitors, and GMP/monoblasts clusters were analyzed. D, Overexpression of Hallmark transcriptional signatures indicative of NFkB signaling, Apoptosis and P53 signaling in residual normal/preleukemic HSPC in comparison with their counterparts in the human NBM. ****, Padj < 0.0001 by the Wilcoxon test. E, Distribution and frequencies of HSC/MPP subsets of residual normal/preleukemic HSPCs in comparison with NBM. In two (out of six) AML samples, insufficient cells could be retrieved in the HSC/MPP subset for analysis. F, Enrichment of transcriptional programs indicative of low-output, quiescent, HSCs in residual normal/preleukemic HSC/MPPs in AML in comparison with their counterparts in the human NBM. G, Heat map for low- and high-output HSC marker genes in NBM and residual normal/preleukemic HSC/MPP population across all samples. H, Differentially expressed transcriptional programs in NPMm cells within the HSPC subsets in comparison with residual normal/preleukemic HSPCs, as demonstrated by Hallmark analysis. Positive NES (normalized enrichment score) reflects programs enriched in NPM1m HSPCs, whereas negative scores indicate enrichment in residual normal/preleukemic HSPCs. All cells in HSC/MPPs, LMPPs, MEPs, erythroid progenitors, and GMP/monoblasts clusters were used in the analysis.
Figure 5. TNFα induces inflammatory remodeling of stromal niches and a reduction in HSPC numbers in mice. A, Experimental design of TNFα administration to C57BL/6 mice. Five daily i.p. injections at a dose of 5 μg were administrated followed by flow-cytometric assessment of BM stromal niches in collagenased bone fractions. B, Cytopenia (anemia and thrombocytopenia) in TNFα-treated mice. **, P < 0.01 by an unpaired t test. C and D, Relative loss of LEPR+ BMSCs within the niche fraction upon TNFα exposure. **, P < 0.01 by an unpaired t test. E, Expression of inflammatory makers and HSPC niche factors in CD51+ LEPR+ and CD51+LEPR− BMSCs after TNFα injection in mice. *, P < 0.05 by an unpaired t test. F, Number of total BM cells, committed progenitors, and LKS HSPC subtypes in mice after TNFα injection. *, P < 0.05; **, P < 0.01 by an unpaired t test. Error bar represents mean ± SE. Veh, vehicle; WBC, white blood cell count; RBC, red blood cell count; HGB, hemoglobin; PLT, platelet.
Figure 5.
TNFα induces inflammatory remodeling of stromal niches and a reduction in HSPC numbers in mice. A, Experimental design of TNFα administration to C57BL/6 mice. Five daily i.p. injections at a dose of 5 μg were administrated followed by flow-cytometric assessment of BM stromal niches in collagenased bone fractions. B, Cytopenia (anemia and thrombocytopenia) in TNFα-treated mice. **, P < 0.01 by an unpaired t test. C and D, Relative loss of LEPR+ BMSCs within the niche fraction upon TNFα exposure. **, P < 0.01 by an unpaired t test. E, Expression of inflammatory makers and HSPC niche factors in CD51+ LEPR+ and CD51+LEPR BMSCs after TNFα injection in mice. *, P < 0.05 by an unpaired t test. F, Number of total BM cells, committed progenitors, and LKS HSPC subtypes in mice after TNFα injection. *, P < 0.05; **, P < 0.01 by an unpaired t test. Error bar represents mean ± SE. Veh, vehicle; WBC, white blood cell count; RBC, red blood cell count; HGB, hemoglobin; PLT, platelet.
Figure 6. Inflammatory stromal activation and impaired expression of HSPC factors in AML are variable between genetic subtypes and risk groups. A, Differentially expressed gene programs in BMSCs from AML (n = 62) in comparison with NBM (n = 8) as assessed by Hallmark GSEA. B, Differential expression of genes encoding inflammatory cytokines/modulators and HSPC niche markers/factors in BMSCs from AML in comparison with NBM. **, Padj < 0.01; ***, Padj < 0.001; ****, Padj < 0.0001 by the Wald test and adjusted by FDR. TPM, transcripts per million. C, Enrichment of gene sets and expression of genes encoding HSPC niche markers/factors in BMSCs from patients with AML related to mutational status. Enrichment scores are calculated using the gene set variation analysis (GSVA) program. D, Enrichment of gene sets and expression of HSPC niche markers/factors in BMSCs from patients with AML related to distinct ELN2017 genetic risk categories. Wilcoxon test is applied for statistical analysis. *, P < 0.05. ELN, European Leukemia Network.
Figure 6.
Inflammatory stromal activation and impaired expression of HSPC factors in AML are variable between genetic subtypes and risk groups. A, Differentially expressed gene programs in BMSCs from AML (n = 62) in comparison with NBM (n = 8) as assessed by Hallmark GSEA. B, Differential expression of genes encoding inflammatory cytokines/modulators and HSPC niche markers/factors in BMSCs from AML in comparison with NBM. **, Padj < 0.01; ***, Padj < 0.001; ****, Padj < 0.0001 by the Wald test and adjusted by FDR. TPM, transcripts per million. C, Enrichment of gene sets and expression of genes encoding HSPC niche markers/factors in BMSCs from patients with AML related to mutational status. Enrichment scores are calculated using the gene set variation analysis (GSVA) program. D, Enrichment of gene sets and expression of HSPC niche markers/factors in BMSCs from patients with AML related to distinct ELN2017 genetic risk categories. Wilcoxon test is applied for statistical analysis. *, P < 0.05. ELN, European Leukemia Network.
Figure 7. Gene signatures reflective of inflammatory niche remodeling are associated with favorable clinical outcomes in AML. A, Predicted BMSC subset size in the larger cohort of patients with AML (n = 62). ****, P < 0.0001 by the Wilcoxon test. B, Kaplan–Meier curves for overall survival (OS) and relapse probability indicating improved outcome in patients with the predicted loss of BMSC cluster 0. Cutoff is median frequency. Statistical significance is determined by a log-rank test. C, Construction of a gene signature reflective of niche remodeling (inflammatory activation and relative loss of BMSC cluster 0) in AML. 189 genes at the intersection of the genes differentially expressed in the BMSC-0 vs. other clusters in NBM, the genes differentially expressed in the BMSC-2 vs. other clusters in AML, and the genes differentially expressed in BMSCs in human AML vs. NBM were selected and tested for their correlation with outcome by multivariate Cox regression survival analysis. Thirteen of 189 genes were identified that were associated with outcome. D, Coefficient plot (left) and heat map (right) of the 13-gene signature. The gene-expression profile (GEP) score in each patient was calculated using the coefficient and z-scale of the genes. Based on the median GEP score, patients were stratified into two groups, with a high score reflecting relative preservation of niche integrity and a low score reflecting niche inflammatory disruption. E, Kaplan–Meier curves for overall survival (OS) and relapse probability indicating improved outcome in patients with niche inflammatory disruption. Cutoff is median score. Log-rank test is used for statistical analysis. F, Kaplan–Meier curves OS and relapse probability indicating improved outcome in patients with lower KITLG expression in BMSCs. Cutoff is median TPM. Log-rank test is used for statistical analysis. G, Kaplan–Meier curves for OS indicating improved outcome in age-matched patients with AML with lower KITLG expression in whole BM in Bohlander AML (GSE37642) cohort (n = 284) and TCGA-AML cohort (n = 98). Cutoff is 75th percentile normalized counts. Log-rank test is used for statistical analysis.
Figure 7.
Gene signatures reflective of inflammatory niche remodeling are associated with favorable clinical outcomes in AML. A, Predicted BMSC subset size in the larger cohort of patients with AML (n = 62). ****, P < 0.0001 by the Wilcoxon test. B, Kaplan–Meier curves for overall survival (OS) and relapse probability indicating improved outcome in patients with the predicted loss of BMSC cluster 0. Cutoff is median frequency. Statistical significance is determined by a log-rank test. C, Construction of a gene signature reflective of niche remodeling (inflammatory activation and relative loss of BMSC cluster 0) in AML. 189 genes at the intersection of the genes differentially expressed in the BMSC-0 vs. other clusters in NBM, the genes differentially expressed in the BMSC-2 vs. other clusters in AML, and the genes differentially expressed in BMSCs in human AML vs. NBM were selected and tested for their correlation with outcome by multivariate Cox regression survival analysis. Thirteen of 189 genes were identified that were associated with outcome. D, Coefficient plot (left) and heat map (right) of the 13-gene signature. The gene-expression profile (GEP) score in each patient was calculated using the coefficient and z-scale of the genes. Based on the median GEP score, patients were stratified into two groups, with a high score reflecting relative preservation of niche integrity and a low score reflecting niche inflammatory disruption. E, Kaplan–Meier curves for overall survival (OS) and relapse probability indicating improved outcome in patients with niche inflammatory disruption. Cutoff is median score. Log-rank test is used for statistical analysis. F, Kaplan–Meier curves OS and relapse probability indicating improved outcome in patients with lower KITLG expression in BMSCs. Cutoff is median TPM. Log-rank test is used for statistical analysis. G, Kaplan–Meier curves for OS indicating improved outcome in age-matched patients with AML with lower KITLG expression in whole BM in Bohlander AML (GSE37642) cohort (n = 284) and TCGA-AML cohort (n = 98). Cutoff is 75th percentile normalized counts. Log-rank test is used for statistical analysis.

Comment in

References

    1. Hanahan D, Weinberg RA. Hallmarks of cancer: the next generation. Cell 2011;144:646–74. - PubMed
    1. Gomariz A, Helbling PM, Isringhausen S, Suessbier U, Becker A, Boss A, et al. . Quantitative spatial analysis of haematopoiesis-regulating stromal cells in the bone marrow microenvironment by 3D microscopy. Nat Commun 2018;9:2532. - PMC - PubMed
    1. Kfoury Y, Scadden DT. Mesenchymal cell contributions to the stem cell niche. Cell Stem Cell 2015;16:239–53. - PubMed
    1. Ding L, Morrison SJ. Haematopoietic stem cells and early lymphoid progenitors occupy distinct bone marrow niches. Nature 2013;495:231–5. - PMC - PubMed
    1. Ding L, Saunders TL, Enikolopov G, Morrison SJ. Endothelial and perivascular cells maintain haematopoietic stem cells. Nature 2012;481:457–62. - PMC - PubMed

Publication types