. 2023 Sep 22;51(17):9055-9074.
doi: 10.1093/nar/gkad609.

Different SWI/SNF complexes coordinately promote R-loop- and RAD52-dependent transcription-coupled homologous recombination

Affiliations

Different SWI/SNF complexes coordinately promote R-loop- and RAD52-dependent transcription-coupled homologous recombination

Carlota Davó-Martínez et al. Nucleic Acids Res. .

Abstract

The SWI/SNF family of ATP-dependent chromatin remodeling complexes is implicated in multiple DNA damage response mechanisms and frequently mutated in cancer. The BAF, PBAF and ncBAF complexes are three major types of SWI/SNF complexes that are functionally distinguished by their exclusive subunits. Accumulating evidence suggests that double-strand breaks (DSBs) in transcriptionally active DNA are preferentially repaired by a dedicated homologous recombination pathway. We show that different BAF, PBAF and ncBAF subunits promote homologous recombination and are rapidly recruited to DSBs in a transcription-dependent manner. The PBAF and ncBAF complexes promote RNA polymerase II eviction near DNA damage to rapidly initiate transcriptional silencing, while the BAF complex helps to maintain this transcriptional silencing. Furthermore, ARID1A-containing BAF complexes promote RNaseH1 and RAD52 recruitment to facilitate R-loop resolution and DNA repair. Our results highlight how multiple SWI/SNF complexes perform different functions to enable DNA repair in the context of actively transcribed genes.


Figures

Graphical Abstract
Graphical Abstract
Figure 1.
Figure 1.
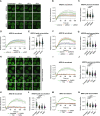
Different SWI/SNF complexes promote homologous recombination. (A) Schematic of the C-terminal tagging of endogenous ARID1A, ARID1B and BRG1 with mAID-mClover. Each homology-directed repair template also contained a neomycin or hygromycin gene for selection of transgenic cells. (B) Representative images showing nuclear localization of mAID-mClover-tagged ARID1A, ARID1B and BRG1 in fixed HCT116 cells. Cells were untreated or incubated with 0.1 μM auxin and 40 ng/ml doxycycline (aux/dox) for 48 h. DNA is stained with DAPI. (C) Immunoblot analysis of lysate of ARID1A-, ARID1B-, BRG1-mAID-mClover knock-in HCT116 cells untreated or treated with 0.1 μM auxin and 40 ng/ml doxycycline (Aux/Dox) for 48 h. Blots were stained with the indicated antibodies and tubulin was used as loading control. (D) Ionizing radiation (IR) colony survival assay of ARID1A-, ARID1B- and BRG1-mAID-mClover knock-in HCT116 cells incubated with or without auxin and doxycycline (aux/dox). Mean and SEM of three independent experiments. (E) PARPi colony survival assay of ARID1A-, ARID1B- and BRG1-mAID-mClover knock-in HCT116 cells incubated with or without auxin and doxycycline (aux/dox). Mean and SEM of three independent experiments. (F) Quantification of the percentage of ARID1A-, ARID1B-, BRG1-mClover-mAID HCT116 knock-in cells with RAD51 foci that had more than 10 foci/nucleus. HCT116 cells were incubated with or without auxin and doxycycline (aux/dox) for 48 h before irradiation. Cells were treated with 4 Gy ionizing radiation and fixed after 2 h. Mean and SEM of three independent experiments. (G) Immunofluorescence images showing RAD51 foci in irradiated ARID1A-, ARID1B- and BRG1-mAID-mClover knock-in HCT116 cells incubated with or without auxin and doxycycline (aux/dox) as described in (F). Cells were stained with RAD51 and GFP (to visualize mClover) antibodies and DNA was stained with DAPI. (H) Relative quantification of the intensity of RPA staining in laser-induced DNA damage tracks 30 min after multiphoton microirradiation of U2OS cells transfected with the indicated siRNAs. Mean and SEM of three independent experiments. (I) Immunofluorescence images showing RPA and γH2AX localization to DNA damage 30 min after multiphoton microirradiation of U2OS cells transfected with the indicated siRNAs. Cells were stained with antibodies against RPA34 and γH2AX. DNA is stained with DAPI. In each graph, numbers indicate p values, which were obtained using an unpaired t-test (in D–F) or one-way ANOVA test (in H). Scale bar, 10 μm.
Figure 2.
Figure 2.
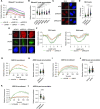
Different SWI/SNF complexes are recruited to double-strand breaks. (A) Representative images showing the real-time accumulation of endogenously mAID-mClover-tagged ARID1A, ARID1B and BRG1 in multiphoton laser-generated DNA damage tracks in HCT116 cells. (B) Quantification of real-time ARID1A-mAID-mClover recruitment to laser- tracks in HCT116 cells treated with control, BRG1 or BRM siRNA. Mean and SEM of four independent experiments. (C) Quantification of peak accumulation (85–105 s) in experiments shown in (B). Cells were pooled and for siCtrl-A n = 360, siBRG1 n = 306 and siBRM n = 345. (D) Quantification of real-time ARID1A-mAID-mClover recruitment to laser-tracks in HCT116 cells treated with control, ARID1B and CtIP siRNA. Mean and SEM of three independent experiments. (E) Quantification of peak accumulation (85–105 s) in experiments shown in (D). Cells were pooled and for siCtrl-A n = 308, siARID1B n = 255 and siCtIP n = 292. (F) Quantification of real-time ARID1B-mAID-mClover recruitment to laser-tracks in HCT116 cells treated with control, siARID1A, BRG1 or BRM siRNA. Mean and SEM of three independent experiments. (G) Quantification of peak accumulation (85–105 s) in experiments shown in (F). Cells were pooled and for siCtrl-B n = 118, siARID1A n = 102, siBRG1 n = 98 and siBRM n = 95. (H) Representative images showing the real-time accumulation of endogenously mClover-tagged ARID1A in HCT116 cells untreated or treated with 10 μM PARPi (KU0058948), 1 μM TSA or 5 mM NaBu. (I) Quantification of real-time ARID1A-mAID-mClover recruitment to laser-tracks in HCT116 cells untreated or treated with 10 μM PARPi (KU0058948), 1 μM TSA or 5 mM NaBu. Mean and SEM of three independent experiments (J) Quantification of peak accumulation (85–105 s) in experiments shown in (I). Cells were pooled and for untreated n = 217 cells, PARPi n = 76 cells, TSA n = 220 cells and NaBu n = 226 cells. (K) Quantification of real-time ARID1B-mAID-mClover recruitment to laser-tracks in HCT116 cells untreated or treated with 10 μM PARPi (KU0058948), 1 μM TSA or 5 mM NaBu. Mean and SEM of three (PARPi, TDA) or two (NaBu) independent experiments. (L) Quantification of peak accumulation (85–105 s) in experiments shown in (K). Cells were pooled and for untreated n = 146 cells, PARPi n = 107 cells, TSA n = 98 cells and NaBu n = 68 cells. (M) Quantification of real-time BRG1-mAID-mClover recruitment to laser-tracks in HCT116 cells untreated or treated with 10 μM PARPi (KU0058948), 1 μM TSA or 5 mM NaBu. Mean and SEM of three independent experiments. (N) Quantification of peak accumulation (85–105 s) in experiments shown in (M). Cells were pooled and for untreated n = 133 cells, PARPi n = 160 cells, TSA n = 172 cells and NaBu n = 144 cells. For quantification of the DNA damage recruitment, the relative fluorescence, corrected for background signal, was measured over time in the DNA damage tracks and normalized to the pre-damage fluorescence intensity. In each graph, numbers indicate P values obtained using a one-way ANOVA test. Scale bar, 10 μm.
Figure 3.
Figure 3.
SWI/SNF localizes to double-strand breaks in transcriptionally active DNA. (A) Quantification of real-time ARID1A-mAID-mClover recruitment to laser- tracks in HCT116 cells treated with control and CHD4 siRNA. Mean and SEM of three independent experiments. (B) Quantification of peak accumulation (85–105 s) in experiments shown in (A). Cells were pooled and for siCtrl-B n = 121 and siCHD4 n = 140. (C) Quantification of real-time ARID1A-mAID-mClover recruitment to laser-tracks in HCT116 cells treated with control, HDAC1 and HDAC2 siRNA. Mean and SEM of three independent experiments. (D) Quantification of peak accumulation (85–105 s) in experiments shown in (C). Cells were pooled and siCtrl-A n = 141, siHDAC1 n = 162 and siHDAC2 n = 152. (E) Quantification of real-time ARID1A-mAID-mClover recruitment to laser-tracks in HCT116 cells untreated or treated with 1 μM THZ1 or flavopiridol (Flavo). Mean and SEM of three independent experiments. (F) Quantification of peak accumulation (85–105 s) in experiments shown in (E). Cells were pooled and for untreated n = 142, THZ1 n = 172 and flavopiridol n = 154. (G) Quantification of real-time ARID1B-mAID-mClover recruitment to laser-tracks in HCT116 cells untreated or treated with 1 μM THZ1 or flavopiridol. Mean and SEM of three (THZ1) or two (flavopiridol) independent experiments. (H) Quantification of peak accumulation (85–105 s) in experiments shown in (G). Cells were pooled and for untreated n = 114, THZ1 n = 78 and flavopiridol n = 66. (I) Quantification of real-time BRG1-mAID-mClover recruitment to laser-tracks in HCT116 cells untreated or treated with 1 μM THZ1 or flavopiridol. Mean and SEM of three independent experiments. (J) Quantification of peak accumulation (85–105 s) in experiments shown in (I). Cells were pooled and for untreated n = 166, THZ1 n = 82 and Flavopiridol n = 143. For quantification of the DNA damage recruitment, the relative fluorescence, corrected for background signal, was measured over time in the DNA damage tracks and normalized to the pre-damage fluorescence intensity. In each graph, numbers indicate P values obtained using an unpaired t-test unpaired t-test (in B) or one-way ANOVA test (in D, F, H, J).
Figure 4.
Figure 4.
SWI/SNF promotes RAD52 recruitment to DSBs. (A) Quantification of real-time ARID1A-mAID-mClover recruitment to laser- tracks in HCT116 cells treated with control and RAD52 siRNA. Mean and SEM of three independent experiments. (B) Quantification of peak accumulation (85–105 s) in experiments shown in (A). Cells were pooled and for siCtrl-B n = 132 and siRAD52 n = 119. (C) Representative images showing the real-time accumulation of GFP-RAD52 to laser-tracks in HCT116 and in U2OS cells. (D) Quantification of real-time GFP-RAD52 recruitment to laser-tracks in HCT116 cells untreated or treated with 1 μM THZ1 or 1 μM flavopiridol (Flavo). Mean and SEM of three (Flavo) or two (THZ1) independent experiments (E). Quantification of peak accumulation (35–55 s) in experiments shown in (D). Cells were pooled and for untreated n = 71, THZ1 n = 42 and Flavopiridol n = 85. (F) Quantification of real-time GFP-RAD52 recruitment to laser-tracks in HCT116 cells treated with control or ARID1A siRNA. Mean and SEM of three independent experiments. (G) Quantification of peak accumulation (35–55 s) in experiments shown in (F). Cells were pooled and for siCtrl-B n = 69 and siARID1A n = 62. (H) Quantification of real-time GFP-RAD52 recruitment to laser-tracks in hCdt1-mKO2-transgenic U2OS cells untreated or treated with 1 μM THZ1. hCdt1-mKO2 expression was used as marker for G1 cell cycle phase. Mean and SEM of three independent experiments (I) Quantification of peak accumulation (45–65 s) in experiments shown in (H). Cells were pooled and for untreated G1 n = 14, untreated S/G2 n = 53, THZ1 S/G2 n = 36 and THZ1 G1 n = 6. (J) Quantification of real-time GFP-RAD52 recruitment to laser-tracks in hCdt1-mKO2-transgenic U2OS cells treated with control or ARID1A siRNA. hCdt1-mKO2 expression was used as marker for G1 cell cycle phase. Mean and SEM of five independent experiments. (K) Quantification of peak accumulation (45–65 s) in experiments shown in (J). Cells were pooled and for siCtrl-B S/G2 n = 68, siCtrl-B G1 n = 17, siARID1A G2/S n = 58 and siARID1A G1 n = 23. (L) Quantification of real-time GFP-RAD52 recruitment to laser tracks in hCdt1-mKO2-transgenic U2OS cells treated with control or EXO1 siRNA. hCdt1-mKO2 expression was used as marker for G1 cell cycle phase. Mean and SEM of three independent experiments. (M) Quantification of peak accumulation (45–65 s) in experiments shown in (L). Cells were pooled and for siCtrl-B S/G2 n = 67, siCtrl-B G1 n = 9, siEXO1 G2/S n = 58 and siEXO1 G1 n = 13. For quantification of the DNA damage recruitment, the relative fluorescence, corrected for background signal, was measured over time in the DNA damage tracks and normalized to the pre-damage fluorescence intensity. In each graph, numbers indicate p values obtained using an unpaired t-test (in B, G, I, K, M) or one-way ANOVA test (in E). Scale bar, 10 μm.
Figure 5.
Figure 5.
ARID1A and EXO1 promote stable RAD52 recruitment to DSBs. (A) Representative images showing the real-time accumulation of GFP-RAD52 to laser-tracks in hCdt1-mKO2-transgenic U2OS cells either in cell cycle phase G1 (hCdt1-mKO2 positive) or in S/G2 (hCdt1-mKO2 negative). (B) Quantification of real-time GFP-RAD52 recruitment to laser-tracks in hCdt1-mKO2-transgenic U2OS cells treated with control or EXO1 siRNA. Mean and SEM of three independent experiments. (C) Quantification of peak accumulation (815–875 s) in experiments shown in (B). Cells were pooled and for siCtrl-B S/G2 n = 59, siCtrl-B G1 n = 12, EXO1 S/G2 n = 52 and EXO1 G1 n = 9. (D) Quantification of real-time GFP-RAD52 recruitment to laser-tracks in hCdt1-mKO2-transgenic U2OS cells untreated or treated with 1 μM flavopiridol (Flavo). Mean and SEM of three independent experiments. (E) Quantification of peak accumulation (815–875 s) in experiments shown in (D). Cells were pooled and for untreated S/G2 n = 44, untreated G1 n = 8, flavopiridol s/G2 n = 57 and flavopiridol G1 n = 6. (F) Quantification of real-time GFP-RAD52 recruitment to laser-tracks in hCdt1-mKO2-transgenic U2OS cells treated with control or ARID1A siRNA. Mean and SEM of three independent experiments. (G) Quantification of peak accumulation (815–875 s) in experiments shown in (F). Cells were pooled and for siCtrl-B S/G2 n = 73, siCtrl-B G1 n = 11, siARID1A G2/S n = 22 and siARID1A G1 n = 22. (H) Quantification of real-time GFP-RAD52 recruitment to laser-tracks in hCdt1-mKO2-transgenic U2OS cells treated with control or ARID1A siRNA with or without 1 μM flavopiridol treatment. Mean and SEM of three independent experiments. (I) Quantification of peak accumulation (815–875 s) in experiments shown in (H). Cells were pooled and for siCtrl-B S/G2 n = 42, siCtrl-B G1 n = 7, siARID1A G2/S n = 34, siARID1A G1 n = 16, siARID1A + flavopiridol S/G2 n = 27 and siARID1A + flavopiridol G1 n = 19. hCdt1-mKO2 expression was used as marker for G1 cell cycle phase. For quantification of the DNA damage recruitment, the relative fluorescence, corrected for background signal, was measured over time in the DNA damage tracks and normalized to the pre-damage fluorescence intensity. In each graph, numbers indicate P values obtained using an unpaired t-test (in C, E, G, I). Scale bar, 10 μm.
Figure 6.
Figure 6.
ARID1A promotes RNaseH1-mediated R-loop resolution near DNA breaks. (A) Quantification of real-time GFP-RNaseH1(D210N) (mutation indicated with *) recruitment to laser tracks in U2OS cells treated with control, ARID1A, ARID1B, BRG1, BRM and XPG siRNAs. Mean and SEM of three independent experiments. (B) Quantification of peak accumulation (35–45 s) in experiments shown in (A). Cells were pooled and for siCtrl-B n = 96, siARID1A n = 68, siARID1B n = 99, siBRG1 n = 82, BRM n = 72 and siXPG n = 86. (C) Representative immunofluorescence images showing S9.6 RNA-DNA hybrid staining in control, ARID1A and RNaseH1-depleted MRC-5 cells in unperturbed conditions. DNA is stained using DAPI. (D) Quantification of nuclear S9.6 signal intensity in immunofluorescence experiments in MRC-5 cells as depicted in (C). Pooled cells from three independent experiments where siCtrl-B n = 391, siARID1A n = 373 and siRNaseH1 n = 404. (E) Representative immunofluorescence images showing S9.6 RNA–DNA hybrid staining in laser-irradiated MRC-5 cells treated with control, ARID1A or RNaseH1 siRNA. Cells were fixed 1 min after laser irradiation. γH2AX staining is used as DNA damage marker and DNA is stained using DAPI. (F) Quantification of S9.6 signal intensity along a line perpendicular to the laser-induced DNA damage track marked by γH2AX in immunofluorescence experiments in MCR-5 cells as depicted in (E). The image shows the mean and SEM of three independent experiments. (G) Quantification of real-time ARID1A-mAID-mClover recruitment to laser-tracks in HCT116 treated with control or RNaseH1 siRNAs. Mean and SEM of three independent experiments. (H) Quantification of peak accumulation (85–105 s) in experiments shown in (G). Cells were pooled and for siCtrl n = 132 and siRNaseH1 n = 113. (I) Quantification of real-time ARID1A-mAID-mClover recruitment to laser-tracks in HCT116 cells treated with control or XPG siRNAs. Mean and SEM of three independent experiments. (J) Quantification of peak accumulation (85–105 s) in experiments shown in i. Cells were pooled and for siCtrl n = 169 and XPG n = 161. (K) Quantification of real-time ARID1A-mAID-mClover recruitment to laser-tracks in HCT116 cells untreated or overexpressing RNaseH1-mCherry. Mean and SEM of three independent experiments. (L) Quantification of peak accumulation (85–105 s) in experiments shown in (K). Cells were pooled and for untreated n = 92 and RNaseH1-mCherry overexpression n = 52. For quantification of the DNA damage recruitment, the relative fluorescence, corrected for background signal, was measured over time in the DNA damage tracks and normalized to the pre-damage fluorescence intensity. In each graph, numbers indicate P values obtained using an unpaired t-test (in H, J, L) or one-way ANOVA test (in B, D). Scale bar, 10 μm.
Figure 7.
Figure 7.
PBAF, ncBAF and BAF complexes initiate and maintain transcriptional silencing by promoting RNA polymerase II eviction. (A) Representative images of real-time GFP-RPB1 eviction in laser-generated DNA damage tracks in MRC-5 cells. Arrowheads indicate where the DNA damage was induced. (B) Quantification of real-time GFP-RPB1 eviction in laser-tracks in MRC-5 cells untreated or treated with 1 μM THZ1 or 1 μM flavopiridol (flavo). Mean and SEM of three (flavo) or two (THZ1) independent experiments. (C) Quantification of eviction (35–55 s) in experiments shown in (B). Cells were pooled and for untreated n = 164, THZ1 n = 85 and Flavopiridol n = 101. (D) Quantification of real-time GFP-RPB1 eviction in laser-tracks in MRC-5 cells treated with control, ARID1A, BRG1 or CHD4 siRNA. Mean and SEM of three independent experiments. (E) Quantification of eviction (35–55 s) in experiments shown in (D). Cells were pooled and for siCtrl-B n = 92, siARID1A n = 99, siBRG1 n = 64 and siCHD4 n = 77. (F) Scheme showing the assay used to monitor nascent transcription by visualizing 5-ethynyl uridine (5-EU) incorporation. Following multiphoton laser-irradiation cells were immediately incubated with 5-EU (no recovery) or after a 1 h recovery period. (G) Representative images of laser-irradiated U2OS cells transfected with the indicated siRNAs and incubated with 5-EU immediately after damage induction. Nascent transcription is visualized by labeling 5-EU with Atto 594 and DNA damage by staining for γH2AX. DNA is stained using DAPI. Arrowheads indicate where the DNA damage was induced. (H) Quantification of nascent transcription levels immediately after damage along a line perpendicular to the laser-induced DNA damage track marked by γH2AX as shown in (G). siCtrl-B, siARID1A, siBRG1 and siCHD4-treated U2OS cells were incubated with 5-EU immediately after damage induction. The image shows the mean and SEM of four (siCtrl-B, siARID1A and siBRG1) or three (siCHD4) independent experiments. (I) Quantification of nascent transcription levels 1 h after damage along a line perpendicular to the laser-induced DNA damage track marked by γH2AX as shown in Supplementary Figure S5G. siCtrl-B, siARID1A, siBRG1 and siCHD4-treated U2OS cells were incubated with 5-EU 1 h after damage induction. The image shows the mean and SEM of four (siCtrl, siBRG1) or three (siARID1A, siCHD4) independent experiments. (J) Model of the multiple functions of SWI/SNF during transcription-coupled homologous recombination. Upon DSB formation in active genes, PARP-dependent signaling recruits the NuRD and BRG1-containing PBAF and ncBAF complexes, which promote Pol II eviction and initial transcriptional silencing. Different BAF complexes are recruited in a PARP-, NuRD and R-loop-dependent manner to facilitate (i) maintenance of Pol II eviction and transcriptional silencing by a BRG1/ARID1A-BAF complex; (ii) RNaseH1 recruitment to resolve R-loops by a BRM/ARID1A-BAF complex and (iii) RAD52 accumulation to promote HR by an ARID1A-containing BAF complex. For quantification of the DNA damage eviction, the relative fluorescence, corrected for background signal, was measured over time in the DNA damage tracks and normalized to the pre-damage fluorescence intensity. In each graph, numbers indicate p values obtained using a one-way ANOVA test (in E, C). Scale bar, 10 μm.

References

    1. Jackson S.P., Bartek J.. The DNA-damage response in human biology and disease. Nature. 2009; 461:1071–1078. - PMC - PubMed
    1. Jasin M., Rothstein R.. Repair of strand breaks by homologous recombination. Cold Spring Harb. Perspect. Biol. 2013; 5:a012740. - PMC - PubMed
    1. Lans H., Hoeijmakers J.H.J., Vermeulen W., Marteijn J.A.. The DNA damage response to transcription stress. Nat. Rev. Mol. Cell Biol. 2019; 20:766–784. - PubMed
    1. Jia N., Guo C., Nakazawa Y., van den Heuvel D., Luijsterburg M.S., Ogi T.. Dealing with transcription-blocking DNA damage: repair mechanisms, RNA polymerase II processing and human disorders. DNA Repair (Amst.). 2021; 106:103192. - PubMed
    1. Klein I.A., Resch W., Jankovic M., Oliveira T., Yamane A., Nakahashi H., Di Virgilio M., Bothmer A., Nussenzweig A., Robbiani D.F.et al. .. Translocation-capture sequencing reveals the extent and nature of chromosomal rearrangements in B lymphocytes. Cell. 2011; 147:95–106. - PMC - PubMed

Publication types

MeSH terms