. 2023 Dec;19(12):3132-3150.
doi: 10.1080/15548627.2023.2239042. Epub 2023 Jul 23.

Periplocin suppresses the growth of colorectal cancer cells by triggering LGALS3 (galectin 3)-mediated lysophagy

Affiliations

Periplocin suppresses the growth of colorectal cancer cells by triggering LGALS3 (galectin 3)-mediated lysophagy

Kui Wang et al. Autophagy. 2023 Dec.

Abstract

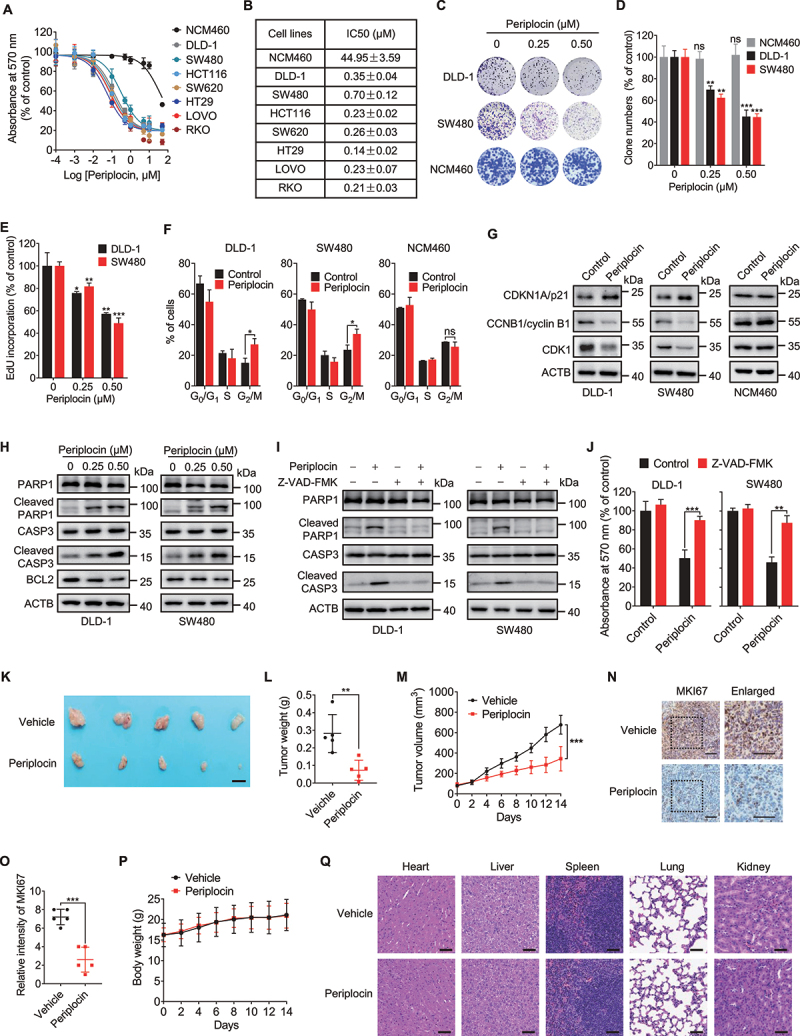
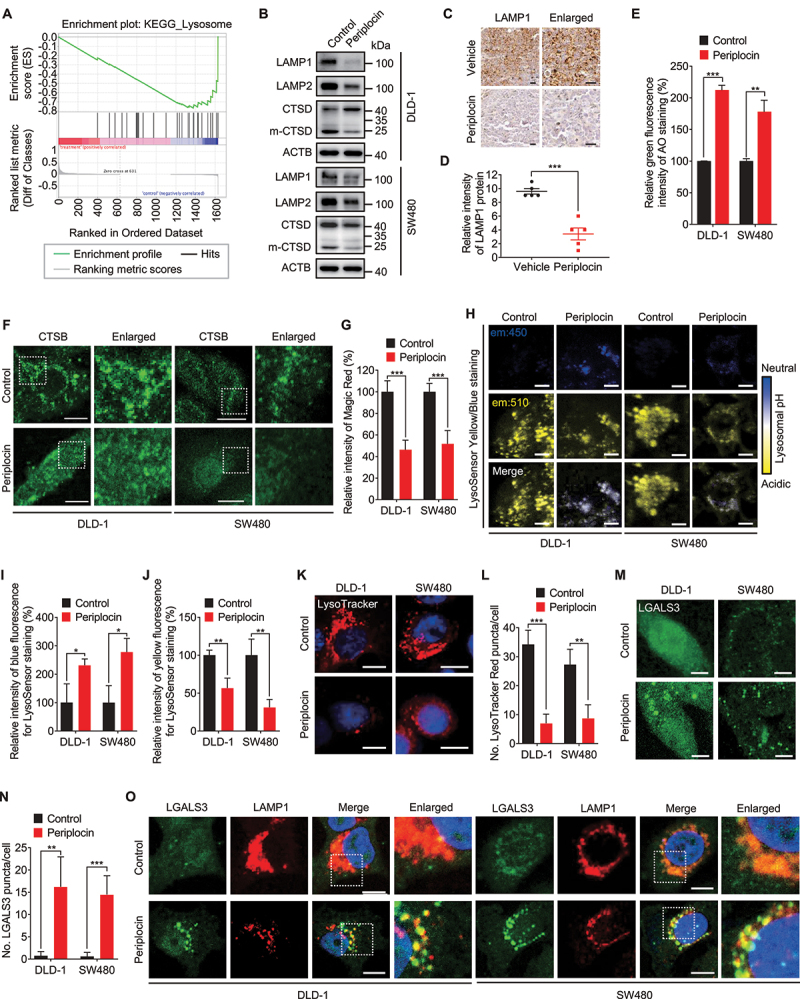
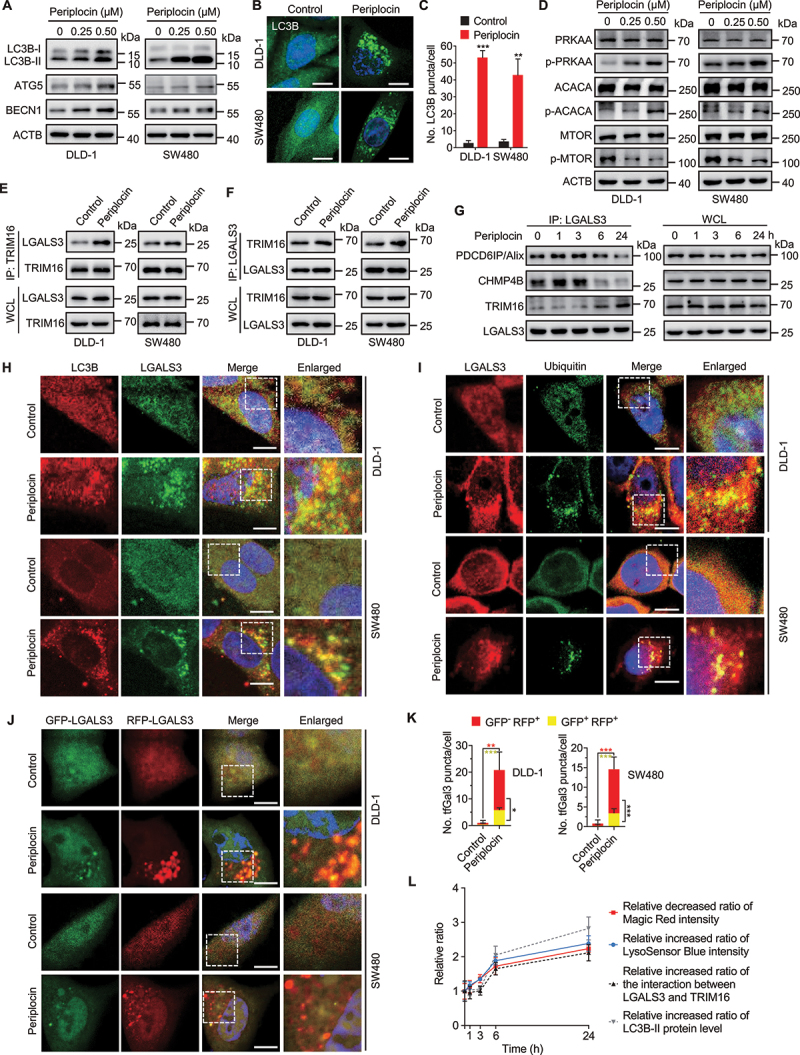
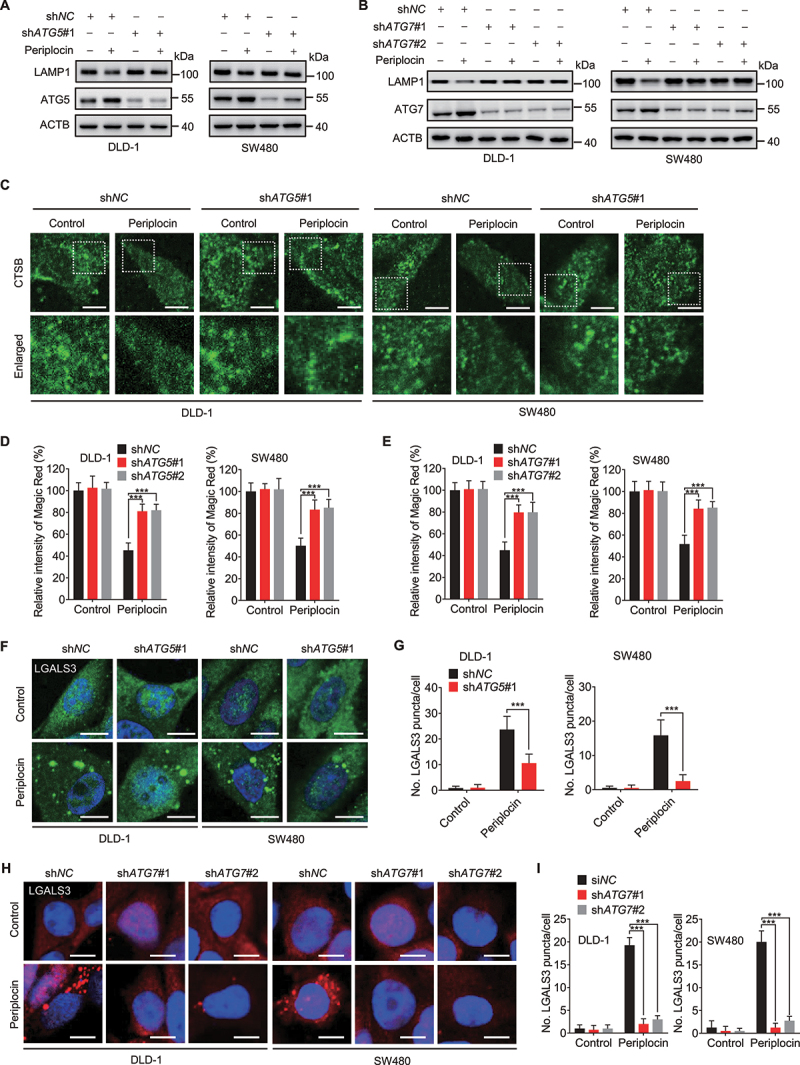
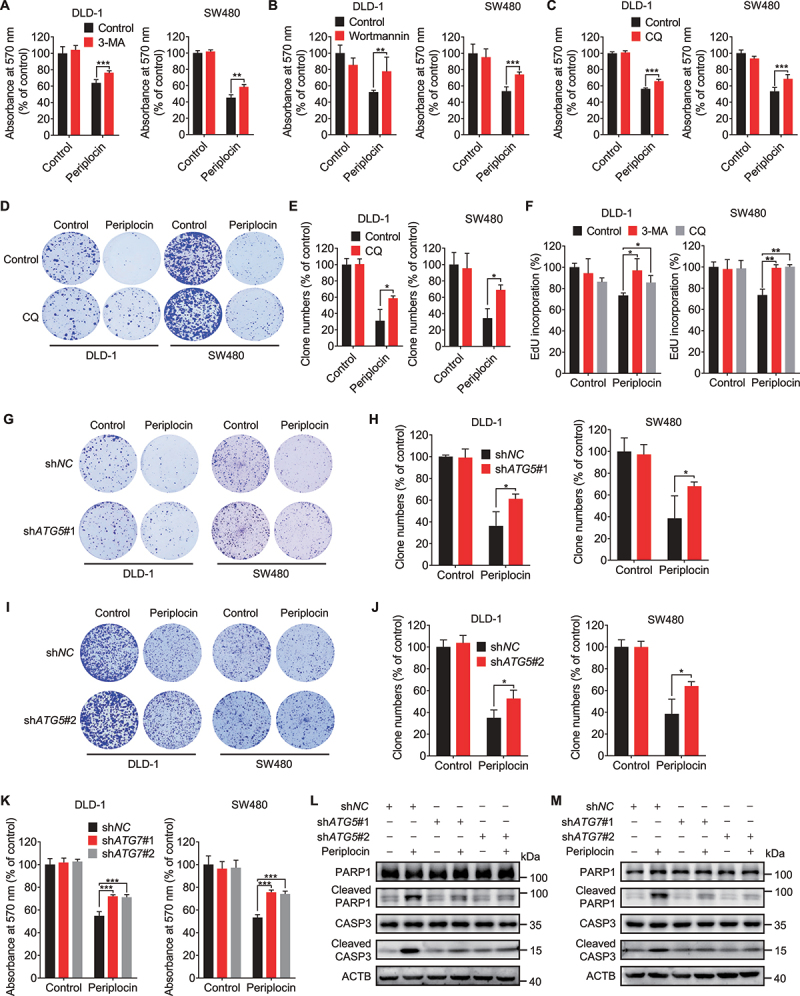
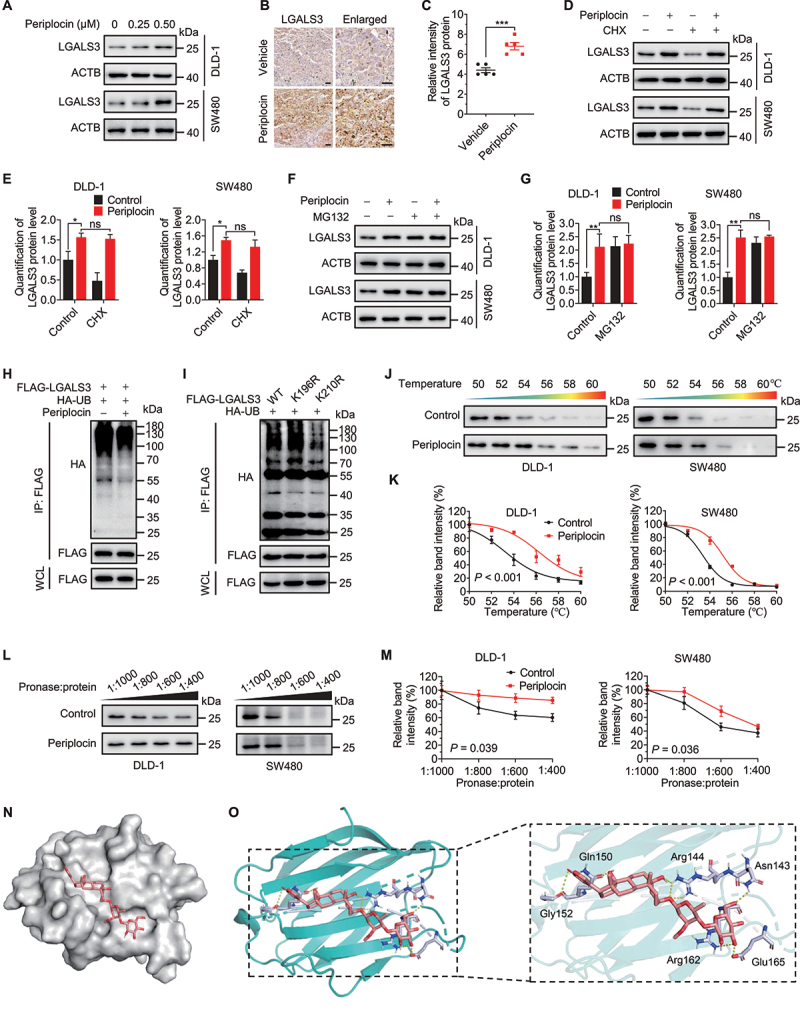
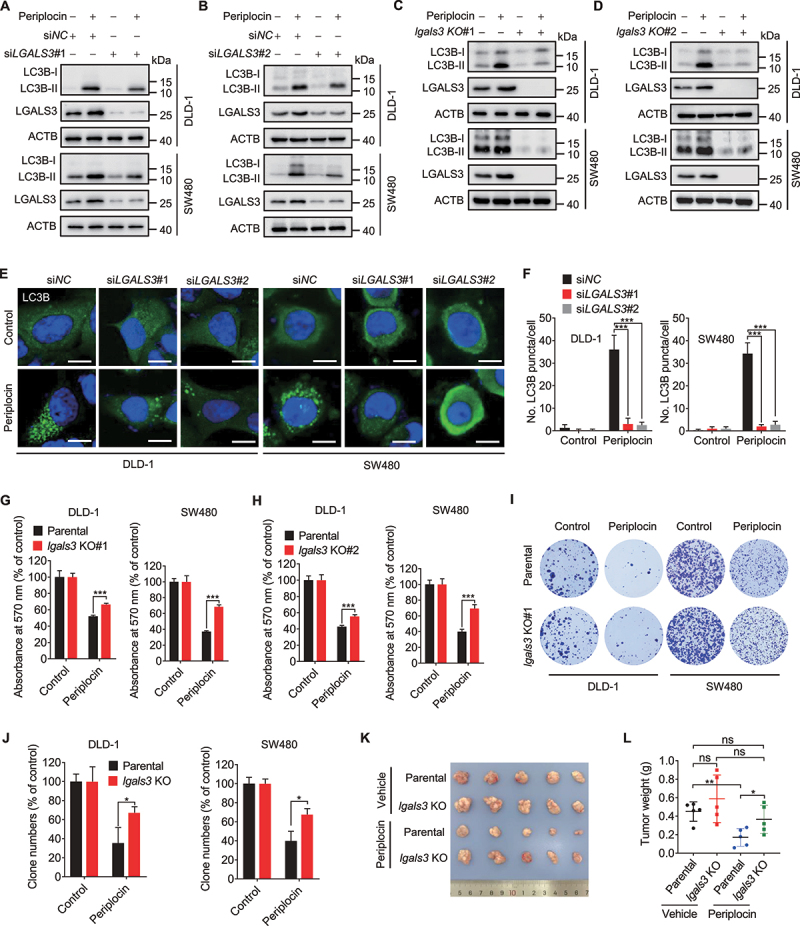
Colorectal cancer (CRC) is one of the most common malignancies worldwide and remains a major clinical challenge. Periplocin, a major bioactive component of the traditional Chinese herb Cortex periplocae, has recently been reported to be a potential anticancer drug. However, the mechanism of action is poorly understood. Here, we show that periplocin exhibits promising anticancer activity against CRC both in vitro and in vivo. Mechanistically, periplocin promotes lysosomal damage and induces apoptosis in CRC cells. Notably, periplocin upregulates LGALS3 (galectin 3) by binding and preventing LGALS3 from Lys210 ubiquitination-mediated proteasomal degradation, leading to the induction of excessive lysophagy and resultant exacerbation of lysosomal damage. Inhibition of LGALS3-mediated lysophagy attenuates periplocin-induced lysosomal damage and growth inhibition in CRC cells, suggesting a critical role of lysophagy in the anticancer effects of periplocin. Taken together, our results reveal a novel link between periplocin and the lysophagy machinery, and indicate periplocin as a potential therapeutic option for the treatment of CRC.Abbreviations: 3-MA: 3-methyladenine; ACACA/ACC1: acetyl-CoA carboxylase alpha; AMPK: adenosine monophosphate-activated protein kinase; AO: Acridine orange; ATG5: autophagy related 5; ATG7: autophagy related 7; CALM: calmodulin; CHX: cycloheximide; CRC: colorectal cancer; CQ: chloroquine; CTSB: cathepsin B; CTSD: cathepsin D; ESCRT: endosomal sorting complex required for transport; LAMP1: lysosomal associated membrane protein 1; LMP: lysosomal membrane permeabilization; MAP1LC3B/LC3B: microtubule associated protein 1 light chain 3 beta; MCOLN1/TRPML1: mucolipin TRP cation channel 1; MKI67/Ki-67: marker of proliferation Ki-67; MTOR: mechanistic target of rapamycin kinase; P2RX4/P2X4: purinergic receptor P2X 4; PARP1/PARP: poly(ADP-ribose) polymerase 1; PRKAA/AMPKα: protein kinase AMP-activated catalytic subunit alpha; SQSTM1/p62: sequestosome 1; TFEB: transcription factor EB; TRIM16: tripartite motif containing 16.

Keywords: Autophagic flux; LGALS3 (galectin 3); colorectal cancer; lysophagy; lysosomal damage; periplocin.


Conflict of interest statement

No potential conflict of interest was reported by the authors.

Figures

Figure 1.
Figure 1.
Periplocin exhibits anticancer effect against CRC in vitro and in vivo. (A) Cell viability of human CRC cell lines and colon mucosal epithelial cell line NCM460 treated with periplocin for 24 h at the indicated concentrations. (B) IC50 values of periplocin in CRC cells and NCM460 cells as treated in (A). (C-E) Cells were subjected to periplocin treatment at the indicated concentrations for 24 h. Cell proliferation was determined by colony formation (C and D) and EdU incorporation (E). (F) Cell cycle distribution of DLD-1, SW480, and NCM460 cells treated with 0.50 μM periplocin for 24 h determined by flow cytometry. (G) Immunoblotting analysis of CDKN1A/p21, CCNB1/cyclin B1, and CDK1 in DLD-1, SW480, and NCM460 cells treated with 0.50 μM periplocin for 24 h. (H) Immunoblotting analysis of PARP1, cleaved PARP1, CASP3, cleaved CASP3, and BCL2 in DLD-1 and SW480 cells treated with periplocin for 24 h at the indicated concentrations. (I and J) DLD-1 and SW480 cells were treated with 0.50 μM periplocin for 24 h in the presence or absence of Z-VAD-FMK. Immunoblotting analysis was performed to detect the protein levels of PARP1, cleaved PARP1, CASP3, and cleaved CASP3 (I), and MTT assay was conducted to examine cell growth (J). (K-M) SW480 cells were subcutaneously inoculated into nude mice. Mice were injected with vehicle or periplocin (15 mg/kg/day) for two weeks. Image (K), weight (L), and volume (M) of tumor xenografts were shown. Scale bar: 1 cm. (N and O) Representative images (N) and quantitative analysis (O) of immunohistochemical staining for MKI67 in tumor xenografts. Scale bar: 50 μm. (P) Body weight of tumor-bearing mice was monitored at the indicated periods. (Q) H&E staining of the heart, liver, spleen, lung, and kidney from tumor-bearing mice. Scale bar: 100 μm. Results in (A-J) are representative of three independent experiments. Data are presented as mean ± SD. *P < 0.05, **P < 0.01, ***P < 0.001. ns, non-significant.
Figure 2.
Figure 2.
Periplocin induces lysosomal damage in CRC cells. (A) TMT-based quantitative proteomics analysis was used to profile the global protein expression in SW480 cells treated with or without 0.50 μM periplocin for 24 h. The differentially expressed lysosome-associated proteins were enriched by gene set enrichment analysis (GSEA). (B) Immunoblotting analysis of LAMP1, LAMP2 and CTSD under 0.50 μM periplocin treatment for 24 h. m-CTSD, mature CTSD. (C and D) Representative images (C) and quantitative analysis (D) of immunohistochemical staining for LAMP1 in SW480 ×enografts from vehicle- or periplocin-treated mice. Scale bar: 50 μm. (E) Acridine orange (AO, 5 μM) was used to label the lysosomes of cells treated with or without 0.50 μM periplocin for 24 h. Green fluorescence indicating the leakage of lysosomal contents was detected by flow cytometry. (F) Immunofluorescent analysis of CTSB in cells treated with or without 0.50 μM periplocin for 24 h. Scale bar: 10 μm. (G) Quantitation of the relative fluorescent intensity of Magic Red staining in cells treated with or without 0.50 μM periplocin for 24 h. (H-J) Representative images (H) and quantitative analysis (I and J) of LysoSensor Yellow/Blue DND-160 staining in cells treated with or without 0.50 μM periplocin for 24 h. Scale bar: 10 μm. (K and L) Representative images (K) and quantitative analysis (L) of LysoTracker Red DND-99 staining in cells treated with or without 0.50 μM periplocin for 24 h. Scale bar: 10 μm. (M and N), Representative images (M) and quantitative analysis (N) for immunofluorescent staining of LGALS3 in cells treated with or without 0.50 μM periplocin for 24 h. Scale bar: 10 μm. (O) Immunofluorescent analysis of the colocalization of LGALS3 with LAMP1 in cells treated with or without 0.50 μM periplocin for 24 h. Scale bar: 10 μm. Results are representative of three independent experiments. Data are presented as mean ± SD. *P < 0.05, **P < 0.01, ***P < 0.001.
Figure 3.
Figure 3.
Periplocin stimulates lysophagy in CRC cells. (A) Immunoblotting analysis of LC3B, ATG5, and BECN1 in cells treated with periplocin for 24 h at the indicated concentrations. (B and C) Representative images (B) and quantitative analysis (C) for immunofluorescent staining of endogenous LC3B puncta in cells treated with or without 0.50 μM periplocin for 24 h. (D) Immunoblotting analysis of PRKAA, p-PRKAA (Thr172), ACACA, p-ACACA (Ser79), MTOR, and p-MTOR (Ser2448) in cells treated with periplocin for 24 h at the indicated concentrations. (E and F) Reciprocal co-immunoprecipitation analysis of the interaction between endogenous LGALS3 and TRIM16 in cells treated with or without 0.50 μM periplocin for 24 h. (G) Co-immunoprecipitation analysis of the interaction between endogenous LGALS3 with PDCD6IP/Alix, CHMP4B, and TRIM16 in DLD-1 cells treated with 0.50 μM periplocin at different time periods. (H) Immunofluorescent analysis of the colocalization of LC3B with LGALS3 in CRC cells treated with or without 0.50 μM periplocin for 24 h. Scale bar: 10 μm. (I) Immunofluorescent analysis of the colocalization of LGALS3 with ubiquitin in CRC cells treated with or without 0.50 μM periplocin for 24 h. Scale bar: 10 μm. (J) Representative fluorescent images of CRC cells transiently expressing Mrfp-GFP-tandem fluorescent-tagged LGALS3 (tfGal3) followed by 0.50 μM periplocin treatment for 24 h. Scale bar: 10 μm. (K) Quantitative analysis of the GFP+ RFP+ or GFP RFP+ LGALS3 puncta in (J). (L) the relative decreased ratio of Magic Red intensity, relative increased ratio of LysoSensor Blue intensity, relative increased ratio of the interaction between LGALS3 and TRIM16, and relative increased ratio of LC3B-II protein level in DLD-1 cells following 0.50 μM periplocin treatment at different time periods. Results are representative of three independent experiments. Data are presented as mean ± SD. *P < 0.05, **P < 0.01, ***P < 0.001.
Figure 4.
Figure 4.
Periplocin-induced lysophagy potentiates lysosomal damage in CRC cells. (A and B) Immunoblotting analysis of LAMP1 in cells with ATG5 (A, shATG5#1) or ATG7 (B, shATG7#1 and shATG7#2) knockdown followed by 0.50 μM periplocin treatment for 24 h. (C) Immunofluorescent analysis of CTSB in cells with or without ATG5 knockdown (shATG5#1) followed by 0.50 μM periplocin treatment for 24 h. Scale bar: 10 μm. (D and E) Quantitation of the relative fluorescent intensity of Magic Red staining in cells with ATG5 (D) or ATG7 (E) knockdown followed by 0.50 μM periplocin treatment for 24 h. (F and G) Representative images (F) and quantitative analysis (G) for immunofluorescent staining of LGALS3 in cells with or without ATG5 knockdown (shATG5#1) followed by 0.50 μM periplocin treatment for 24 h. Scale bar: 10 μm. (H and I) Representative images (H) and quantitative analysis (I) for immunofluorescent staining of LGALS3 in cells with or without ATG7 knockdown followed by 0.50 μM periplocin treatment for 24 h. Scale bar: 10 μm. Results are representative of three independent experiments. Data are presented as mean ± SD. *P < 0.05, **P < 0.01, ***P < 0.001.
Figure 5.
Figure 5.
Periplocin-induced lysophagy potentiates the growth inhibition of CRC cells. (A and B) MTT assay of CRC cells treated with 0.50 μM periplocin for 24 h in combination with 5 mM 3-MA (A) or 200 nM wortmannin (B). (C and D) MTT (C) and colony formation (D) assay of cells treated with 0.50 μM periplocin for 24 h in combination with or without chloroquine (CQ, 10 μM). (E) Quantification of clone numbers in (D). (F) CRC cells were treated with 3-MA (5 mM) or CQ (10 μM) in the presence or absence of 0.50 μM periplocin for 24 h. Cell proliferation was measured by EdU incorporation. (G-J) Colony formation assay of cells with or without ATG5 knockdown (G, shATG5#1; I, shATG5#2) followed by 0.50 μM periplocin treatment for 24 h. Quantification of clone numbers was shown (H, shATG5#1; J, shATG5#2). (K) MTT assay of CRC cells with or without ATG7 knockdown followed by 0.50 μM periplocin treatment for 24 h. (L and M) Immunoblotting analysis of PARP1, cleaved PARP1, CASP3, and cleaved CASP3 in DLD-1 cells with ATG5 (L) or ATG7 (M) knockdown followed by 0.50 μM periplocin treatment for 24 h. Results are representative of three independent experiments. Data are presented as mean ± SD. *P < 0.05, **P < 0.01, ***P < 0.001.
Figure 6.
Figure 6.
Periplocin binds and prevents ubiquitin-mediated degradation of LGALS3 in CRC cells. (A) Immunoblotting analysis of LGALS3 in cells treated with periplocin for 24 h at the indicated concentrations. (B and C) Representative images (B) and quantitative analysis (C) of immunohistochemical staining for LGALS3 in SW480 ×enografts from vehicle- or periplocin-treated mice. Scale bar: 50 μm. (D) Immunoblotting analysis of LGALS3 in cells treated with 0.50 μM periplocin for 24 h in the presence or absence of cycloheximide (CHX, 50 μg/mL). (E) Quantitation of LGALS3 protein level in (D). (F) Immunoblotting analysis of LGALS3 in cells treated with 0.50 μM periplocin for 24 h in the presence or absence of MG132 (25 μM, 6 h). (G) Quantitation of LGALS3 protein level in (F). (H) FLAG-LGALS3 was co-expressed with HA-tagged ubiquitin (HA-UB) in HEK293T cells, followed by treatment with or without 0.50 μM periplocin for 24 h in the presence of MG132 (25 μM, 6 h). Immunoprecipitation was performed with FLAG beads, followed by immunoblotting with the indicated antibodies. (I) FLAG-LGALS3 WT, FLAG-LGALS3K196R, or FLAG-LGALS3K210R was co-expressed with HA-UB followed by MG132 treatment (25 μM, 6 h). Immunoprecipitation was performed with FLAG beads, followed by immunoblotting with the indicated antibodies. (J and K) Cellular thermal shift assay (CESTA) showing target engagement of LGALS3 by periplocin in CRC cells. (L and M) Drug affinity responsive target stability (DARTS) analysis of periplocin binding with LGALS3. (N and O) Electrostatic surface representation (N) and cartoon representation (O) for the docking model of periplocin binding to H. sapiens LGALS3 protein. Results are representative of three independent experiments. Data are presented as mean ± SD. *P < 0.05, **P < 0.01, ***P < 0.001. ns, non-significant.
Figure 7.
Figure 7.
Periplocin induces lethal lysophagy by upregulating LGALS3 in CRC cells. (A and B) Immunoblotting analysis of LC3B turnover in cells transfected with siNC or siLGALS3 followed by 0.50 μM periplocin treatment for 24 h. (C and D) Immunoblotting analysis of LC3B turnover in parental or lgals3 KO cells followed by 0.50 μM periplocin treatment for 24 h. (E and F) Representative images (E) and quantitative analysis (F) for immunofluorescent staining of endogenous LC3B puncta in cells transfected with siNC or siLGALS3 followed by 0.50 μM periplocin treatment for 24 h. Scale bar: 10 μm. (G and H) MTT assay of CRC cells with or without LGALS3 knockout (G, lgals3 KO#1; H, lgals3 KO#2) in response to 0.50 μM periplocin treatment for 24 h. (I) Colony formation assay of parental or lgals3 KO cells treated with or without 0.50 μM periplocin for 24 h. (J) Quantification of clone numbers in (I). (K and L) DLD-1 parental or lgals3 KO cells were subcutaneously inoculated into nude mice. Mice were injected with vehicle or periplocin (15 mg/kg/day) for two weeks. Image (K) and weight (L) of tumor xenografts were shown. Results in A-J are representative of three independent experiments. Data are presented as mean ± SD. *P < 0.05, **P < 0.01, ***P < 0.001. ns, non-significant.

References

    1. Bray F, Ferlay J, Soerjomataram I, et al. Global cancer statistics 2018: GLOBOCAN estimates of incidence and mortality worldwide for 36 cancers in 185 countries. CA Cancer J Clin. 2018. Nov;68(6):394–424. - PubMed
    1. Benson AB, Venook AP, Al-Hawary MM, et al. NCCN guidelines insights: colon cancer, version 2.2018. J Natl Compr Canc Netw. 2018. Apr;16(4):359–369. - PMC - PubMed
    1. Cao Y. Adipocyte and lipid metabolism in cancer drug resistance. J Clin Invest. 2019 Jul 2;129(8):3006–3017. doi: 10.1172/JCI127201 - DOI - PMC - PubMed
    1. Dekker E, Tanis PJ, Vleugels JLA, et al. Colorectal cancer. Lancet. 2019 Oct 19;394(10207):1467–1480. doi: 10.1016/S0140-6736(19)32319-0 - DOI - PubMed
    1. Klionsky DJ, Abdelmohsen K, Abe A, et al. Guidelines for the use and interpretation of assays for monitoring autophagy (3rd edition). Autophagy. 2016;12(1):1–222. doi: 10.1080/15548627.2015.1100356 - DOI - PMC - PubMed

Publication types

MeSH terms