. 2023 Aug 29;42(8):112822.
doi: 10.1016/j.celrep.2023.112822. Epub 2023 Jul 19.

Poly(GR) interacts with key stress granule factors promoting its assembly into cytoplasmic inclusions

Affiliations

Poly(GR) interacts with key stress granule factors promoting its assembly into cytoplasmic inclusions

Jinyoung Park et al. Cell Rep. .

Abstract

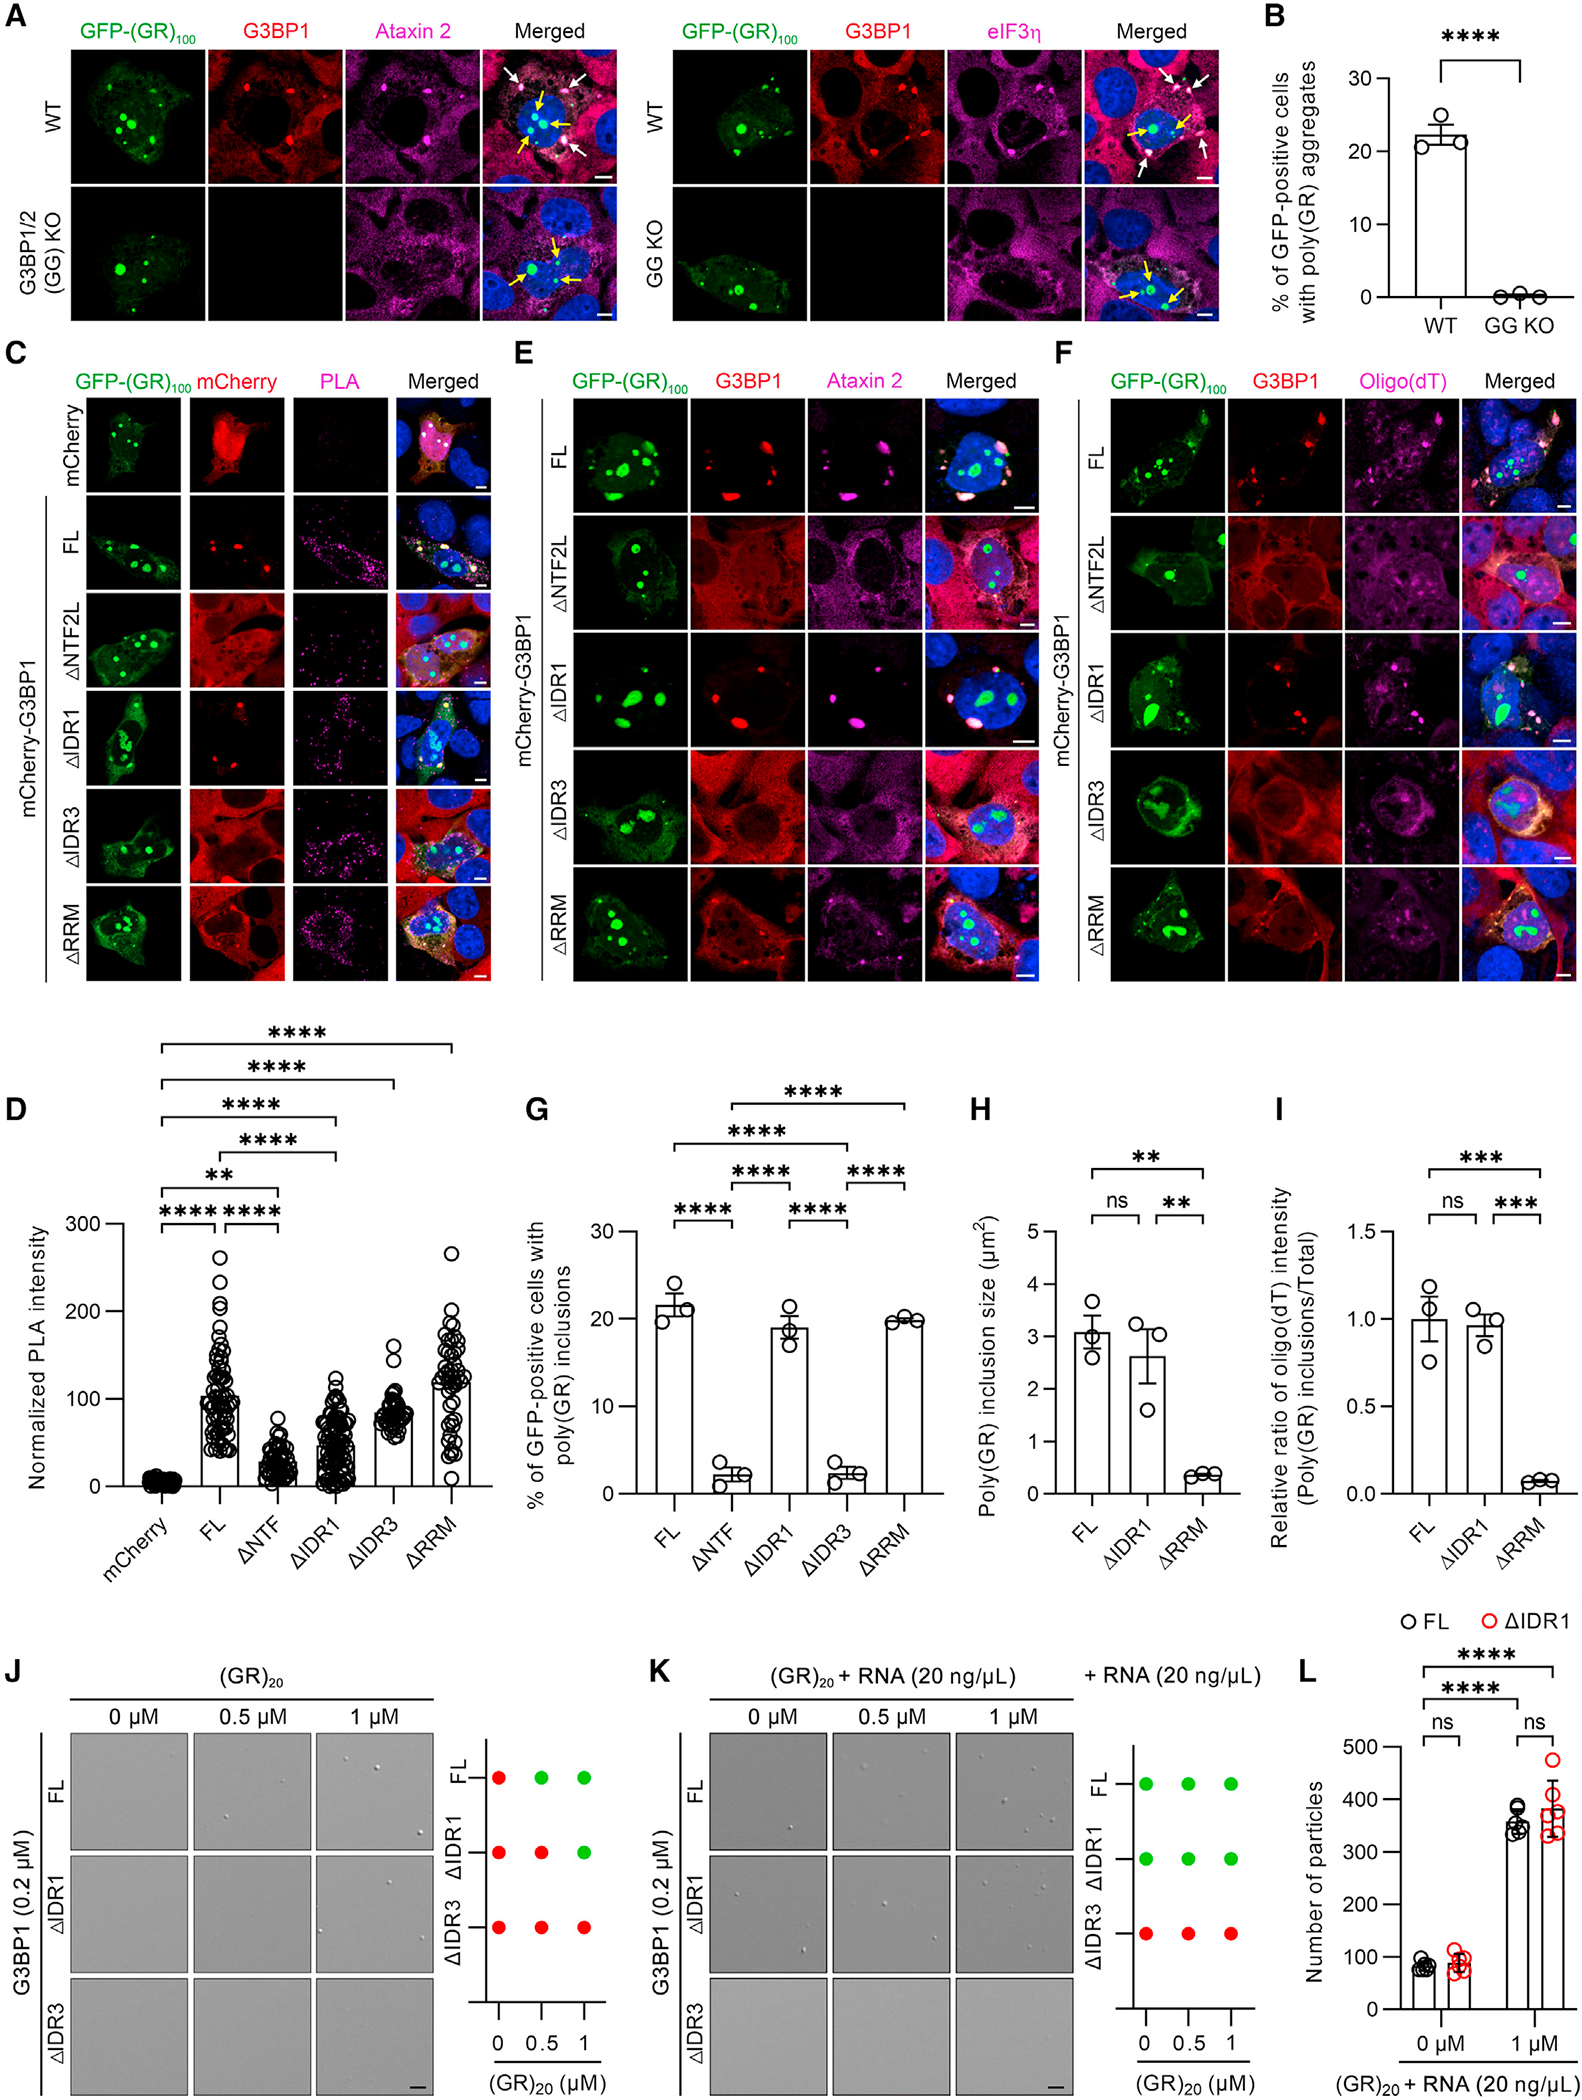
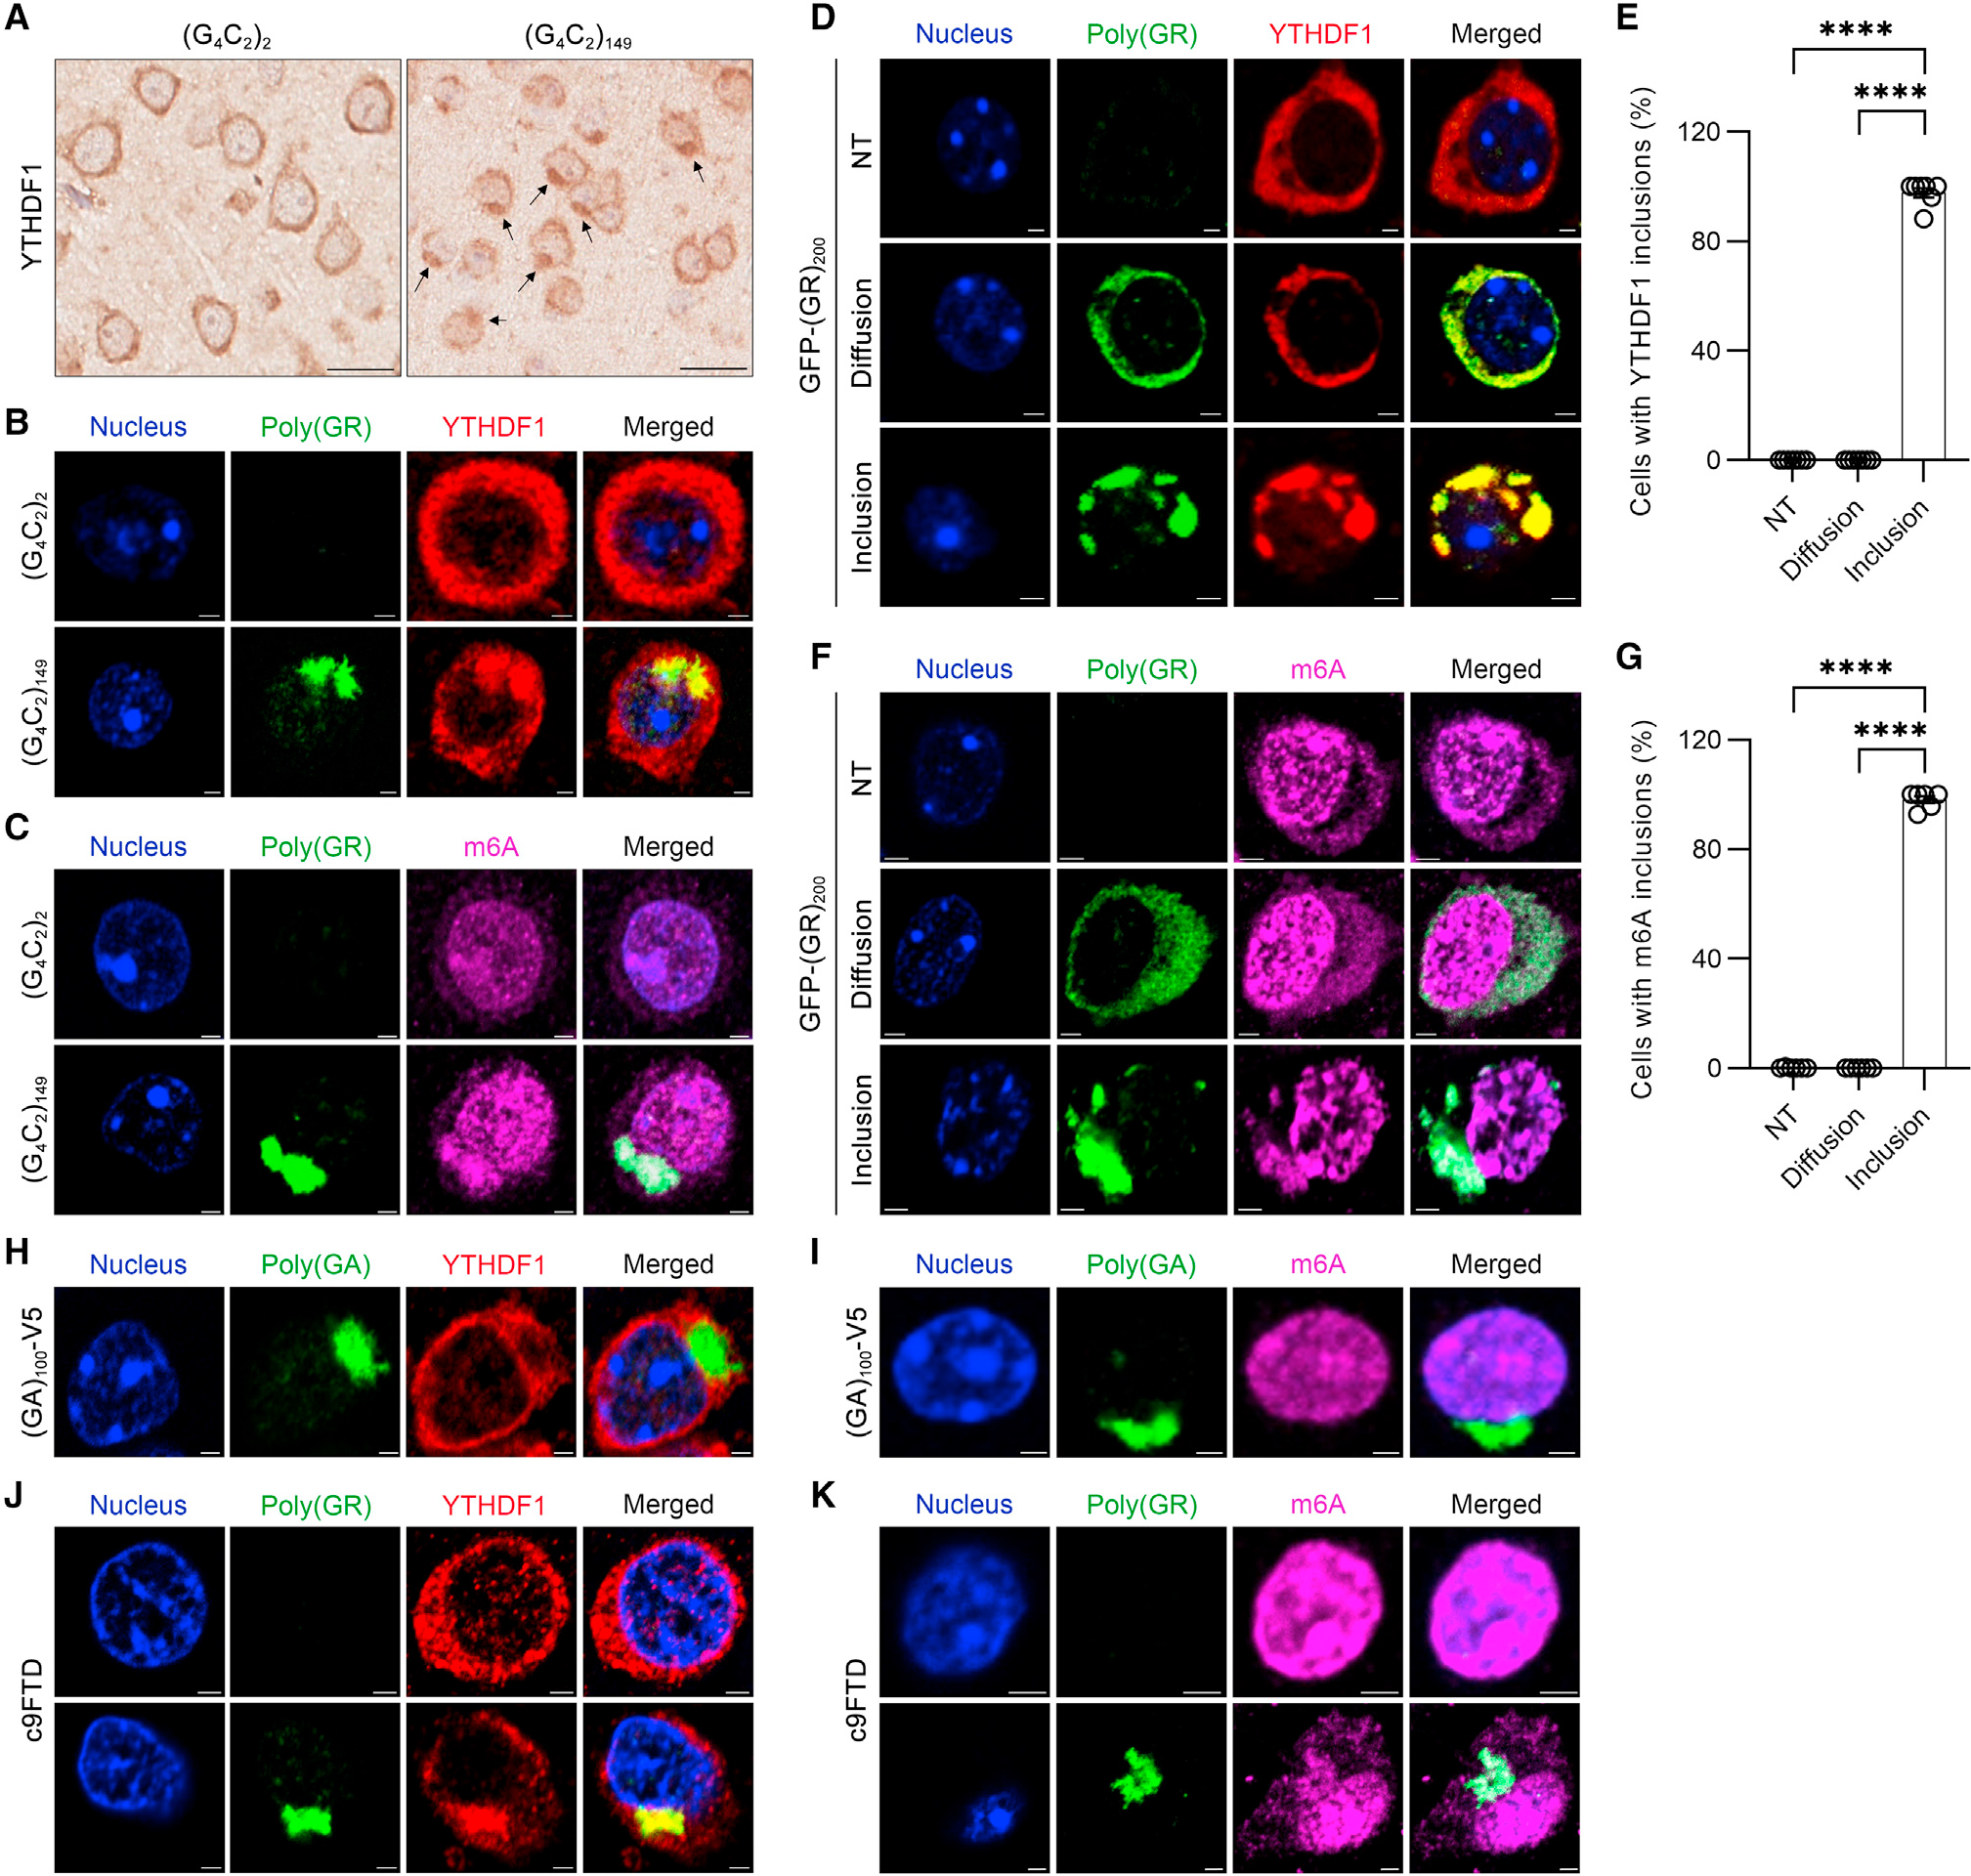
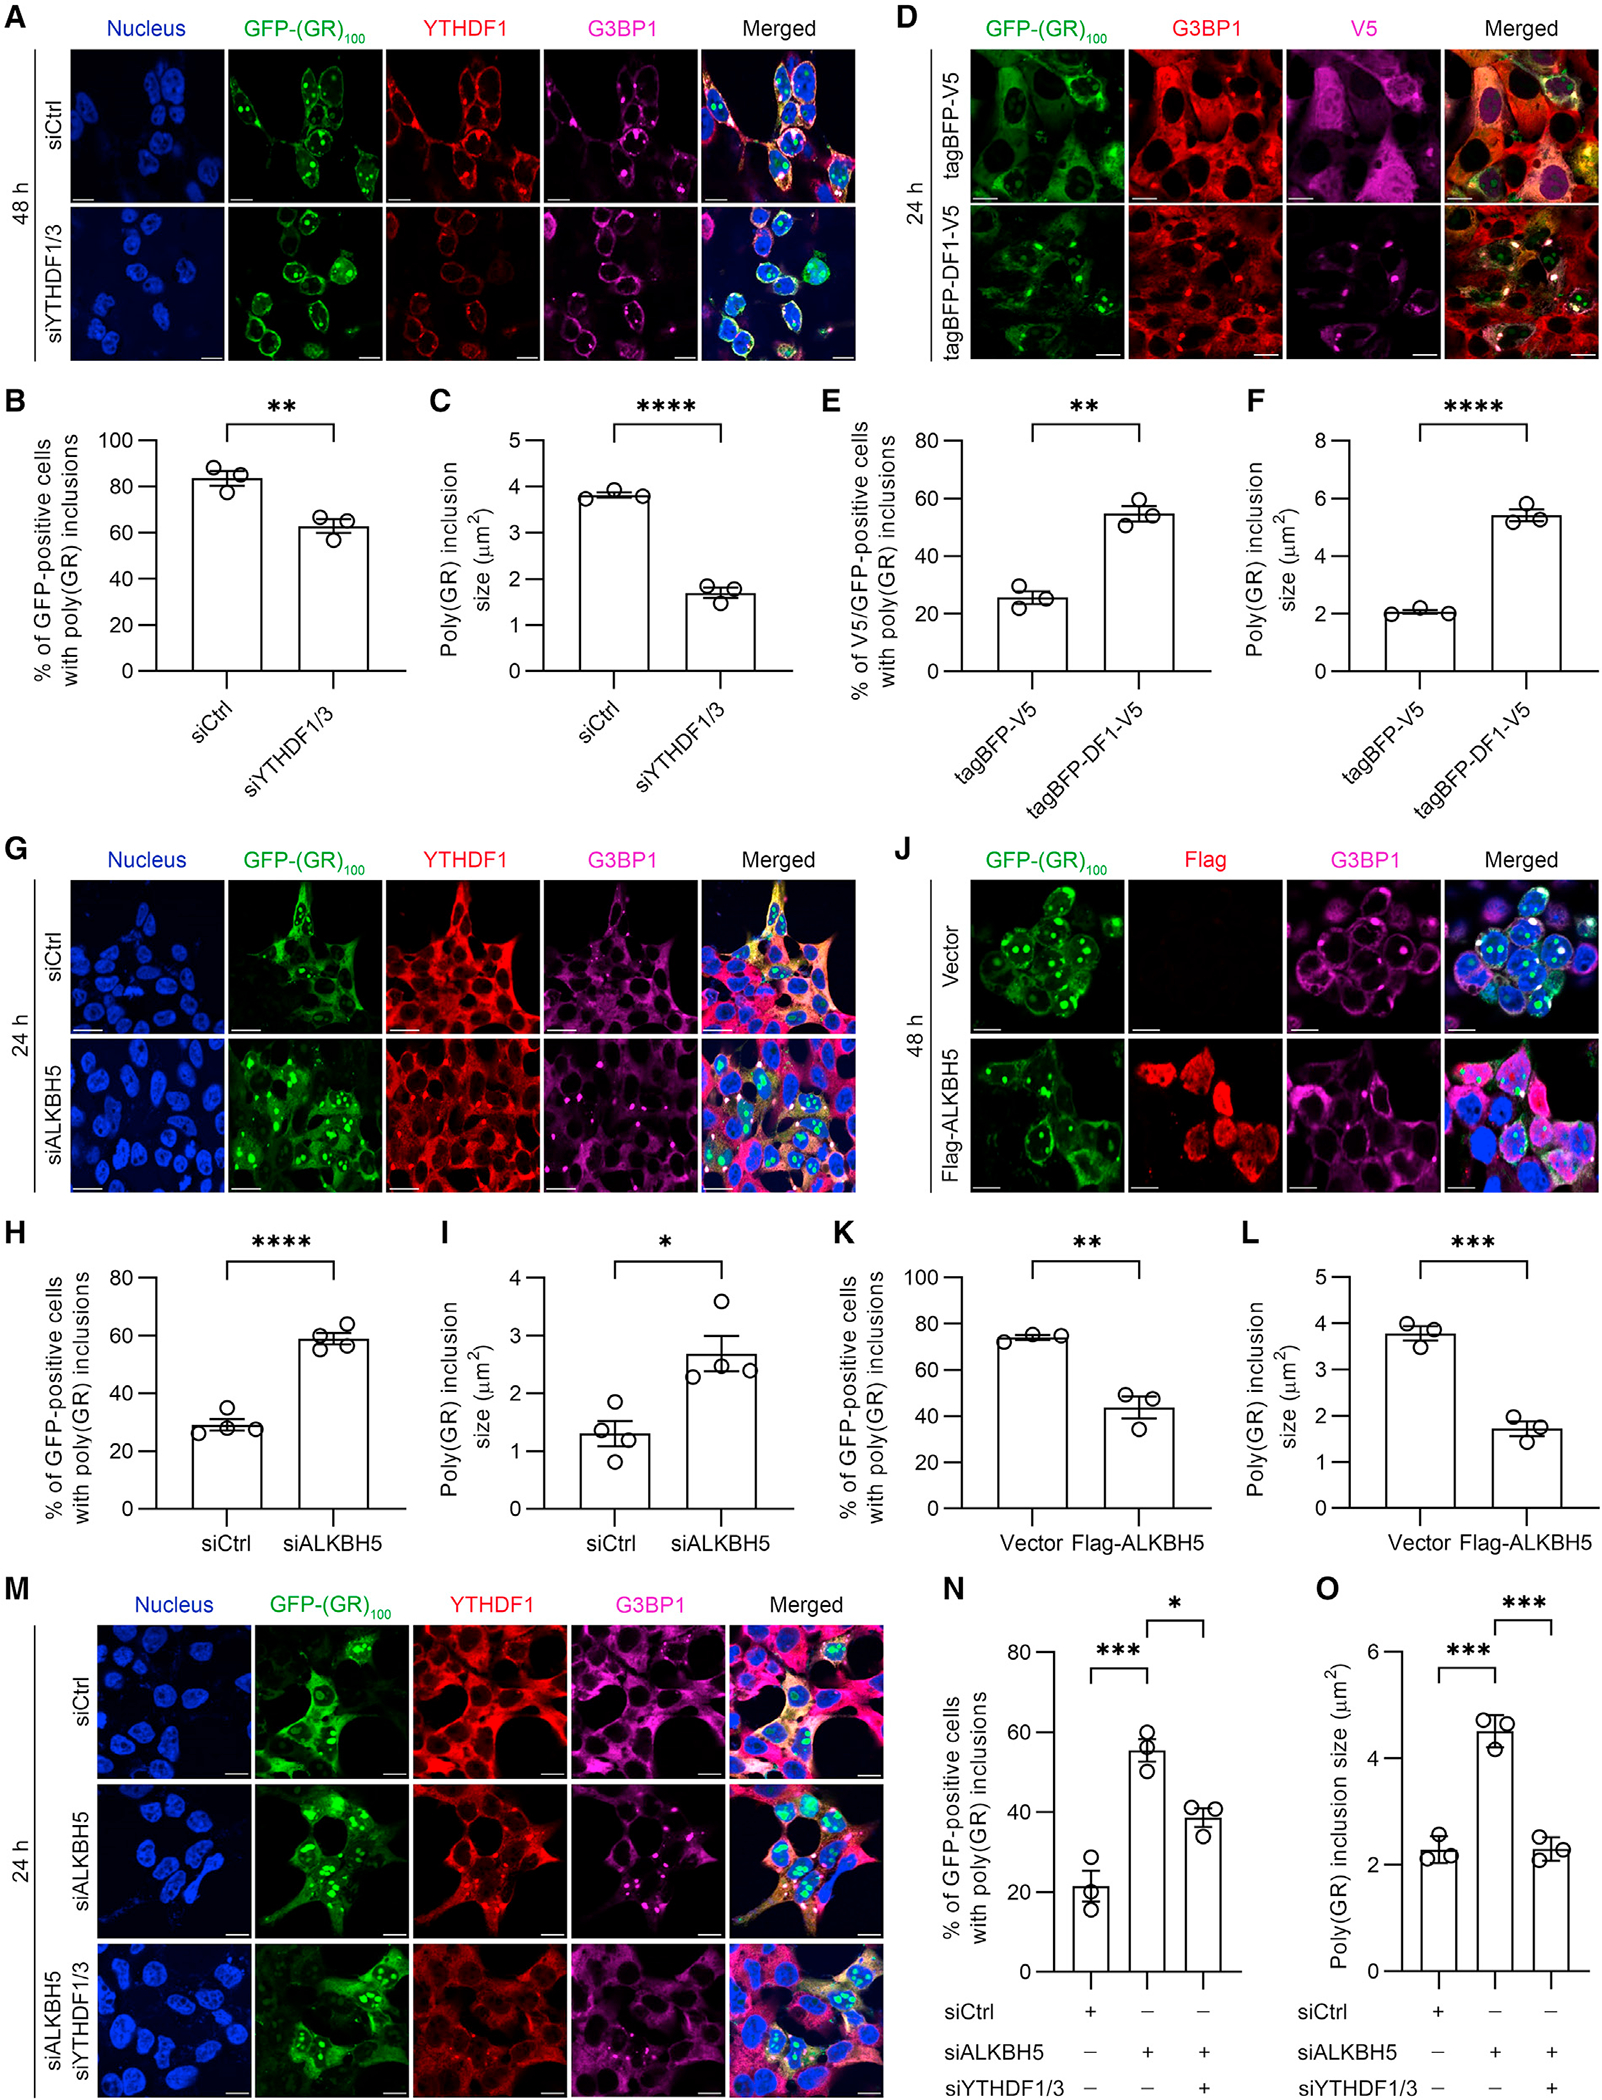
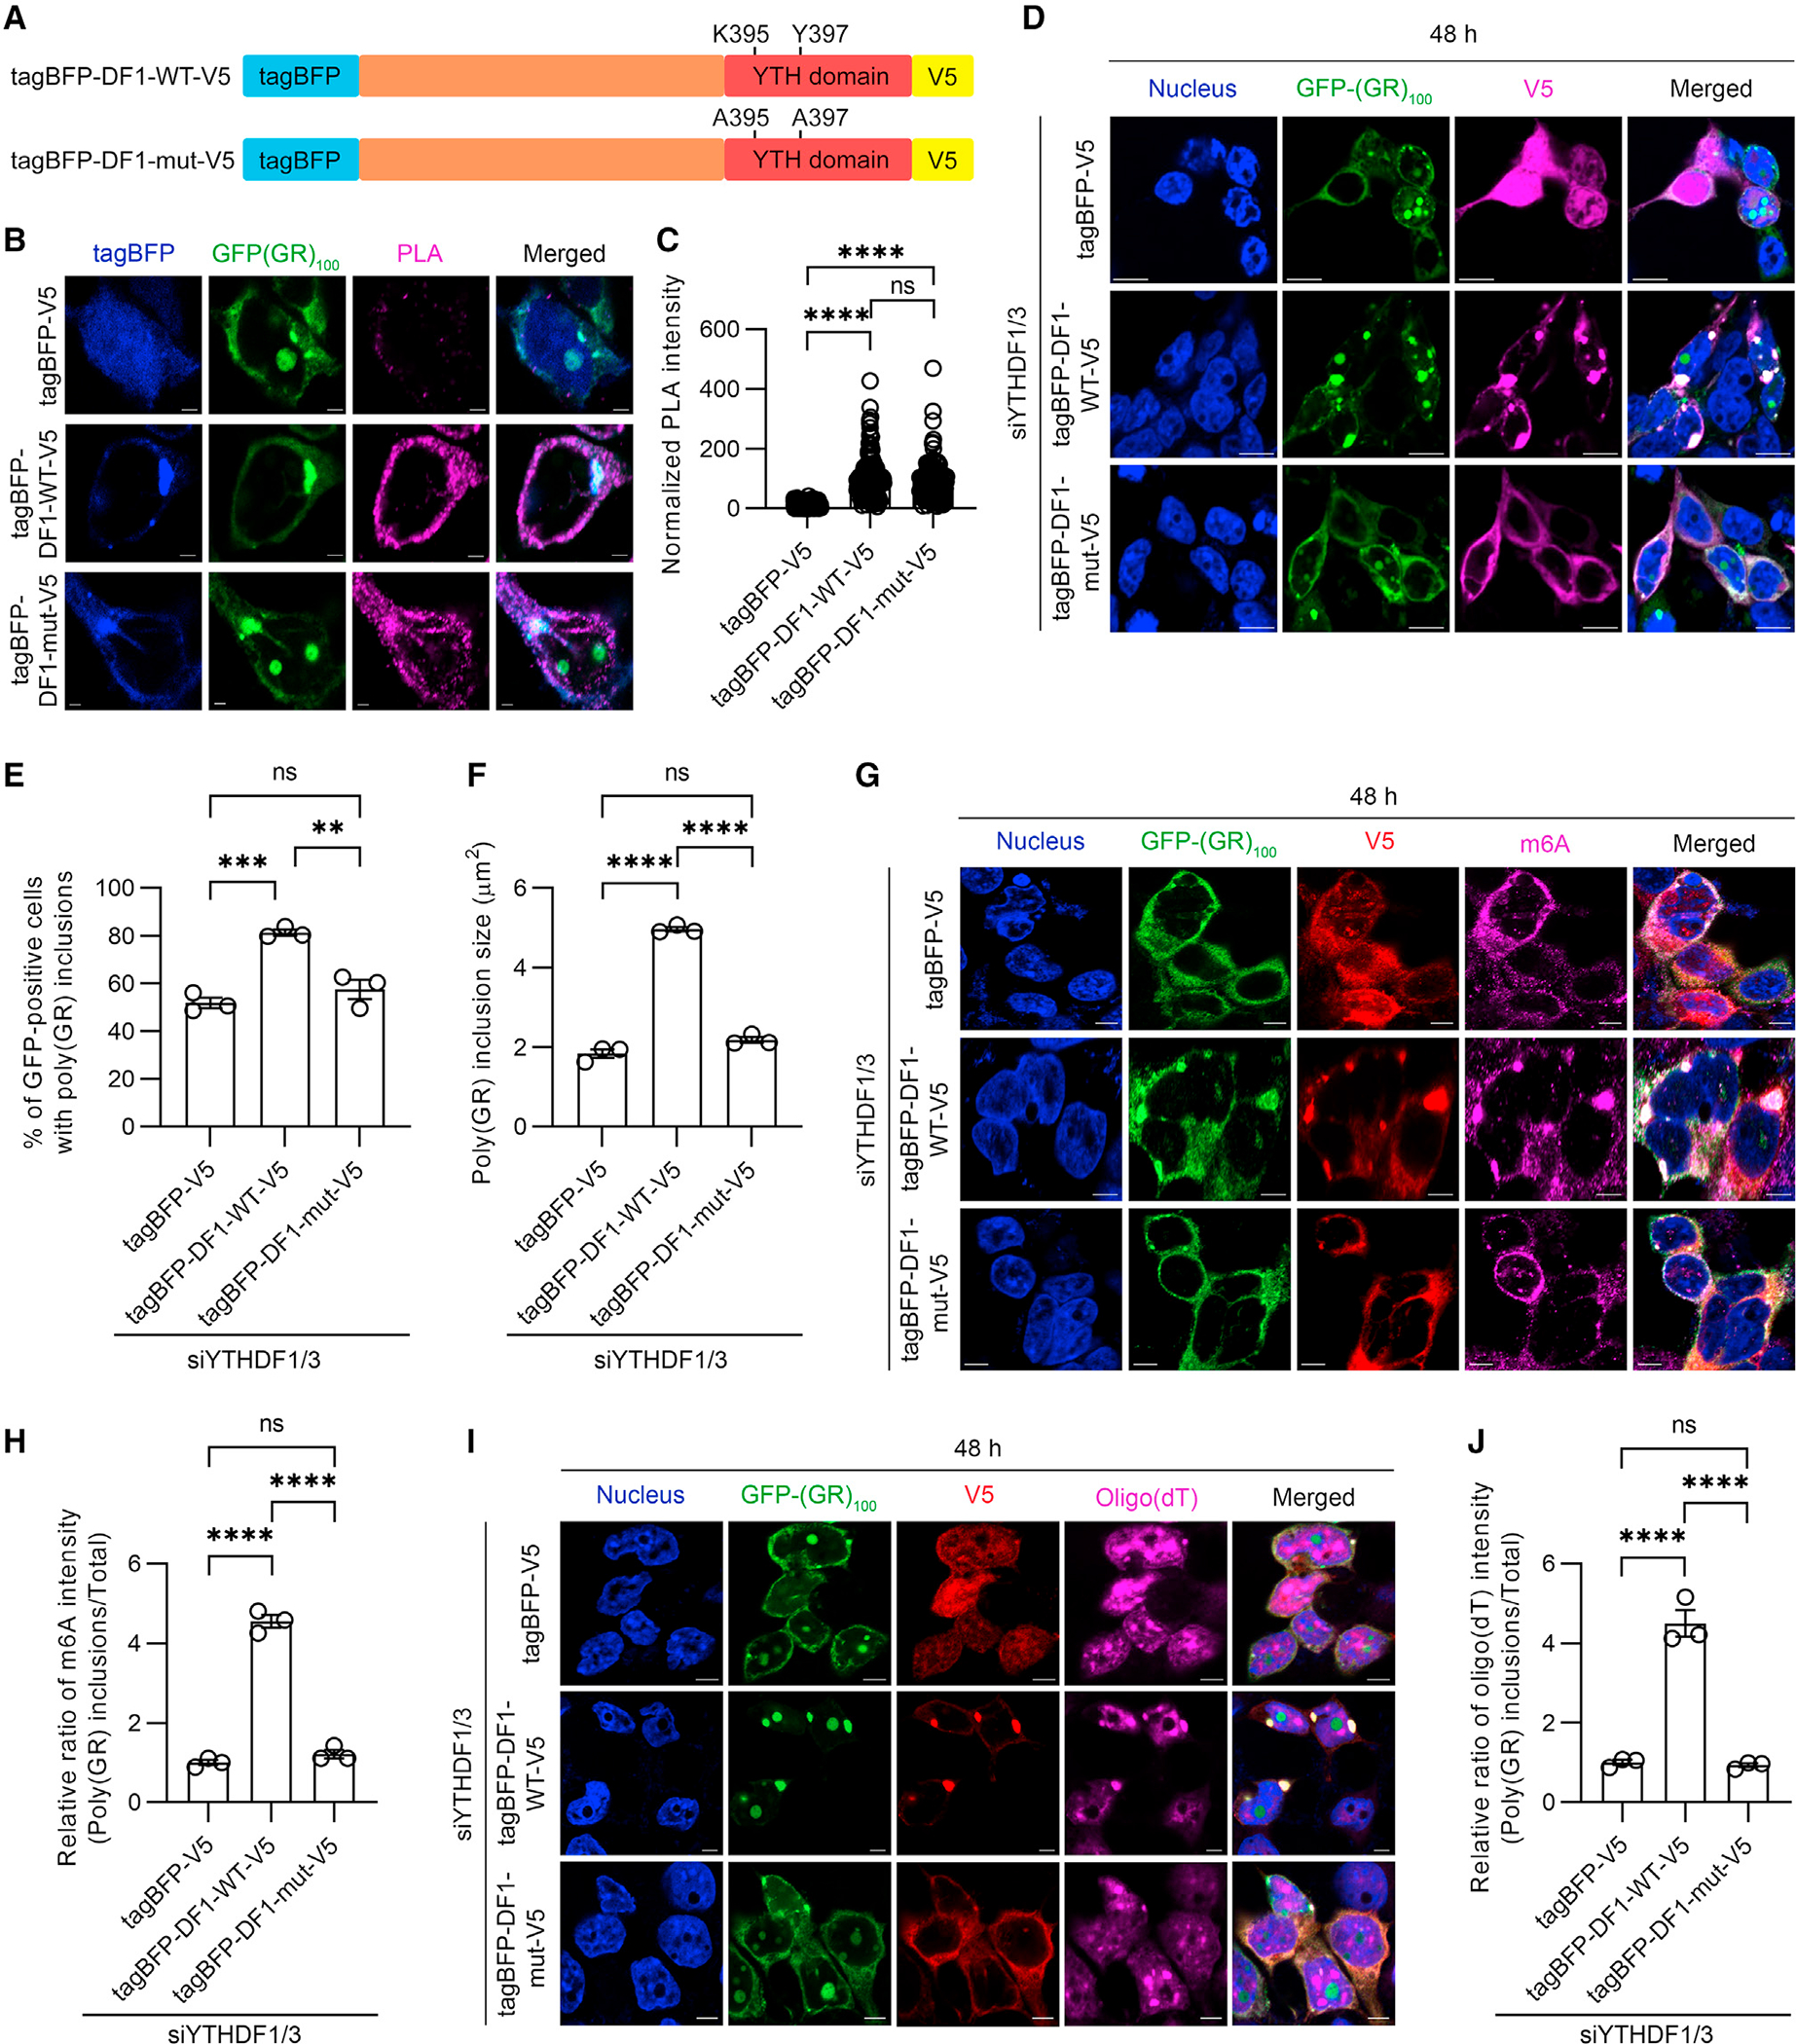
C9orf72 repeat expansions are the most common genetic cause of frontotemporal dementia (FTD) and amyotrophic lateral sclerosis (ALS). Poly(GR) proteins are toxic to neurons by forming cytoplasmic inclusions that sequester RNA-binding proteins including stress granule (SG) proteins. However, little is known of the factors governing poly(GR) inclusion formation. Here, we show that poly(GR) infiltrates a finely tuned network of protein-RNA interactions underpinning SG formation. It interacts with G3BP1, the key driver of SG assembly and a protein we found is critical for poly(GR) inclusion formation. Moreover, we discovered that N6-methyladenosine (m6A)-modified mRNAs and m6A-binding YTHDF proteins not only co-localize with poly(GR) inclusions in brains of c9FTD/ALS mouse models and patients with c9FTD, they promote poly(GR) inclusion formation via the incorporation of RNA into the inclusions. Our findings thus suggest that interrupting interactions between poly(GR) and G3BP1 or YTHDF1 proteins or decreasing poly(GR) altogether represent promising therapeutic strategies to combat c9FTD/ALS pathogenesis.

Keywords: CP: Molecular biology; CP: Neuroscience; G3BP1/2; YTHDF proteins; amyotrophic lateral sclerosis; chromosome 9 open reading frame 72; cytoplasmic poly(GR) inclusions; dipeptide repeat proteins; frontotemporal dementia; liquid-liquid phase separation; m6A-modified RNAs.


Conflict of interest statement

Declaration of interests The authors declare no competing interests.

Figures

Figure 1.
Figure 1.. Poly(GR) inclusion formation requires its interaction with G3BP1 and RNA recruitment
(A) Double-immunofluorescence staining for G3BP1 and either ataxin 2 or eIF3h in wild-type (WT) or G3BP1/2 knockout (GG KO) U2OS cells expressing GFP-(GR)100 48 h post transfection. White arrows indicate cytoplasmic poly(GR) inclusions, and yellow arrows indicate nucleolar poly(GR) accumulation. Scale bars, 5 μm. (B) Quantification of the percentage of cells containing poly(GR) inclusions in WT or GG KO U2OS cells expressing GFP-(GR)100 48 h post transfection (n = 3 independent experiments). (C) Representative proximity ligation assay (PLA) images for GFP-(GR)100 and mCherry in GG KO U2OS cells co-expressing GFP-(GR)100 and mCherry or for GFP-(GR)100 and mCherry-G3BP1 species in GG KO U2OS cells stably expressing mCherry-G3BP1 species. The PLA signal is indicative of these protein interactions. Scale bars, 5 μm. (D) Quantification of the intensity for PLA signal in GG KO U2OS cells co-expressing GFP-(GR)100 and mCherry or for GFP-(GR)100 and mCherry-G3BP1 species in GG KO U2OS cells stably expressing mCherry-G3BP1 species (n = 38–87 cells). (E) Double-immunofluorescence staining for G3BP1 and ataxin 2 in GG KO U2OS cells expressing GFP-(GR)100 and stably expressing mCherry-G3BP1 species. Scale bars, 5 μm. (F) Immunofluorescence staining for G3BP1 followed by RNA-FISH for oligo(dT) in GG KO U2OS cells expressing GFP-(GR)100 and stably expressing mCherry-G3BP1 species. Scale bars, 5 μm. (G) Quantification of the percentage of poly(GR)-positive cells containing poly(GR) inclusions in GG KO U2OS cells stably expressing mCherry-G3BP1 species (n = 3 independent experiments). (H) Quantification of the size of poly(GR) inclusions in GG KO U2OS cells stably expressing mCherry-G3BP1 species (n = 3 independent experiments). (I) Quantification of the relative ratio of oligo(dT) intensity (poly(GR) inclusions/total) in GG KO U2OS cells stably expressing mCherry-G3BP1 species (n = 3 independent experiments). (J) Representative images (left) and phase diagram (right) of 0.2 μM of the indicated recombinant G3BP1 protein species mixed with (GR)20 peptides (0–1 μM). Scale bars, 5 μm. (K) Representative images (left) and phase diagram (right) of 0.2 μM recombinant G3BP1 protein species mixed with (GR)20 peptides (0–1 μM) and total RNA (20 ng/μL). Scale bars, 5 μm. (L) Quantification of the numbers of droplets of the indicated recombinant G3BP1 protein species mixed with (GR)20 peptides (0, 1 μM) and total RNA (20 ng/μL) (n = 6 regions). Data represent the mean ± SEM. In (B), ****p < 0.0001, unpaired two-tailed t test. In (D), **p = 0.0032 and ****p < 0.0001, one-way ANOVA, Tukey’s post hoc analysis. In (G), ****p < 0.0001, one-way ANOVA, Tukey’s post hoc analysis. In (H), ns (not significant) p = 0.6381, ** (left to right) p = 0.0036 and p = 0.0089, one-way ANOVA, Tukey’s post hoc analysis. In (I), ns = 0.9485, *** (left to right) p = 0.0005 and p = 0.0006, one-way ANOVA, Tukey’s post hoc analysis. In (L), (left to right) ns = 0.9884 and ns = 0.5207, ****p < 0.0001, two-way ANOVA, Tukey’s post hoc analysis.
Figure 2.
Figure 2.. YTHDF1 and m6A-modified RNAs co-localize with cytoplasmic poly(GR) inclusions
(A) Representative images of immunohistochemical analysis of YTHDF1 in the cortex of 12-month-old (G4C2)2 or (G4C2)149 mice (n = 6 per group). Black arrows indicate inclusions. Scale bars, 20 μm. (B) Double-immunofluorescence staining for poly(GR) and YTHDF1 in the cortex of 12-month-old (G4C2)2 or (G4C2)149 mice (n = 6 per group). Scale bars, 2 μm. (C) Double-immunofluorescence staining for poly(GR) and m6A-modified RNAs in the cortex of 12-month-old (G4C2)2 or (G4C2)149 mice. Scale bars, 2 μm. (D) Double-immunofluorescence staining for poly(GR) and YTHDF1 in the cortex of 2-week-old GFP-(GR)200 mice. Scale bars, 2 μm. NT, non-transduced cells; Diffusion, cells with diffuse poly(GR); Inclusion, cells with poly(GR) inclusions. (E) Quantification of the percentage of NT cells and transduced cells with diffuse poly(GR) or poly(GR) inclusions with YTHDF1 inclusions (n = 6). (F) Double-immunofluorescence staining for poly(GR) and m6A-modified RNAs in the cortex of 2-week-old GFP-(GR)200 mice. Scale bars, 2 μm. (G) Quantification of the percentage of NT cells or transduced cells with diffuse poly(GR) or poly(GR) inclusion with m6A-modified RNA-containing inclusions (n = 6). (H) Double-immunofluorescence staining for poly(GA) and YTHDF1 in the cortex of 3.5-month-old (GA)100-V5 mice (n = 3). Scale bars, 2 μm. (I) Double-immunofluorescence staining for poly(GA) and m6A-modified RNAs in the cortex of 3.5-month-old (GA)100-V5 mice (n = 3). Scale bars, 2 μm. (J) Double-immunofluorescence staining for poly(GR) and YTHDF1 in the mid-frontal cortex of patients with c9FTD. The intracellular localization of YTHDF1 is shown for cells without or with poly(GR) inclusions (n = 6). Scale bars, 2 μm. (K) Double-immunofluorescence staining for poly(GR) and m6A-modified RNAs in the mid-frontal cortex of patients with c9FTD. The intracellular localization of m6A-modified RNA is shown for cells without and with poly(GR) inclusions (n = 6). Scale bars, 2 μm. Data are shown as the mean ± SEM. In (E), ****p < 0.0001, one-way ANOVA, Tukey’s post hoc analysis. In (G), ****p < 0.0001, one-way ANOVA, Tukey’s post hoc analysis.
Figure 3.
Figure 3.. YTHDF proteins and m6A-modified RNAs promote cytoplasmic poly(GR) inclusion formation
(A) Double-immunofluorescence staining for YTHDF1 and G3BP1 in YTHDF1/3-depleted HEK293T cells expressing GFP-(GR)100 48 h post transfection. Scale bars, 10 μm. (B) Quantification of the percentage of GFP-positive cells containing poly(GR) inclusions in YTHDF1/3-depleted HEK293T cells expressing GFP-(GR)100 (n = 3 independent experiments). (C) Quantification of the size of poly(GR) inclusions in YTHDF1/3-depleted HEK293T cells expressing GFP-(GR)100 (n = 3 independent experiments). (D) Double-immunofluorescence staining for V5 and G3BP1 in HEK293T cells co-expressing GFP-(GR)100 and either tagBFP-V5 or tagBFP/V5 tagged wild-type YTHDF1 (tagBFP-DF1-V5). Scale bars, 10 μm. (E) Quantification of the percentage of GFP-positive cells containing poly(GR) inclusions in HEK293T cells co-expressing GFP-(GR)100 and either tagBFP-V5 or tagBFP-DF1-V5 (n = 3 independent experiments). (F) Quantification of the size of poly(GR) inclusions in GFP-(GR)100 overexpressing HEK293T cells co-expressing either tagBFP-V5 or tagBFP-DF1-V5 (n = 3 independent experiments). (G) Double-immunofluorescence staining for YTHDF1 and G3BP1 in ALKBH5-depleted HEK293T cells expressing GFP-(GR)100. Staining was performed 24 h after GFP-(GR)100 transfection. Scale bars, 20 μm. (H) Quantification of the percentage of GFP-positive cells containing poly(GR) inclusions in ALKBH5-depleted HEK293T cells expressing GFP-(GR)100 (n = 4 independent experiments). (I) Quantification of the size of poly(GR) inclusions in ALKBH5-depleted HEK293T cells expressing GFP-(GR)100 (n = 4 independent experiments). (J) Double-immunofluorescence staining for Flag and G3BP1 in Flag-ALKBH5 overexpressing HEK293T cells co-expressing GFP-(GR)100. Scale bars, 20 μm. (K) Quantification of the percentage of GFP-positive cells with poly(GR) inclusions in Flag-ALKBH5 overexpressing HEK293T cells co-expressing GFP-(GR)100 (n = 3 independent experiments). (L) Quantification of the size of poly(GR) inclusions in Flag-ALKBH5 and GFP-(GR)100 co-expressing HEK293T cells (n = 3 independent experiments). (M) Double-immunofluorescence staining for YTHDF1 and G3BP1 in HEK293T cells expressing GFP-(GR)100 in which only ALKBH5 was depleted or in which ALKBH5 and YTHDF1/3 were depleted. Scale bars, 20 μm. (N) Quantification of the percentage of GFP-positive cells containing poly(GR) inclusions in HEK293T cells expressing GFP-(GR)100 in which only ALKBH5 was depleted or in which ALKBH5 and YTHDF1/3 were depleted (n = 3 independent experiments). (O) Quantification of the size of poly(GR) inclusions in ALKBH5-depleted or ALKBH5 and YTHDF1/3-depleted HEK293T cells expressing GFP-(GR)100 (n = 3 independent experiments). Data are shown as mean ± SEM. In (B), **p = 0.0095, unpaired two-tailed t test. In (C), ****p < 0.0001, unpaired two-tailed t test. In (E), **p = 0.0011, unpaired two-tailed t test. In (F), ****p < 0.0001, unpaired two-tailed t test. In (H), ****p < 0.0001, unpaired two-tailed t test. In (I), *p = 0.0101, unpaired two-tailed t test. In (K), **p = 0.0033, unpaired two-tailed t test. In (L), ***p = 0.0007, unpaired two-tailed t test. In (N), ***p = 0.0006 and *p = 0.0193, one-way ANOVA, Tukey’s post hoc analysis. In (O), *** (left to right) p = 0.0001 and p = 0.0001, one-way ANOVA, Tukey’s post hoc analysis.
Figure 4.
Figure 4.. YTHDF proteins incorporate mRNA into poly(GR) inclusions via m6A-modified RNA binding
(A) Schematic of the tagBFP/V5 tagged YTHDF1 wild-type (tagBFP-DF1-WT-V5) and mutant (tagBFP-DF1-mut-V5) constructs, the latter having mutations in the YTH domain that impair the ability of YTHDF1 to bind m6A-modified RNA (top). (B) Representative images of proximity ligation assay (PLA) for GFP-(GR)100 and tagBFP or tagBFP-YTHDF1 species in HEK293T cells co-expressing GFP-(GR)100 and tagBFP or tagBFP-YTHDF1 species. Scale bars, 2 μm. (C) Quantification of the intensity for PLA signal in HEK293T cells co-expressing GFP-(GR)100 and tagBFP or tagBFP-YTHDF1 species (n = 152–176 cells). (D) Immunofluorescence staining for V5 in YTHDF1/3-depleted HEK293T cells expressing GFP-(GR)100 and either tagBFP-V5, tagBFP-DF1-WT-V5 or tagBFP-DF1-mut-V5. Scale bars, 10 μm. (E) Quantification of the percentage of cells with poly(GR) inclusions in YTHDF1/3-depleted HEK293T cells expressing GFP-(GR)100 and either tagBFP-V5, tagBFP-DF1-WT-V5, or tagBFP-DF1-mut-V5 (n = 3 independent experiments). (F) Quantification of the size of poly(GR) inclusions in YTHDF1/3-depleted HEK293T cells expressing GFP-(GR)100 and either tagBFP-V5, tagBFP-DF1-WT-V5, or tagBFP-DF1-mut-V5 (n = 3 independent experiments). (G) Triple-immunofluorescence staining for GFP, V5, and m6A in YTHDF1/3-depleted HEK293T cells expressing GFP-(GR)100 and either tagBFP-V5, tagBFP-DF1-WT-V5, or tagBFP-DF1-mut-V5. Scale bars, 5 μm. (H) Quantification of the relative ratio of m6A intensity (poly(GR) inclusions/total) from YTHDF1/3-depleted HEK293T cells expressing GFP-(GR)100 and either tagBFP-V5, tagBFP-DF1-WT-V5, or tagBFP-DF1-mut-V5 (n = 3 independent experiments). (I) Immunofluorescence staining for V5 followed by RNA-FISH for oligo(dT) in YTHDF1/3-depleted HEK293T cells expressing GFP-(GR)100 and tagBFP-V5, tagBFP-DF1-WT-V5, or tagBFP-DF1-mut-V5. Scale bars, 5 μm. (J) Quantification of the relative ratio of oligo(dT) intensity (poly(GR) inclusions/total) from YTHDF1/3-depleted HEK293T cells expressing GFP-(GR)100 and either tagBFP-V5, tagBFP-DF1-WT-V5, or tagBFP-DF1-mut-V5 (n = 3 independent experiments). Data are shown as mean ± SEM. In (C), ****p < 0.0001 and ns p = 0.0547, one-way ANOVA, Tukey’s post hoc analysis. In (E), ***p = 0.0007, **p = 0.0022, and ns (not significant) p = 0.3670, one-way ANOVA, Tukey’s post hoc analysis. In (F), ****p < 0.0001 and ns p = 0.0576, one-way ANOVA, Tukey’s post hoc analysis. In (H), ****p < 0.0001 and ns p = 0.4376, one-way ANOVA, Tukey’s post hoc analysis. In (J), ****p < 0.0001 and ns p = 0.9690, one-way ANOVA, Tukey’s post hoc analysis.

References

    1. Kwon I, Xiang S, Kato M, Wu L, Theodoropoulos P, Wang T, Kim J, Yun J, Xie Y, and McKnight SL (2014). Poly-dipeptides encoded by the C9orf72 repeats bind nucleoli, impede RNA biogenesis, and kill cells. Science 345, 1139–1145. 10.1126/science.1254917. - DOI - PMC - PubMed
    1. Mizielinska S, Grönke S, Niccoli T, Ridler CE, Clayton EL, Devoy A, Moens T, Norona FE, Woollacott IOC, Pietrzyk J, et al. (2014). C9orf72 repeat expansions cause neurodegeneration in Drosophila through arginine-rich proteins. Science 345, 1192–1194. 10.1126/science.1256800. - DOI - PMC - PubMed
    1. Wen X, Tan W, Westergard T, Krishnamurthy K, Markandaiah SS, Shi Y, Lin S, Shneider NA, Monaghan J, Pandey UB, et al. (2014). Antisense proline-arginine RAN dipeptides linked to C9ORF72-ALS/FTD form toxic nuclear aggregates that initiate in vitro and in vivo neuronal death. Neuron 84, 1213–1225. 10.1016/j.neuron.2014.12.010. - DOI - PMC - PubMed
    1. Zhang YJ, Gendron TF, Ebbert MTW, O’Raw AD, Yue M, Jansen-West K, Zhang X, Prudencio M, Chew J, Cook CN, et al. (2018). Poly(GR) impairs protein translation and stress granule dynamics in C9orf72-associated frontotemporal dementia and amyotrophic lateral sclerosis. Nat. Med. 24, 1136–1142. 10.1038/s41591-018-0071-1. - DOI - PMC - PubMed
    1. Zhang YJ, Guo L, Gonzales PK, Gendron TF, Wu Y, Jansen-West K, O’Raw AD, Pickles SR, Prudencio M, Carlomagno Y, et al. (2019). Heterochromatin anomalies and double-stranded RNA accumulation underlie C9orf72 poly(PR) toxicity. Science 363, eaav2606. 10.1126/science.aav2606. - DOI - PMC - PubMed

Publication types

MeSH terms