. 2023 Aug 29;42(8):112827.
doi: 10.1016/j.celrep.2023.112827. Epub 2023 Jul 19.

Structural definition of HLA class II-presented SARS-CoV-2 epitopes reveals a mechanism to escape pre-existing CD4+ T cell immunity

Affiliations

Structural definition of HLA class II-presented SARS-CoV-2 epitopes reveals a mechanism to escape pre-existing CD4+ T cell immunity

Yuan Chen et al. Cell Rep. .

Abstract

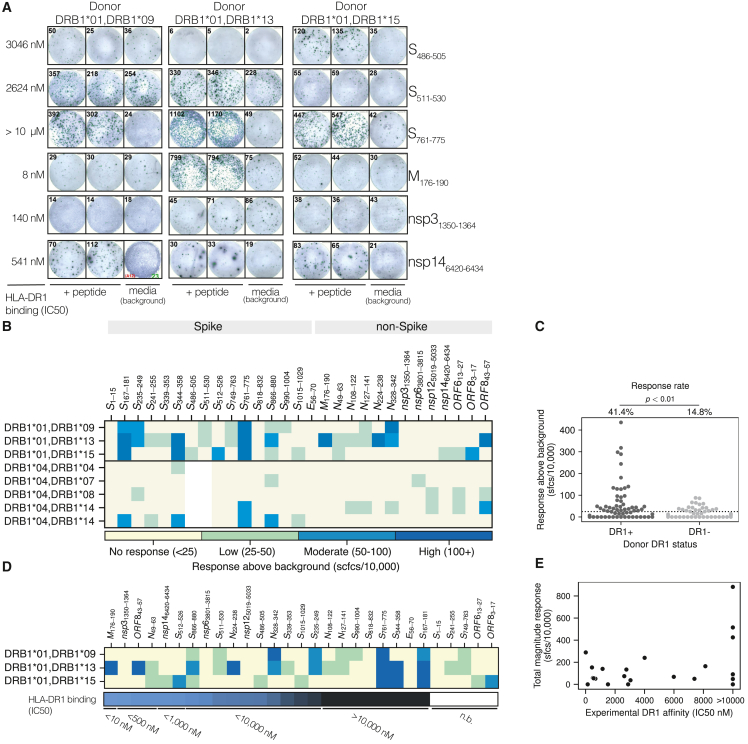
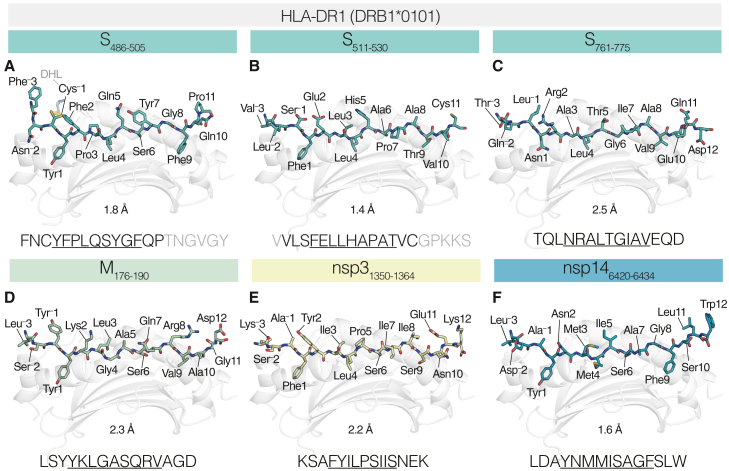
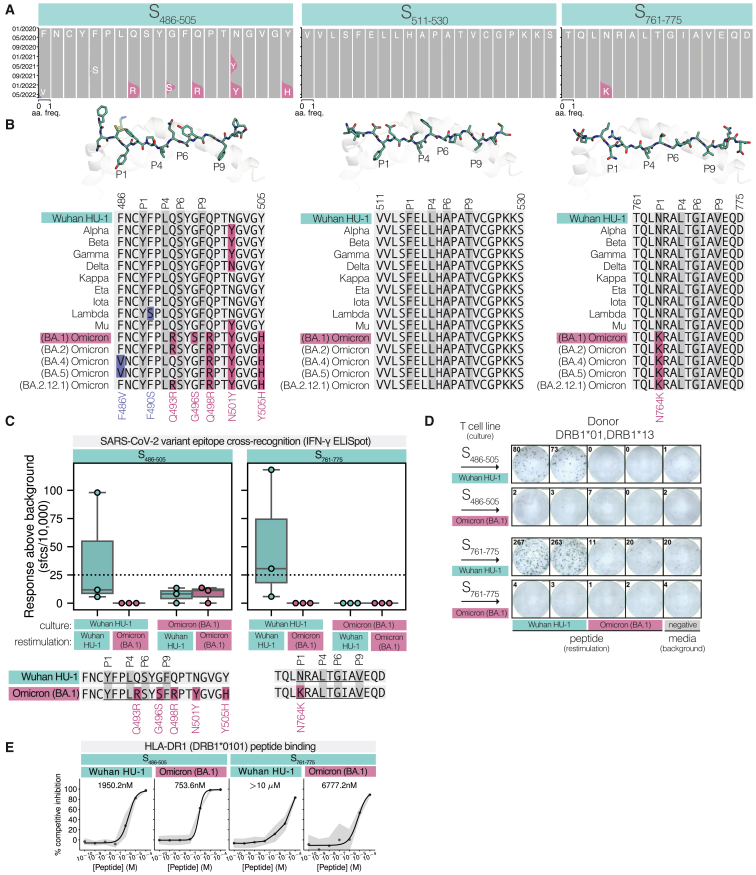
CD4+ T cells recognize a broad range of peptide epitopes of severe acute respiratory syndrome coronavirus 2 (SARS-CoV-2), which contribute to immune memory and limit COVID-19 disease. We demonstrate that the immunogenicity of SARS-CoV-2 peptides, in the context of the model allotype HLA-DR1, does not correlate with their binding affinity to the HLA heterodimer. Analyzing six epitopes, some with very low binding affinity, we solve X-ray crystallographic structures of each bound to HLA-DR1. Further structural definitions reveal the precise molecular impact of viral variant mutations on epitope presentation. Omicron escaped ancestral SARS-CoV-2 immunity to two epitopes through two distinct mechanisms: (1) mutations to TCR-facing epitope positions and (2) a mechanism whereby a single amino acid substitution caused a register shift within the HLA binding groove, completely altering the peptide-HLA structure. This HLA-II-specific paradigm of immune escape highlights how CD4+ T cell memory is finely poised at the level of peptide-HLA-II presentation.

Keywords: CD4(+) T cells; COVID-19; CP: Immunology; HLA class II; SARS-CoV-2; T cells; antigen presentation; coronavirus; crystallography; immune escape; immune memory.


Conflict of interest statement

Declaration of interests The authors declare no competing interests.

Figures

None
Graphical abstract
Figure 1
Figure 1
Identification of HLA-DR1 binding peptides derived from SARS-CoV-2 (A) A schematic overview of the SARS-CoV-2 genome highlighting peptides selected for analysis. An expanded view of Spike and the non-structural proteins produced from orf1ab (nsp1 to nsp16) is shown. S, Spike; E, Envelope; M, Membrane; N, Nucleocapsid; orf, open reading frame; nsp, non-structural protein; and UTR, untranslated region. Within Spike: SP, signal peptide; NTD, N-terminal domain; RBD, receptor binding domain; CTD, C-terminal domain; FP, fusion peptide; and TM, transmembrane domain. (B) Peptide-HLA-DR1 binding curves for each peptide as determined by competitive inhibition assay. HA305–319 was used as a comparative control. Data representative of n = 3 independent experiments, each with n = 3 technical replicates. Data presented as mean percentage inhibition (circles) with standard deviation (shaded area) shown as error from n = 3 technical replicates. An IC50 value defining peptide-HLA-DR1 binding affinity (inset) is shown where fitting resulted in values of <10 μM (curve fit, black line). Peptides with poor curve fit and weak binding (>10 μM) or no binding (n.b.) have mean values that are connected via straight lines.
Figure 2
Figure 2
Immunogenicity of selected SARS-CoV-2 peptides in HLA-DR1+ and HLA-DR4+ donors (A) Peptide-specific, 12-day-expanded T cell responses to SARS-CoV-2 peptides. Example test peptide (n = 2) and background (media) control IFN-γ ELISpot assays for the HLA-DR1+ donors (n = 3) are shown. Examples shown are of peptides selected for later structural analyses. (B) Heatmap summary of IFN-γ ELISpot data. Donors are grouped by HLA-DR1+ (n = 3) and HLA-DR4+ (n = 5). Each peptide was tested twice (n = 2) in each donor. ELISpot assays were performed in duplicate (n = 2). The maximal response from either time point is shown, with individual time points shown in Figures S1A and S1B. Responses were background subtracted (medium only), normalized to sfcs/10,000 cells, and binned into low, moderate, and high responders (cutoffs and colors indicated at bottom). S486–505 and S511–530 were assayed in HLA-DR1+ donors (n = 3) only and post-vaccination only. (C) Summary of maximal response of all peptides (n = 29) in all donors tested (n = 8), divided into donor DR1 status. Each marker represents a single donor maximal response to a single peptide (n = 2 ELISpot wells). Dashed line at 25 sfcs/10,000 cells was used as a cutoff for donor-peptide response. Response rate is shown as a percentage. Inset p value calculated via Fisher's exact test comparing DR1+/DR4+ status (groups) and the positive responses to peptides (outcomes). (D) Heatmap summary of IFN-γ ELISpot data presented in (B) but ordered by HLA-DR1 binding affinity (IC50) as determined in Figure 1B: strongest affinity (left) to weakest (right). HLA-DR1+ donor data only are shown. (E) Scatterplot summary of total magnitude response to each peptide (summated maximal response by each donor for each peptide) in HLA-DR1+ donors (n = 3) against HLA-DR1 binding affinity (IC50) as determined in Figure 1B. No correlation was observed.
Figure 3
Figure 3
Structural definition of SARS-CoV-2-derived HLA-DR1 epitopes Structural overview of HLA-DR1-S486–505 (A), -S511–530 (B), -S761–775 (C), -M176–190 (D), -nsp31350–1364 (E), and -nsp146420–6434 (F). In each, the HLA-DR1 peptide binding groove (light gray, cartoon representation) and bound peptide cargo are shown. Each peptide is shown as sticks and colored by atom (C matches the color of the viral protein origin shown at the top; N, blue; O, red; S, yellow). Residues within the peptides are numbered according to their register position, i.e., Tyr1 is in the P1 position, and Phe3 is in the P3 position. Inset peptide amino acid sequences are shown below each, with modeled residues (black) and unmodeled residues (gray) indicated, and the core nonamer binding register is underlined. Resolution is indicated below each.
Figure 4
Figure 4
Impact of SARS-CoV-2 variants on epitope HLA-DR1 binding and immunogenicity (A) Cumulative genotypic frequency plots of amino acid usage of peptide epitope residue positions over time (January 2020–June 2022) in global viral genome sequences (GISAID): HLA-DR1-S486–505 (left), -S511–530 (middle), and -S761–775 (right). Reference (Wuhan HU-1 strain) amino acid usage frequency (aa. freq.) is colored gray, and mutations associated with Omicron (BA.1) mutations are colored pink. Other mutations present in other lineages are colored blue. Plots were generated using the Nextstrain ncov portal. (B) Sequence alignment of epitope sequences in SARS-CoV-2 variants. Variant mutations are as defined by the CoVariants project, highlighting mutations found in Omicron (BA.1) (pink) and other variants (blue) compared with Wuhan HU-1. Anchor residue positions are highlighted (darker gray) based on structural definitions. (C) In vitro immunogenicity of Wuhan HU-1 and Omicron (BA.1) variants of S486–505 and S761–775: overnight IFN-γ ELISpot (n = 2 wells) in response to short-term culture with both variant peptides in HLA-DR1+ donors (n = 3). Data are presented as boxplots (center line, mean; box edges, IQR; whiskers, ±1.5IQR) with individual response by each donor shown via circles. Data are colored by restimulating peptide during ELISpot assay as indicated below. (D) Representative IFN-γ ELISpot images of data described in (C) for donor DRB101, DRB113. Peptides used in the cultured T cell line are across rows, and the variant peptides used for restimulation (overnight ELISpot assay) are indicated in columns. ELISpot images from all three donors are shown in Figure S4E. (E) Peptide-HLA-DR1 binding curves for Omicron (BA.1) variant peptide epitopes of S486–505 and S761–775. Data are presented as described in Figure 1B with calculated affinity (IC50) indicated in the insets, representative of n = 3 independent assays, each with n = 3 technical replicates.
Figure 5
Figure 5
Structural implications of Omicron (BA.1) mutations on HLA-DR1 epitope presentation (A) Structural overview of HLA-DR1-S486–505Omicron (BA.1) aligned and overlaid on top of the HLA-DR1-S486–505Wuhan HU-1 structure. For both, the HLA-DR1 peptide binding groove is shown as a gray cartoon representation, with the S486–505Omicron (BA.1) peptide shown as sticks (C atoms, pink) and S486–505Wuhan HU-1 peptide shown as sticks (C atoms, aqua). Amino acid mutations contained within S486–505Omicron (BA.1) that differ between variants are highlighted by the pink residue labels (inset). (B) Structural overview of HLA-DR1-S761–775Omicron (BA.1) aligned and overlaid on top of the HLA-DR1-S761–775Wuhan HU-1 structure in two registers: (left) a +1 register shift relative to HLA-DR1-S761–775Wuhan HU-1 observed in asymmetric unit (ASU) copies 1and3 and (right) the same register as HLA-DR1-S761–775Wuhan HU-1 observed in ASU copy 2. Colored and represented as described in (A). (C) Surface cross-sectional view of the HLA-DR1 binding groove of HLA-DR1-S761–775Wuhan HU-1 (left), HLA-DR1-S761–775Omicron (BA.1) +1 register shift (middle), and HLA-DR1-S761–775Omicron (BA.1) same register (right). In each, the HLA-DR1 binding groove has been clipped in the z plane at approximately the deepest point in the P1 pocket. The residue buried in the deep hydrophobic P1 pocket is labeled with peptide represented as sticks (colored as previously). (D) Expanded cross-sectional view of the P1 pocket of S761–775 peptides/conformations. In each, residues that line the P1 pocket are shown as stick representations (DRA, light gray C atoms; DR1β, dark gray C atoms). Residues that form the back of the pocket (as viewed) are shown semi-transparent. Asn82β, which forms the front of the pocket (as viewed), is omitted for clarity.

References

    1. Rydyznski Moderbacher C., Ramirez S.I., Dan J.M., Grifoni A., Hastie K.M., Weiskopf D., Belanger S., Abbott R.K., Kim C., Choi J., et al. Antigen-specific adaptive immunity to SARS-CoV-2 in acute COVID-19 and associations with age and disease severity. Cell. 2020;183:996–1012.e19. doi: 10.1016/J.CELL.2020.09.038. - DOI - PMC - PubMed
    1. Robbiani D.F., Gaebler C., Muecksch F., Lorenzi J.C.C., Wang Z., Cho A., Agudelo M., Barnes C.O., Gazumyan A., Finkin S., et al. Convergent antibody responses to SARS-CoV-2 in convalescent individuals. Nature. 2020;584:437–442. doi: 10.1038/s41586-020-2456-9. - DOI - PMC - PubMed
    1. Anderson E.J., Rouphael N.G., Widge A.T., Jackson L.A., Roberts P.C., Makhene M., Chappell J.D., Denison M.R., Stevens L.J., Pruijssers A.J., et al. Safety and immunogenicity of SARS-CoV-2 mRNA-1273 vaccine in older adults. N. Engl. J. Med. 2020;383:2427–2438. doi: 10.1056/NEJMOA2028436. - DOI - PMC - PubMed
    1. Folegatti P.M., Ewer K.J., Aley P.K., Angus B., Becker S., Belij-Rammerstorfer S., Bellamy D., Bibi S., Bittaye M., Clutterbuck E.A., et al. Safety and immunogenicity of the ChAdOx1 nCoV-19 vaccine against SARS-CoV-2: a preliminary report of a phase 1/2, single-blind, randomised controlled trial. Lancet. 2020;396:467–478. doi: 10.1016/S0140-6736(20)31604-4. - DOI - PMC - PubMed
    1. Sahin U., Muik A., Vogler I., Derhovanessian E., Kranz L.M., Vormehr M., Quandt J., Bidmon N., Ulges A., Baum A., et al. BNT162b2 vaccine induces neutralizing antibodies and poly-specific T cells in humans. Nature. 2021;595:572–577. doi: 10.1038/s41586-021-03653-6. - DOI - PubMed

Publication types