. 2023 Dec 15;29(24):5140-5154.
doi: 10.1158/1078-0432.CCR-23-1111.

Cancer-Associated Fibroblast-Like Tumor Cells Remodel the Ewing Sarcoma Tumor Microenvironment

Affiliations

Cancer-Associated Fibroblast-Like Tumor Cells Remodel the Ewing Sarcoma Tumor Microenvironment

Emma D Wrenn et al. Clin Cancer Res. .

Abstract

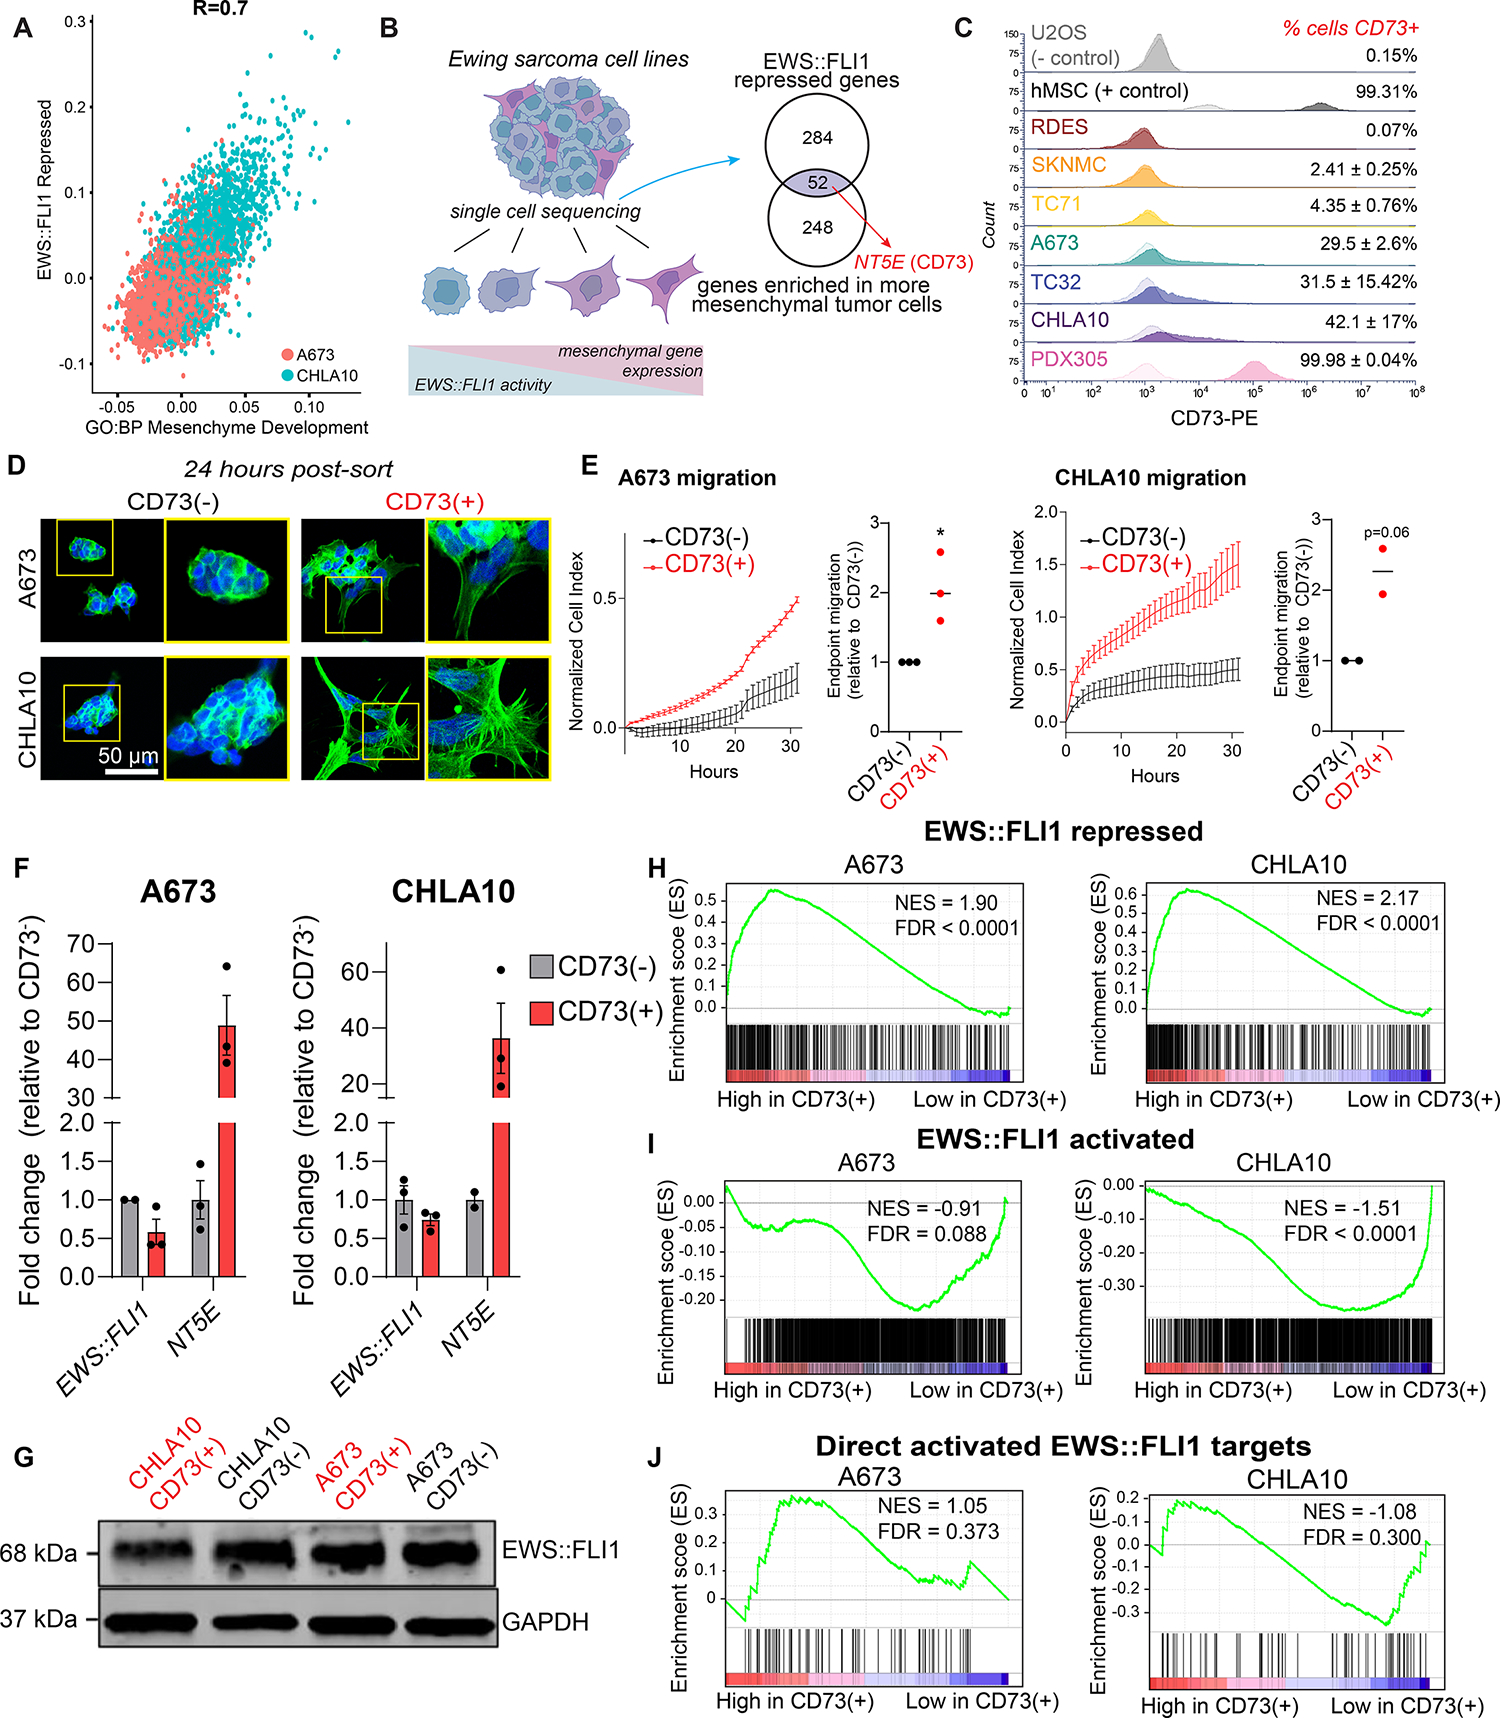
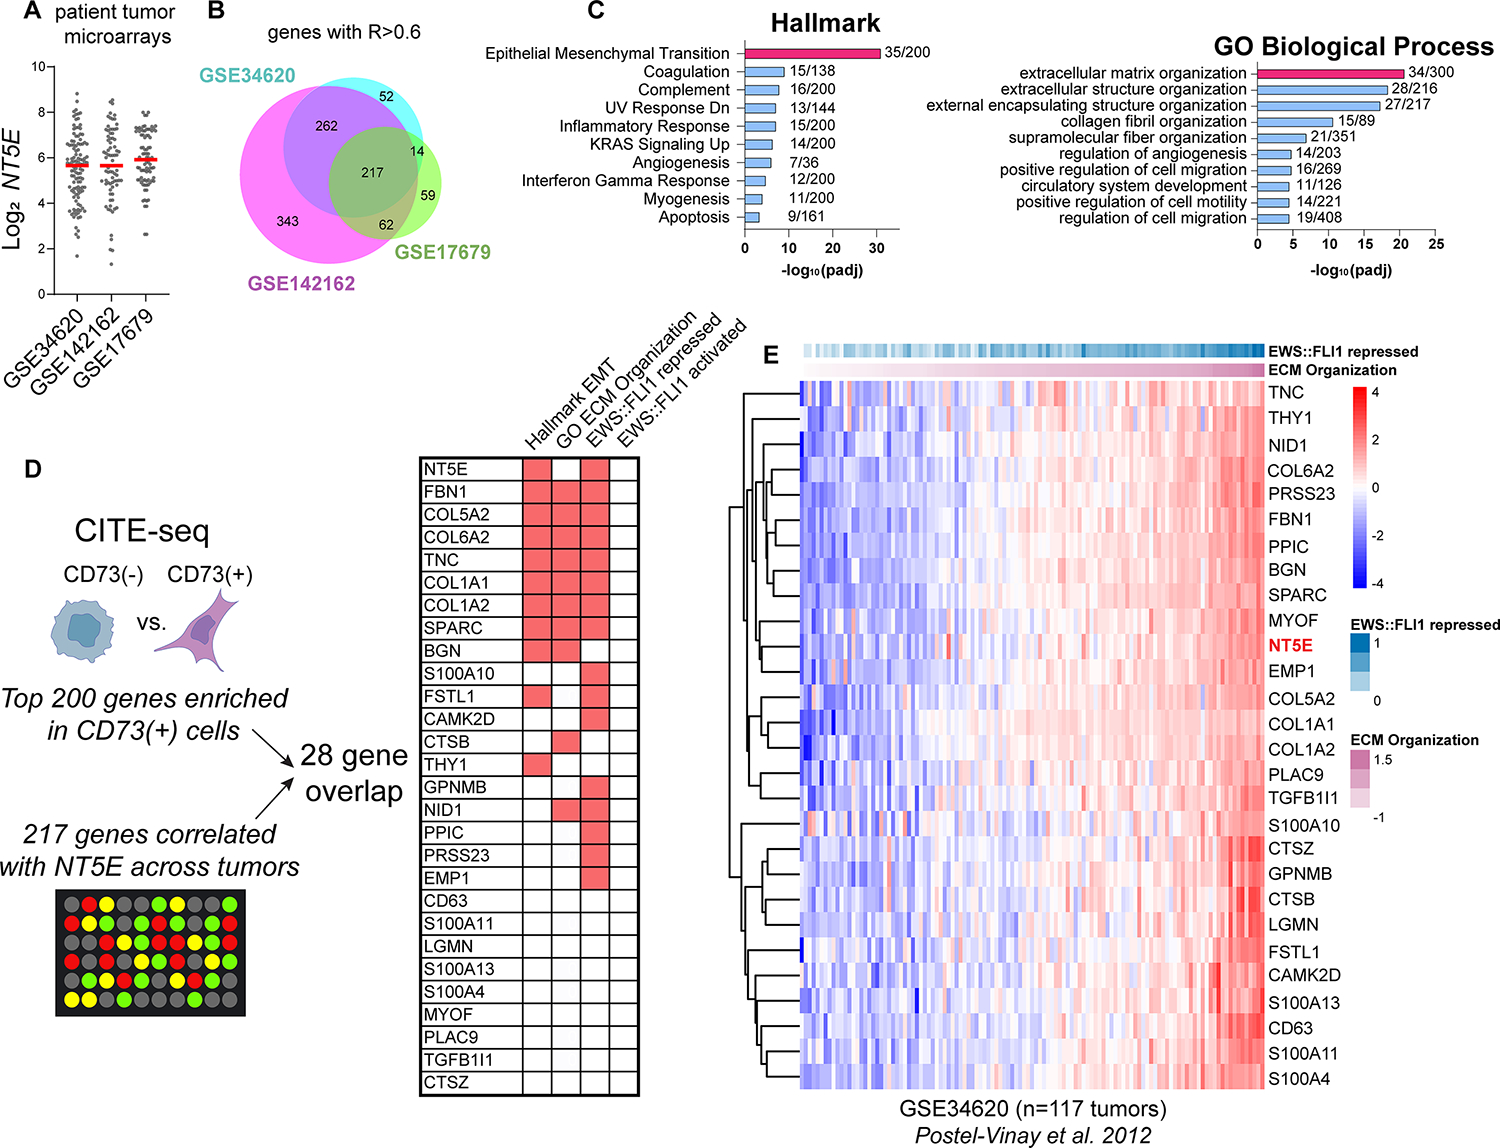
Purpose: Despite limited genetic and histologic heterogeneity, Ewing sarcoma (EwS) tumor cells are transcriptionally heterogeneous and display varying degrees of mesenchymal lineage specification in vitro. In this study, we investigated if and how transcriptional heterogeneity of EwS cells contributes to heterogeneity of tumor phenotypes in vivo.

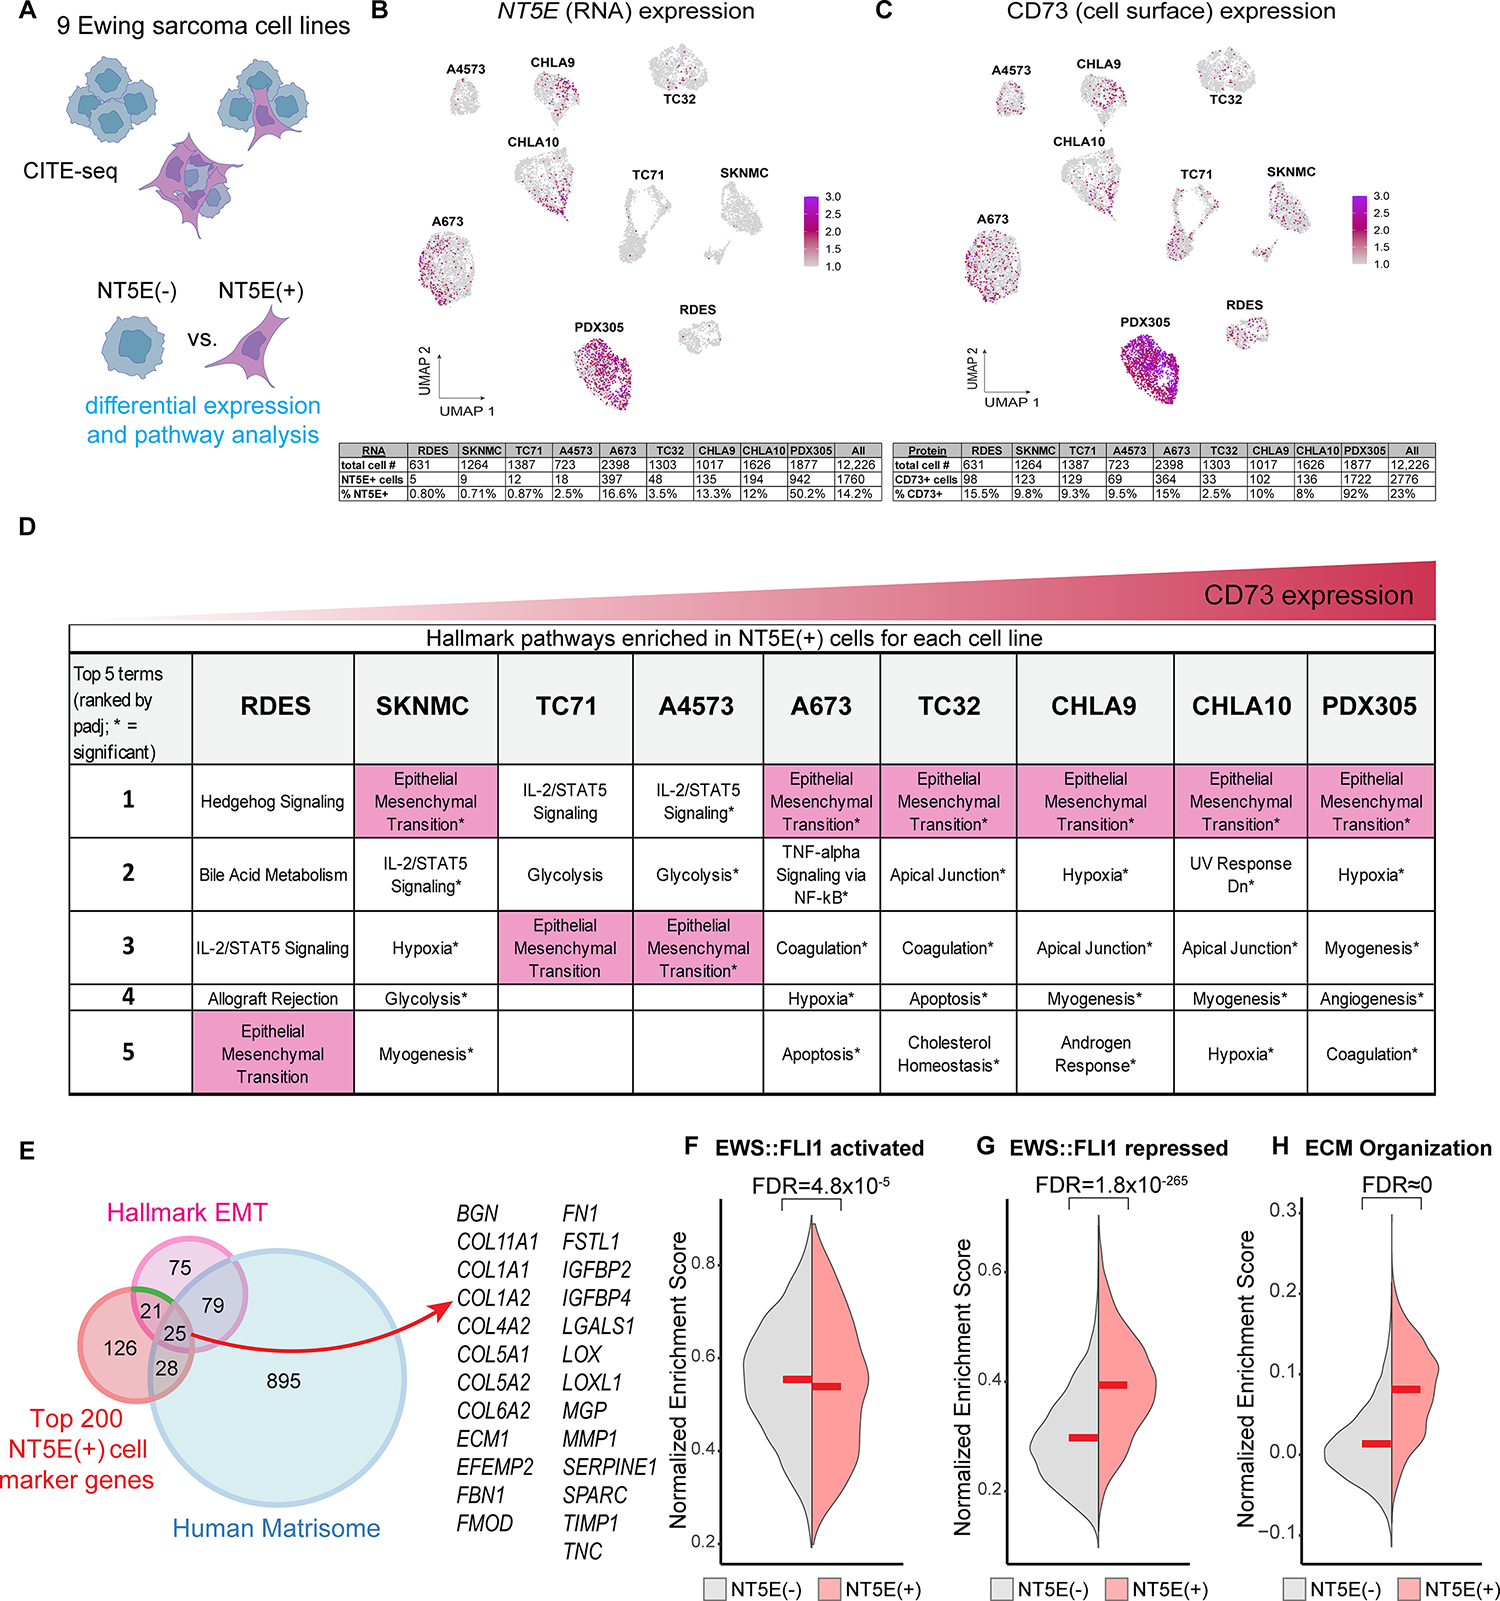
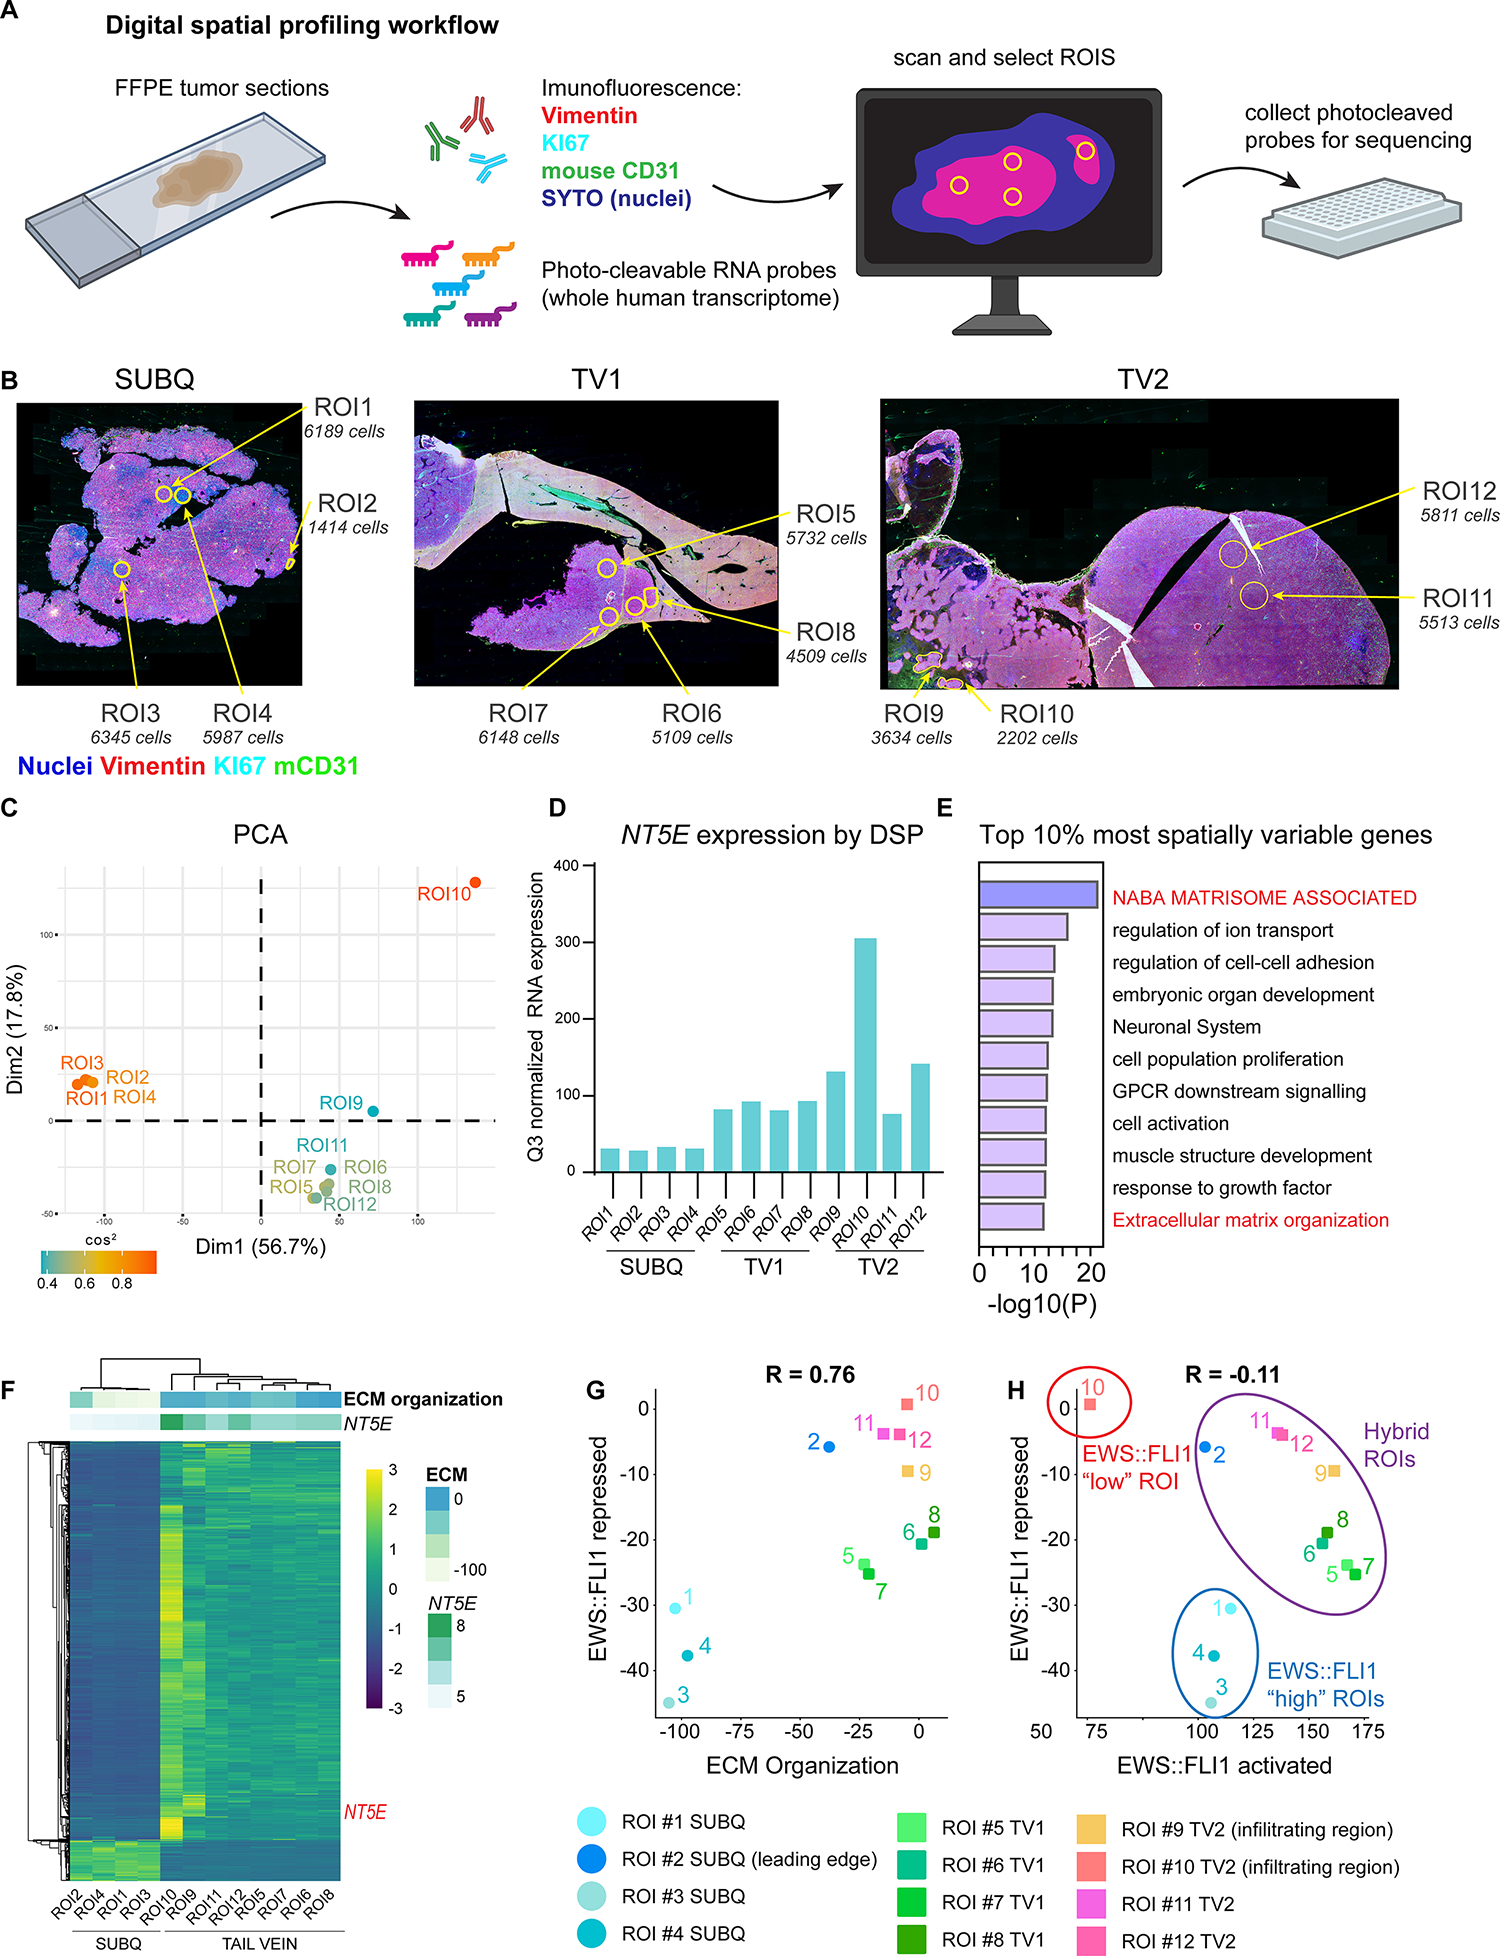
Experimental design: Single-cell proteogenomic-sequencing of EwS cell lines was performed and integrated with patient tumor transcriptomic data. Cell subpopulations were isolated by FACS for assessment of gene expression and phenotype. Digital spatial profiling and human whole transcriptome analysis interrogated transcriptomic heterogeneity in EwS xenografts. Tumor cell subpopulations and matrix protein deposition were evaluated in xenografts and patient tumors using multiplex immunofluorescence staining.

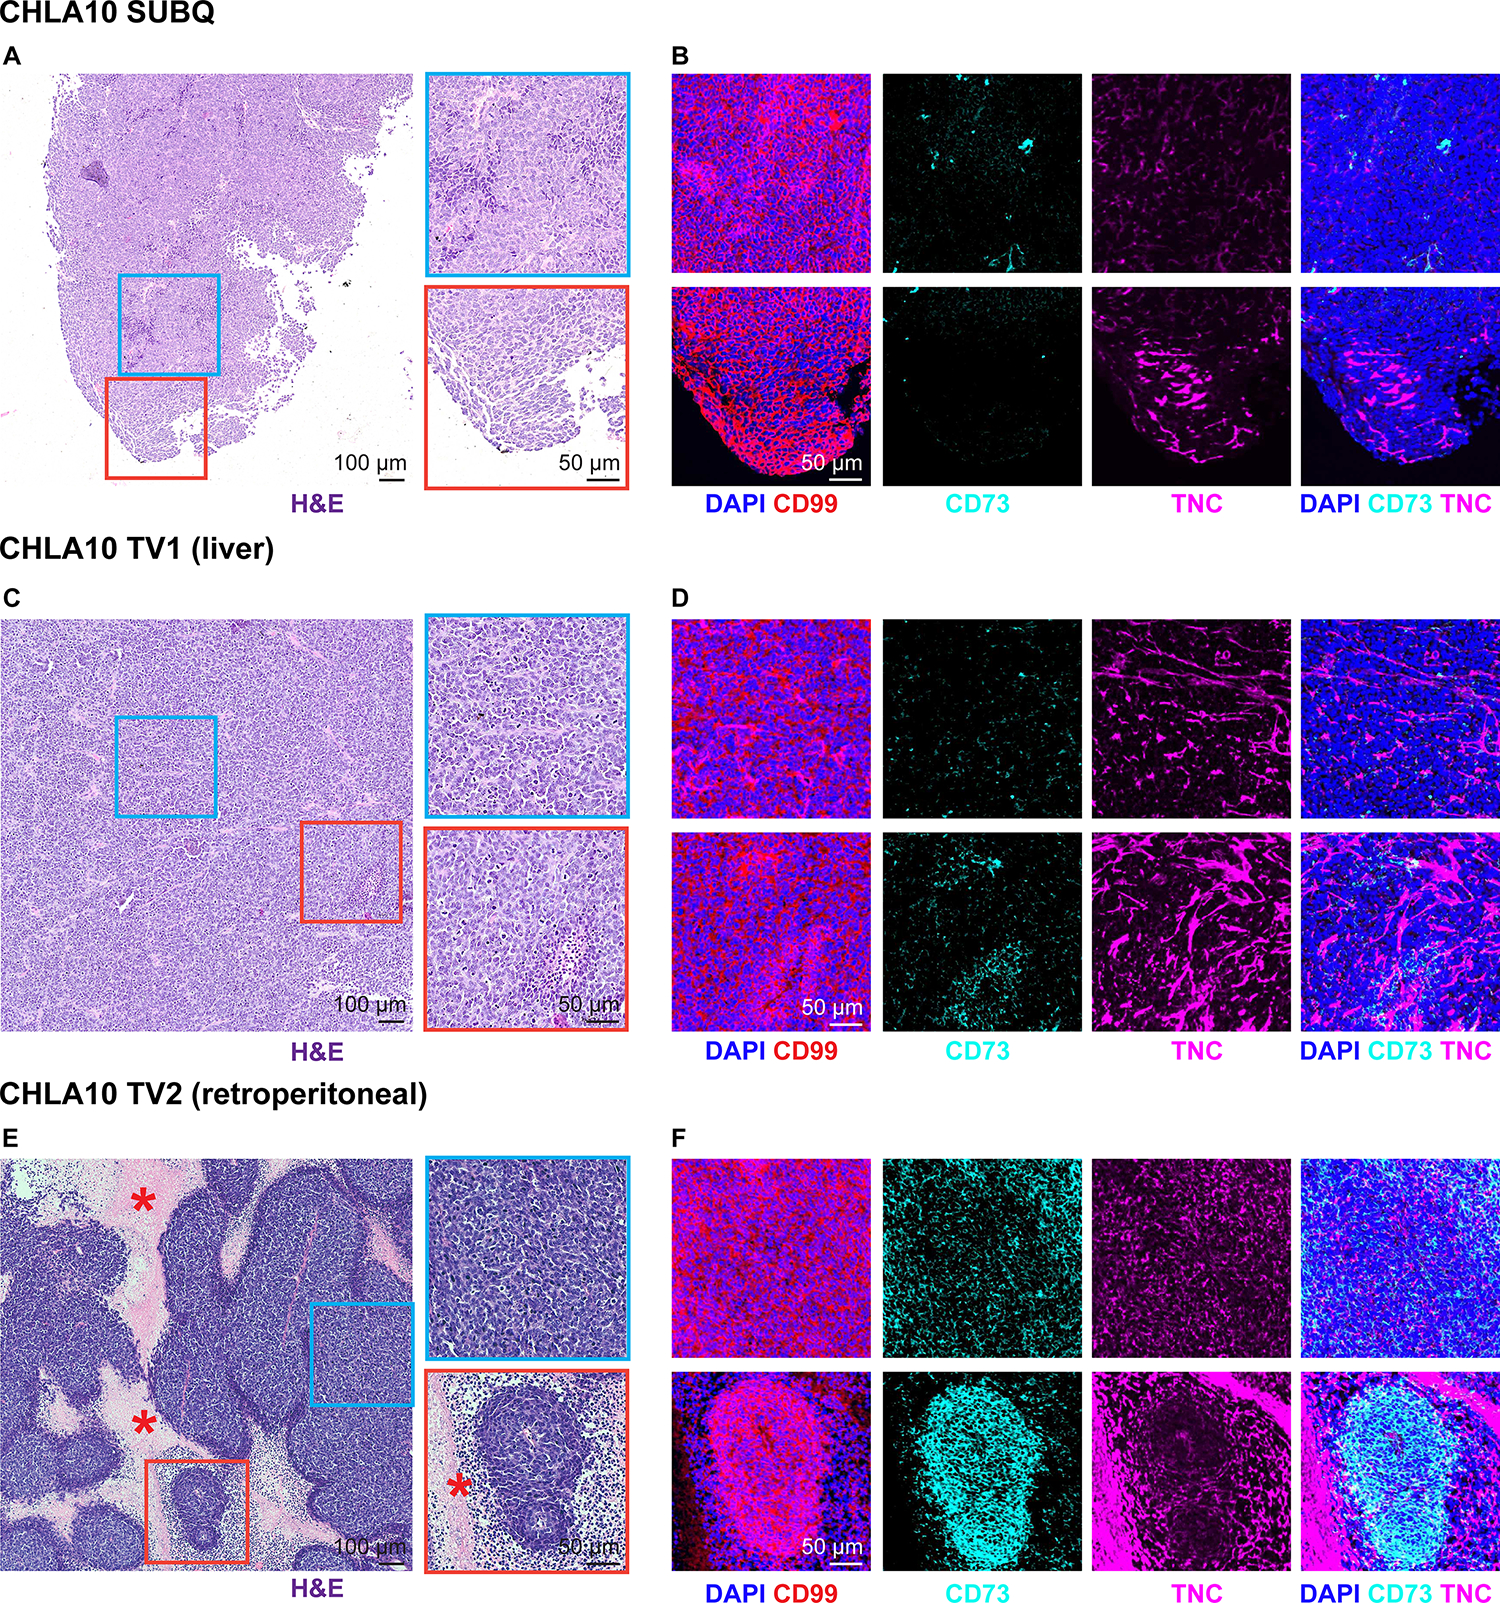
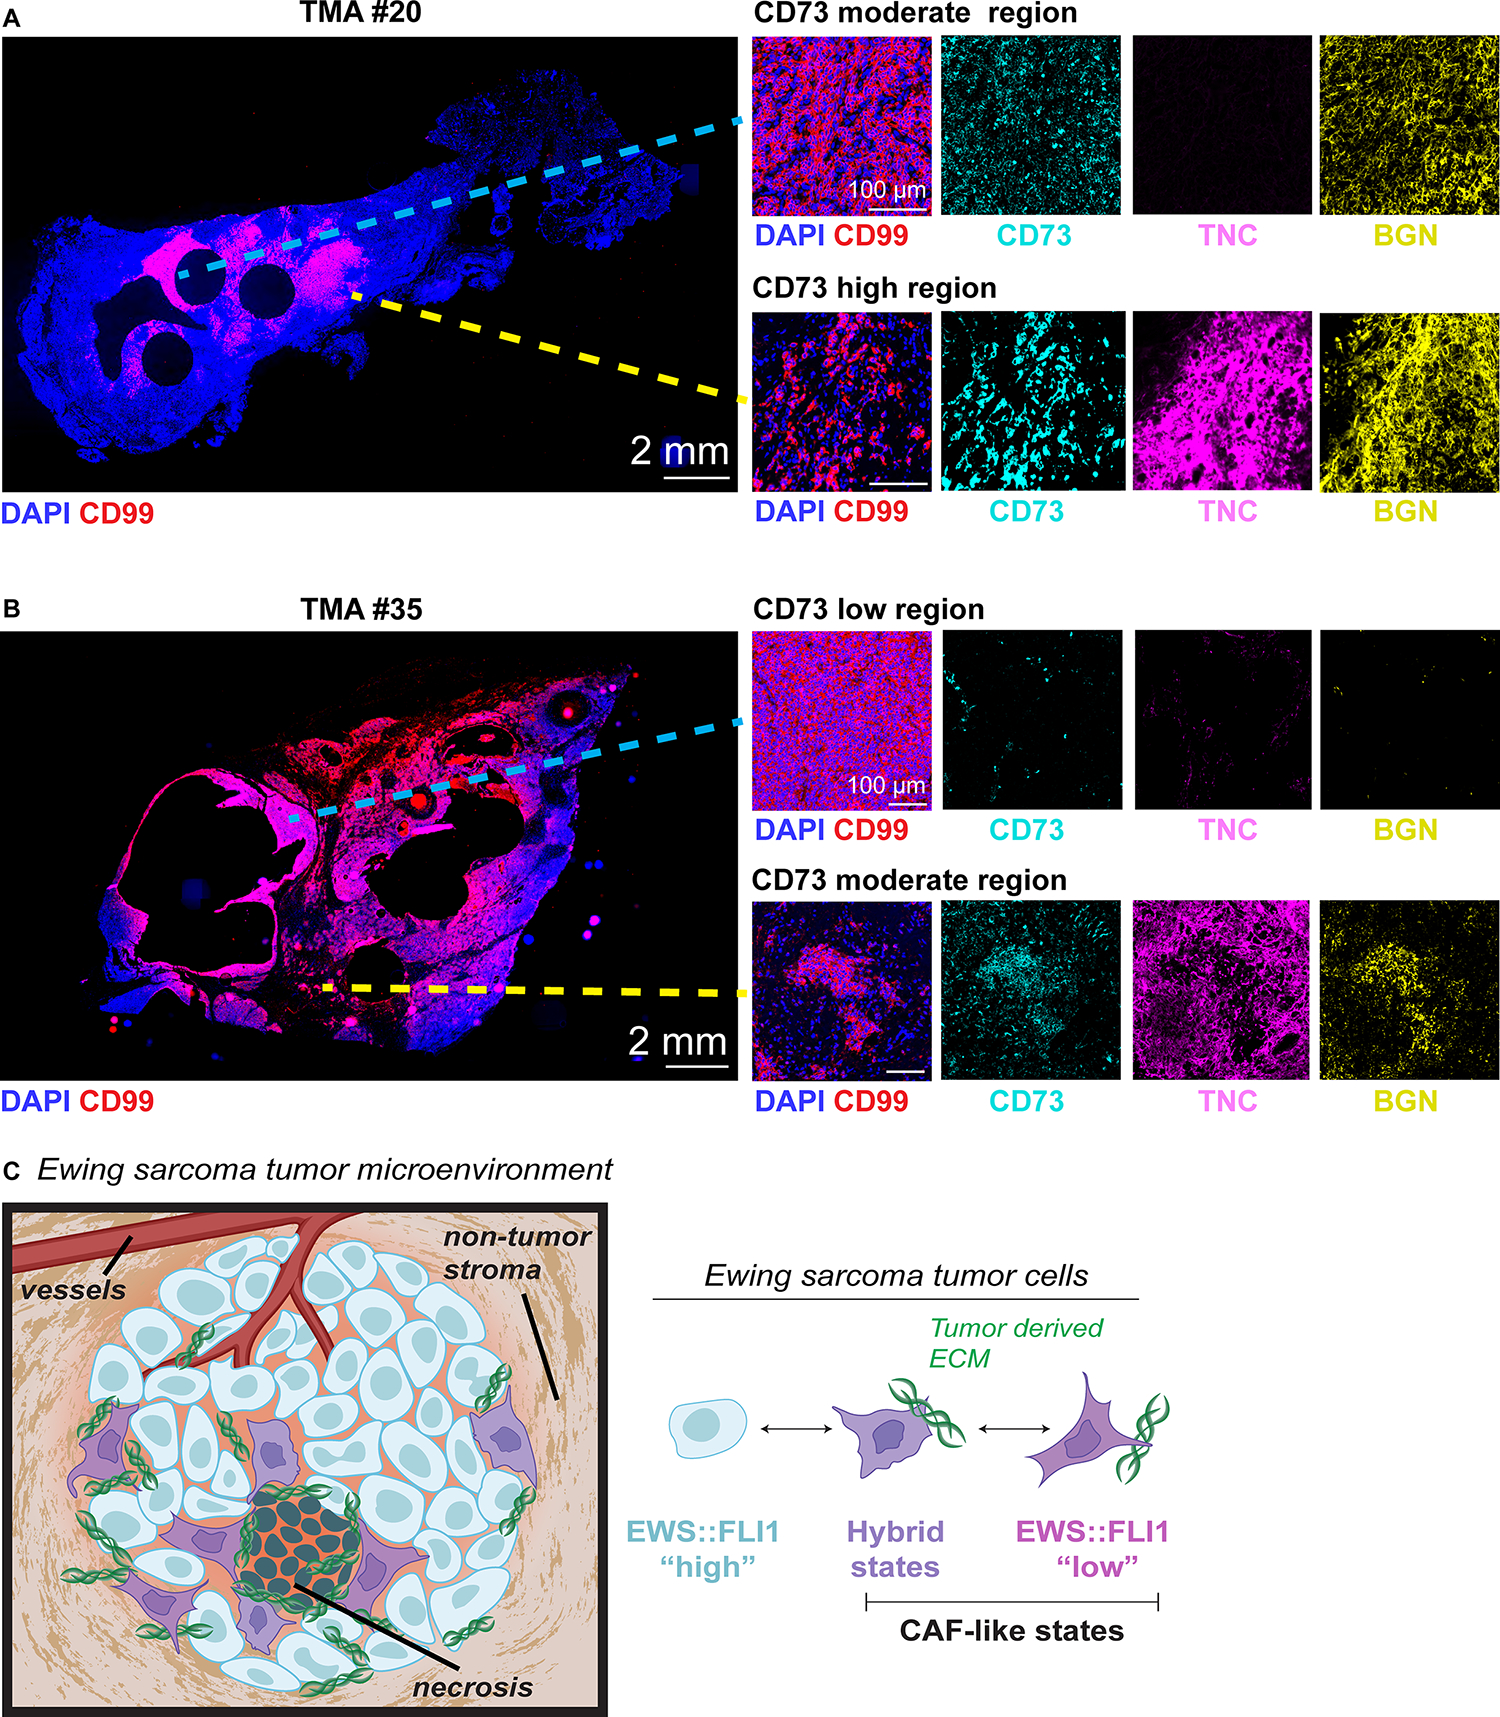
Results: We identified CD73 as a biomarker of highly mesenchymal EwS cell subpopulations in tumor models and patient biopsies. CD73+ tumor cells displayed distinct transcriptional and phenotypic properties, including selective upregulation of genes that are repressed by EWS::FLI1, and increased migratory potential. CD73+ cells were distinguished in vitro and in vivo by increased expression of matrisomal genes and abundant deposition of extracellular matrix (ECM) proteins. In epithelial-derived malignancies, ECM is largely deposited by cancer-associated fibroblasts (CAF), and we thus labeled CD73+ EwS cells, CAF-like tumor cells. Marked heterogeneity of CD73+ EwS cell frequency and distribution was detected in tumors in situ, and CAF-like tumor cells and associated ECM were observed in peri-necrotic regions and invasive foci.

Conclusions: EwS tumor cells can adopt CAF-like properties, and these distinct cell subpopulations contribute to tumor heterogeneity by remodeling the tumor microenvironment. See related commentary by Kuo and Amatruda, p. 5002.


Conflict of interest statement

Conflict of interest statement: The authors have declared that no conflict of interest exists.

Figures

Figure 1.
Figure 1.. CD73 marks mesenchymal tumor cells that express EWS::FLI1-repressed genes.
A) Scatter plot depicting expression of an EWS::FLI1 repressed gene set (31) and mesenchyme development genes (GO:0060485) in A673 and CHLA10 single-cell sequencing data (19). B) Left, Ewing sarcoma cells exist along a spectrum of mesenchymal identity. Genes associated with mesenchymal identity are repressed by EWS::FLI1. Right, Venn diagram depicting genes enriched in mesenchymal state EwS cells that are in both GO:BP Mesenchyme Development and EWS::FLI1-repressed (Kinsey et al. 2006) gene sets. C) Flow cytometry of CD73 cell surface expression in EwS and non-EwS (U2OS, hMSC) cell lines (CD73 = dark, isotype control = light). D) DAPI and F-actin staining of FACS-sorted CD73 and CD73+ EwS cells in 2D culture, 24 hours after sorting (representative images of n=3). E) Left, real-time transwell cell migration assay of isogenic CD73 and CD73+ cells (representative biological replicate shown, see Supplemental Figure 1 for additional replicates, error bars=SEM). Right, relative quantification of migration at endpoint for each replicate (A673 n=3, CHLA10 n=2). F) RT-qPCR of EWS::FLI1 and NT5E expression in CD73-sorted cell populations (n=2–3, error bars=SEM). G) Immunoblot of EWS::FLI1 protein expression in CD73-sorted cells. GAPDH is loading control. Representative of n=2. H-J) Gene set enrichment analysis (GSEA) of RNA-seq data generated from CD73-sorted cell populations (n=3) H) genes repressed by EWS::FLI1 expression (31), I) genes activated by EWS:FLI1 expression (31), and J) 78 genes directly bound and upregulated by EWS::FLI1 (30).
Figure 2.
Figure 2.. CD73+ EwS tumor cells selectively upregulate expression of a pro-tumorigenic matrisomal gene program.
A) Workflow of CD73 CITE-seq and downstream differential expression analyses. B-C) UMAPs of CITE-seq data for NT5E (RNA) or CD73 (cell surface) expression in 9 EwS cell lines. Below, number of NT5E/CD73+ cells by cell line. D) Hallmark gene sets enriched in NT5E+ cells from each cell line. E) Venn diagram overlap of Hallmark EMT genes, human matrisome genes (35), and the 200 top markers (by log fold change) of NT5E+ cells as determined by single cell CITE-seq. Right, the 25 genes present in all 3 gene sets. F-H) Split violin plots depicting a normalized enrichment score for expression of (F) EWS::FLI1 activated (31) (G) EWS::FLI1 repressed (31), and (H) GO:BP ECM Organization (GO:0030198) gene sets in NT5E+ and NT5E cells (CITE-seq data inclusive of 9 EwS cell lines).
Figure 3.
Figure 3.. Spatial heterogeneity of CD73+ tumor cells and ECM deposition in vivo.
FFPE sections were generated from 3 CHLA10 tumor xenografts from 3 separate mice: one subcutaneous tumor (SUBQ), a liver tumor (TV1), and a retroperitoneal tumor (TV2) formed after tail vein injection. A) H&E staining of the SUBQ xenograft tumor. Right, zoomed insets. B) Immunofluorescence of the same regions in adjacent SUBQ FFPE sections for DAPI (nuclei), CD99 (tumor membrane marker), CD73, and human TNC. C) H&E staining of the TV1 xenograft liver tumor. Right, zoomed insets. D) Immunofluorescence of the same regions in adjacent TV1 FFPE sections for DAPI (nuclei), CD99 (tumor membrane marker), CD73, and human TNC. E) H&E staining of the TV2 xenograft retroperitoneal tumor. Right, zoomed insets. Asterisk marks regional necrosis adjacent to viable tumor borders. F) Immunofluorescence of the same regions in adjacent TV2 FFPE sections for DAPI (nuclei), CD99 (tumor membrane marker), CD73, and human TNC.
Figure 4.
Figure 4.. Digital spatial profiling reveals transcript and protein-level spatial heterogeneity in EwS tumors.
A) Workflow of the Digital Spatial Profiling (DSP) method used. Briefly, immunofluorescence of Vimentin (mesenchymal cytoskeletal marker), KI67 (proliferative nuclei), SYTO (all nuclei), anti-mouse CD31 (murine blood vessels) were used to select regions of interest (ROIs) on xenograft sections hybridized with a whole human transcriptome probe library. ROIs were captured and gene expression quantified by next-generation sequencing after UV cleavage of probes from selected ROIs. B) Vimentin, KI67, mCD31, SYTO (nuclei) immunofluorescence and selected ROIs indicated for each of 3 tumors subjected to DSP: CHLA10 (SUBQ) and tail vein-derived liver (TV1) and retroperitoneal (TV2) tumors as in Figure 3. Approximate DAPI+ cell count is listed for each ROI. C) PCA plot of normalized whole human transcriptome gene expression for each ROI. Colored by cos2 value (indicates quality of representation by the principal components). D) Bar graph depicting Q3 normalized mRNA expression of NT5E within each ROI as determined by DSP and next generation sequencing. E) Gene ontology (Metascape) of the top 10% most spatially variable genes across 12 ROIs (highest coefficient of variation between ROIs, n=1339 genes). E) Unsupervised heatmap of the top 10% most spatially variable genes across all ROIs. Top panels show expression of NT5E (log2) and the GO:BP ECM Organization gene set. G) Scatter plot of expression of EWS::FLI1-repressed gene signature (31) vs. ECM Organization gene set expression. Individual ROIs are labeled. H) Scatter plot of RNA expression of EWS::FLI1 repressed signature vs. EWS::FLI1 activated signature in each ROI (31). EWS::FLI1-high, EWS::FLI1-low, and EWS::FLI1-hybrid ROIs are indicated.
Figure 5.
Figure 5.. Heterogeneity of NT5E and related mesenchymal transcriptomic signatures in EwS patient tumor biopsies.
A) Log2 NT5E expression derived from three independent gene expression microarray studies of patient tumors (18, 41, 42). B) Venn diagram of genes positively correlated with NT5E (R>0.6) in each dataset and the intersection of these genes. C) Hallmark and GO:BP gene ontology (Enrichr) of the 217 NT5E-correlated genes (and NT5E itself) shared across three studies. D) Workflow and characterization of the overlap between genes marking NT5E+ cells (from Figure 2) and genes highly correlated with NT5E in patient tumor biopsies. Right, membership of overlapping 28 genes in Hallmark EMT, GO:BP ECM Organization, EWS::FLI1 repressed (31, 43, 44), and EWS::FLI1 activated gene sets (30, 31, 43, 44). E) Heatmap of NT5E and 27 associated marker gene expression vs. EWS::FLI1 repressed genes (31), ranked by ECM organization expression in Ewing sarcoma patient tumor microarray GSE34620 (41).
Figure 6.
Figure 6.. Intra-tumoral heterogeneity of CD73+ tumor cells and ECM deposition in patient biopsies.
Immunofluorescence analysis of full tumor biopsy sections: (A) TMA ID #20 (extensive CD73+ scoring on TMA) and (B) TMA ID #35 (negative CD73 scoring on TMA). DAPI (nuclei), CD99 (tumor membrane marker), CD73, Tenascin-C, and biglycan. Right panels, zoomed insets show regions from the same tumor section with disparate CD73 expression and ECM deposition. C) Model of cell state heterogeneity in EwS wherein tumors contains spatially and transcriptionally heterogeneous subpopulations of tumor cells. Selective derepression of EWS::FLI1-suppressed mesenchymal target genes leads to acquisition of mesenchymal identity without loss of EWS::FLI1-dependent gene activation and tumorigenicity. These transcriptionally hybrid cells display properties of CAFs and promote remodeling of the TME by depositing pro-tumorigenic ECM.

Update of

Comment in

References

    1. Greaves M Evolutionary determinants of cancer. Cancer discovery. 2015;5(8):806–20. - PMC - PubMed
    1. McGranahan N, and Swanton C. Clonal heterogeneity and tumor evolution: past, present, and the future. Cell. 2017;168(4):613–28. - PubMed
    1. Sahai E, Astsaturov I, Cukierman E, DeNardo DG, Egeblad M, Evans RM, et al. A framework for advancing our understanding of cancer-associated fibroblasts. Nature Reviews Cancer. 2020;20(3):174–86. - PMC - PubMed
    1. Hanahan D Hallmarks of Cancer: New Dimensions. Cancer Discovery. 2022;12(1):31–46. - PubMed
    1. Li Z, Seehawer M, and Polyak K. Untangling the web of intratumour heterogeneity. Nature cell biology. 2022;24(8):1192–201. - PubMed

MeSH terms

Substances