. 2023 Jul 20;19(7):e1011332.
doi: 10.1371/journal.pcbi.1011332. eCollection 2023 Jul.

Risk averse reproduction numbers improve resurgence detection

Affiliations

Risk averse reproduction numbers improve resurgence detection

Kris V Parag et al. PLoS Comput Biol. .

Abstract

The effective reproduction number R is a prominent statistic for inferring the transmissibility of infectious diseases and effectiveness of interventions. R purportedly provides an easy-to-interpret threshold for deducing whether an epidemic will grow (R>1) or decline (R<1). We posit that this interpretation can be misleading and statistically overconfident when applied to infections accumulated from groups featuring heterogeneous dynamics. These groups may be delineated by geography, infectiousness or sociodemographic factors. In these settings, R implicitly weights the dynamics of the groups by their number of circulating infections. We find that this weighting can cause delayed detection of outbreak resurgence and premature signalling of epidemic control because it underrepresents the risks from highly transmissible groups. Applying E-optimal experimental design theory, we develop a weighting algorithm to minimise these issues, yielding the risk averse reproduction number E. Using simulations, analytic approaches and real-world COVID-19 data stratified at the city and district level, we show that E meaningfully summarises transmission dynamics across groups, balancing bias from the averaging underlying R with variance from directly using local group estimates. An E>1generates timely resurgence signals (upweighting risky groups), while an E<1ensures local outbreaks are under control. We propose E as an alternative to R for informing policy and assessing transmissibility at large scales (e.g., state-wide or nationally), where R is commonly computed but well-mixed or homogeneity assumptions break down.


Conflict of interest statement

We declare no competing interests.

Figures

Fig 1
Fig 1. Illustrations of optimal experimental designs and local reproduction number combinations.
(A) The geometric interpretation of A, D and E-optimal designs for the p = 2 parameter scenario. The overall uncertainty of the parameters is defined by an uncertainty ellipse in the space spanned by possible values of the local reproduction numbers. The ellipse is centred on the MLEs of the parameters and its shape is determined by the inverse of the FI around those estimates. Each design minimises a different characteristic of the ellipse. A minimises the bounding box, D minimises the ellipse area, and E minimises the largest chord (coloured respectively). (B) A ternary plot demonstrating the trajectories of the consensus statistics D and E as a function of different group reproduction numbers Rj. These are for p = 3 and constrained so R1+R2+R3 = 3. The colour and contour lines represent E at each combination of Rj. We see that E is maximised at the edges, when only one Rj is non-zero. D is at the centre of the triangle, as it is the arithmetic mean of the Rj.
Fig 2
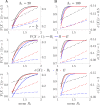
Fig 2. Relative sensitivity of E and R to resurgence dynamics.
By sampling from the posterior gamma distributions of [11], we simulate p = 2 local groups, varying the values of R1, while keeping R2 at mean value of 1. We plot sensitivities to resurgence of the effective, R, and risk averse, E, reproduction numbers relative to the maximum local reproduction number R1. These are indicated by the values of P(X>1) for X = R, E and R1 (solid blue, red, and black, respectively). (A) and (B) show these resurgence probabilities on left y-axes over a range of mean R1 values for scenarios with small (A) and large (B) numbers of active group 1 infections, Λ1. We can assess resurgence sensitivity by how quickly P(X>1) rises and describe the impact of active infections in group 2 using r=Λ2Λ1. We find that E balances the sensitivity between R1 and R. The latter loses sensitivity as the active infections in group 2 become larger relative to that of group 1 (i.e., as r increases). This occurs despite group 2 having stable infection counts. We plot the standard deviation of the reproduction number estimates on right-y axes as σ(X) for X = R, E and R1 (dotted blue, red, and black, respectively). We observe that the local R1 is noisiest (largest uncertainty), while R has the smallest uncertainty (overconfidence). E again, achieves a useful balance.
Fig 3
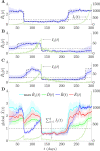
Fig 3. Consensus statistics for resurging and controlled epidemics.
We simulate local epidemics Ij(t) (dark green) across time t using renewal models with Ebola virus generation times from [47] and true local reproduction numbers with step-changing profiles (dashed black). Estimates of these are in (A)–(C) as R^j(t) together with 95% credible intervals (blue curves with shaded regions). (D) provides consensus and summary statistic estimates (also with 95% credible intervals), which we calculate by combining the R^j(t). Variations in the standard reproduction number R^(t) are also reflected in the total incidence j=13Ij(t). Risk averse E^(t) and mean D^(t) reproduction numbers do not signal subcritical spread at t≈70 (unlike R^(t)) and E^(t) is most sensitive to resurgence signals. The statistic max R^j(t) is risk averse but magnifies noise. We use EpiFilter [48] to estimate all reproduction numbers.
Fig 4
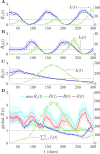
Fig 4. Consensus statistics for fluctuating and monotonic epidemic dynamics.
We simulate local epidemics Ij(t) over time t from renewal models with Ebola virus generation times as in [47] and true local reproduction numbers with either sinusoidal or monotonically increasing and then decreasing profiles (dashed black). Estimates of these are in (A)–(C) as R^j(t) together with 95% credible intervals. (D) plots consensus and summary statistics (also with 95% credible intervals), which we compute by combining those R^j(t). Variations in the standard reproduction number R^(t) are also reflected in the total incidence j=13Ij(t). Both R^(t) and the mean D^(t) reproduction number average over the fluctuating transmissibility of resurging groups but the risk averse E^(t) is sensitive to these potentially important signals. Only R^(t) deems the epidemic to be controlled around t≈200. The max R^j(t) statistic is risk averse but very sensitive to local estimate uncertainties. We use EpiFilter [48] to estimate all reproduction numbers.
Fig 5
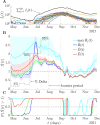
Fig 5. Risk averse reproduction numbers for COVID-19 in Israel.
We plot the cases by date of positive test (and in log scale) in (A) for p = 20 cities in Israel during the Delta wave of COVID-19 from [51]. These constitute 49% of all cases in Israel (summed incidence in black) and have been smoothed with a weekly moving average. We infer the standard, R^(t), maximum group, max R^j(t), mean, D^(t), and risk averse, E^(t), reproduction numbers (with 95% credible intervals) using EpiFilter [48] in (B) under the serial interval distribution estimated in [52]. We also plot the proportion of cases attributable to the Delta strain from [50] (black, dot-dashed). We assume perfect reporting and that generation times are well approximated by the serial intervals. (C) integrates the posterior estimates from (B) into resurgence probabilities P(X^(t)>1). While all reproduction numbers indicate effectiveness of the vaccination campaign in curbing spread, R^(t) is the slowest to signal resurgence across June, at which point the Delta strain has a 70% share in all cases. E^(t) is more aligned with signalling Delta emergence but avoids the inflated uncertainty of max R^j(t).
Fig 6
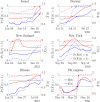
Fig 6. Transmissibility estimates for COVID-19 in 6 empirical datasets.
We estimate the standard, R^(t) (blue) and risk averse, E^(t) (red) reproduction numbers (with 95% credible intervals) using EpiFilter [48] on COVID-19 data describing epidemics in 6 diverse locations (see panel titles). We use the serial interval distribution in [52] and demarcate key periods of resurgence with vertical dashed lines. We investigate these periods in detail in Fig 7. Black curves show the shape of the total incidence in the case studies for context. Fig A of the S1 Appendix plots the group level incidence, which often feature heterogeneous patterns.
Fig 7
Fig 7. Resurgence signals from transmissibility estimates for COVID-19 in 6 empirical datasets.
We compute sequential estimates of standard, R^(t) (blue) and risk averse, E^(t) (red) reproduction numbers across the periods delimited in Fig 6 and using the same serial intervals and data described above. These estimates are prospective i.e., at any timepoint they assume that the time series ends at that point (see Fig A of the S1 Appendix for more examples). Consequently, these estimates simulate the sequential signals that would have been available about resurgence as incidence data accumulated in real time. Solid lines show lower 95% credible intervals from both X^(t) relative to a threshold of 1 (solid black, coloured circle intersections). Dashed lines compare P(X^(t)>1) to a probability of 0.95 (dashed black, coloured square intersections). These are conservative metrics.

References

    1. Fraser C. Estimating individual and household reproduction numbers in an emerging epidemic. PLoS One. 2007;2: e758. doi: 10.1371/journal.pone.0000758 - DOI - PMC - PubMed
    1. Cauchemez S, Boëlle P-Y, Thomas G, Valleron A-J. Estimating in real time the efficacy of measures to control emerging communicable diseases. Am J Epidemiol. 2006;164: 591–597. doi: 10.1093/aje/kwj274 - DOI - PubMed
    1. Team WER. Ebola Virus Disease in West Africa–The First 9 Months of the Epidemic and Forward Projections. N Engl J Med. 2014;371: 1481–95. doi: 10.1056/NEJMoa1411100 - DOI - PMC - PubMed
    1. Churcher T, Cohen J, Ntshalintshali N, Others. Measuring the path toward malaria elimination. Science. 2014;344: 1230–32. - PMC - PubMed
    1. Fraser C, Donnelly CA, Cauchemez S, Hanage WP, Van Kerkhove MD, Hollingsworth TD, et al.. Pandemic potential of a strain of influenza A (H1N1): early findings. Science. 2009;324: 1557–1561. doi: 10.1126/science.1176062 - DOI - PMC - PubMed

Publication types