. 2023 Aug 10;66(15):10432-10457.
doi: 10.1021/acs.jmedchem.3c00576. Epub 2023 Jul 20.

C-2 Thiophenyl Tryptophan Trimers Inhibit Cellular Entry of SARS-CoV-2 through Interaction with the Viral Spike (S) Protein

Affiliations

C-2 Thiophenyl Tryptophan Trimers Inhibit Cellular Entry of SARS-CoV-2 through Interaction with the Viral Spike (S) Protein

Marta Gargantilla et al. J Med Chem. .

Abstract

Severe acute respiratory syndrome coronavirus 2 (SARS-CoV-2) causes COVID-19, by infecting cells via the interaction of its spike protein (S) with the primary cell receptor angiotensin-converting enzyme (ACE2). To search for inhibitors of this key step in viral infection, we screened an in-house library of multivalent tryptophan derivatives. Using VSV-S pseudoparticles, we identified compound 2 as a potent entry inhibitor lacking cellular toxicity. Chemical optimization of 2 rendered compounds 63 and 65, which also potently inhibited genuine SARS-CoV-2 cell entry. Thermofluor and microscale thermophoresis studies revealed their binding to S and to its isolated receptor binding domain (RBD), interfering with the interaction with ACE2. High-resolution cryoelectron microscopy structure of S, free or bound to 2, shed light on cell entry inhibition mechanisms by these compounds. Overall, this work identifies and characterizes a new class of SARS-CoV-2 entry inhibitors with clear potential for preventing and/or fighting COVID-19.


Conflict of interest statement

The authors declare no competing financial interest.

Figures

Figure 1
Figure 1
Antivirals approved for emergency use against SARS-CoV-2.
Figure 2
Figure 2
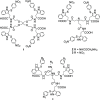
Trp derivatives 13, which were initially identified as having antiviral activity and low cytotoxicity in the VSV-S HTS assay, while I represents the general structure of the compounds here synthesized and tested.
Scheme 1
Scheme 1. Reagents and Conditions: (a) pNPS-Cl, AcOH, THF, rt, 1 h, 50–88% Yields; (b) LiOH·H2O, THF/H2O, rt, 24 h, 90–95% Yields; (c) H-TrpOMe·HCl, HATU, DIPEA, Anhydrous DMF, 30 °C, 24 h, 93% Yield
Scheme 2
Scheme 2. Reagents and Conditions: (a) the Corresponding Phenyl Disulfide, I2, MeCN, Sealed Tube, 60 °C, 4 h, 35–83% Yields; (b) Piperidine, DCM, rt, 2 h, 68–89% Yields; (c) TBAI, Anhydrous DMF, rt, 24 h, 22–26% Yields
Scheme 3
Scheme 3. Reagents and Conditions: (a) HATU, DIPEA, Anhydrous DMF, 30 °C, 24 h, 52–89% Yields; (b) LiOH·H2O, THF/H2O, rt, 24 h, 50%-Quantitative Yields
Scheme 4
Scheme 4. Reagents and Conditions: (a) Pd(OAc)2, TFA, Anhydrous DMF, MW: 100 °C, 2 h, 46% Yield; (b) 6, HATU, DIPEA, Anhydrous DMF, 30 °C, 40 h, 99% Yield; (c) LiOH·H2O, THF/H2O, rt, 24 h, 51–96% Yields; (d) 4-Nitrobenzoyl Chloride (1.5 equiv), SnCl4 (3 equiv), Anhydrous DCM, 0 °C, 3 h, 37% Yield; (e) Piperidine, DCM, rt, 2 h, 53% Yield; (f) 4-Nitrobenzoyl Chloride (4.5 equiv), SnCl4 (9 equiv), Anhydrous DCM, 0 °C to rt, 8.5 h, 21% Yield
Scheme 5
Scheme 5. Reagents and Conditions: (a) Piperidine, DCM, rt, 2 h, 73% Yield; (b) the Corresponding Acyl Chloride, Propylene Oxide, Anhydrous DCM, rt, 3.5–5 h, 30–59% Yields; (c) LiOH·H2O, THF/H2O, rt, 24 h, 41%-Quantitative Yields
Scheme 6
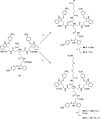
Scheme 6. Reagents and Conditions: (a) Monomethyl Adipate for 60; Fmoc-9-amino-4,7-dioxanonanoic Acid for 62, HATU, DIPEA, Anhydrous DMF, 30 °C, 24 h, 53–57% Yields; (b) LiOH·H2O, THF/H2O, rt, 24 h, 60–91% Yields
Scheme 7
Scheme 7. Reagents and Conditions: (a) 4,7,10,13-Tetraoxohexadecane-1,16-dioic Acid, HATU, DIPEA, Anhydrous DMF, 30 °C, 24 h, 65% Yield; (b) LiOH·H2O, THF/H2O, rt, 48 h, 81% Yield
Figure 3
Figure 3
Mechanism of action of compound 2. (A) Compound 2 at a concentration of 100 μM was preincubated with VSV-S before the virus was added to the cells (preinfection drug-treatment), added 1 h after infection with VSV-S, when the entry process was completed (post-infection drug treatment), or it was preincubated with VSV pseudotyped with the VSV glycoprotein (bar-labeled VSV-G) to assess specificity for S-mediated entry. The degree of infection in each condition was standardized relative to that of infected cells mock-treated with the solvent alone. (B) The effect of preincubating different concentrations of compound 2 with the cells prior to addition of VSV-S (preincubation w/ cells; black line and symbols) or preincubating different concentrations of compound 2 with VSV-S prior to addition to cells (preincubation w/ virus; gray line and symbols). Data represent the mean and SEM of at least three replicates.
Figure 4
Figure 4
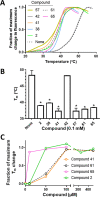
Influence of the investigated compounds on the thermofluor profiles and Tm values of the RBD. (A) Fluorescence profiles with a gradual thermal increase for the recombinantly produced RBD in the presence of 100 μM of the indicated compounds. The profiles represent the mean of at least three replicates. The fluorescence change is given as a fraction of the maximum change for the observed transition. (B) Temperatures for 50% of the maximum fluorescence change (Tm) for the RBD in the absence (None) or in the presence of 100 μM of the indicated compounds. Data are means ± SD of two or more replicates. Statistical significance (Dunnet multiple comparisons test versus the None column in one-way ANOVA) is marked by * (P ≤ 0.0001). (C) Changes in Tm for RBD with increasing concentration of the indicated compounds. Results are expressed as a fraction of the extrapolated maximum change inferred from sigmoidal fitting of the experimental results (fitting not shown).
Figure 5
Figure 5
Microscale thermophoresis (MST) results. (A) Crude MST traces exemplified for fluorescently labeled RBD (50 nM) in the presence of increasing concentrations of compound 65 (in 2-fold steps, range 0.15 μM to 5 mM, see the Experimental Section; each step in a different rainbow color). (B–D) Hyperbolic fitting of the plots of fractional fluorescence change arising from fluorescently labeled RBD or S (as indicated in the figures) at different concentrations of: (B) compounds 2, 65, and 42; (C, D) the extracellular catalytic domain of human ACE2 (see the Experimental Section) in the absence or in the presence of 0.5 mM of 2 or 65, as indicated. The fraction of saturation was estimated for each concentration of the ligand as the quotient (FxF0) / (FF0), where F0, Fx, and F are the fluorescence in the absence, at a given concentration, and at infinite concentration of the ligand that is varied, respectively. F was estimated from the hyperbolic fitting. In the case of compound 42, the data were fitted to the minimal possible value of KD accepted by the fitting program (Graphpad Prism). Curves correspond to hyperbolic fitting (in semilog representation). Each point is the mean (±SE) for three different titrations. The KD values are the concentrations giving a half-maximum change. In panel B, given the lack of statistical differences in the KD values for 2 versus RBD and versus S, and of 65 versus RBD, a single hyperbola has been drawn fitting all the clumped points for these three data sets (KD, 34.6 μM). In panel C, a single hyperbola is shown for the clumped results for 2 and 65, given the lack of statistically significative differences between them (KD values of ACE2 for RBD, 55.1 ± 4 and 618 ± 86 nM in the absence or presence of the compounds, respectively). In panel D, KD values for the binding of ACE2 to S were 17.2 ± 2.2 and 388 ± 45 nM in the respective absence and presence of 0.5 mM 65.
Figure 6
Figure 6
CryoEM imaging sheds light on compound 2 binding to the spike and on its interference with viral entry. (A) Representative cryoEM micrograph of the purified S:D614G protein (see the Experimental Section). (B) Set of representative top and side view class averages obtained after reference-free 2D classification of automatically picked and extracted particles. (C) Fourier Shell Correlation (FSC) resolution curves of the spike in 3-down conformation, shown as the regular cryoSPARC global FSC resolution output, which includes no mask and different masks. Resolution, based on the gold standard 0.143 criterion, is 4.3 Å. (D) Cryo-EM maps of the S:D614G protein homotrimer with one RBD in the up position and two RBDs in down positions (top), or with the three RBDs in down positions (middle and bottom). Each subunit is shown in a different color (green, purple, and yellow). The top and middle panels represent side views of the spike with the molecular 3-fold axis of the trimer vertical, while in the bottom panel, the spike is seen from outside the virus, and the molecular threefold axis is perpendicular to the page. The nonprotein density observed (colored blue) in the middle and bottom panels appears to correspond to bound compound 2, present in the solution (see the Experimental Section), given the reasonably good gross fitting of this compound (in sticks) to the profile of the nonprotein density (panel E, in blue). (F) Zoom on this density profile to show nearby residues from two subunits. The Cα atoms of the indicated residues are localized with spheres in the backbone (yellow or green depending on the subunit) and are identified in single-letter amino acid notation. The N-glycosylation of N343 was visible on the map, and it is represented in sticks. (G) Superimposition of the structure of the backbone of the RBD of subunit C (colored yellow) of the spike in the 3-down conformation observed here, with that of the RBD (in gray) in the RBD-ACE2 complex (PDB 7A94(41)), to illustrate that the density (blue) attributed here to compound 2 sits at the part of RBD that interacts with ACE2, strongly suggesting interference of compound 2 with the interaction of the spike with its receptor. (H) Partial view of the 1-up/2-down structure (in different shades of pink depending on the subunit) of the spike observed here, superimposed on the 3-down structure also observed here (in green and yellow). The RBDs of the A and C subunits of the two structures are superimposed, while subunit B of the three-down structure is not seen. In the two RBDs that are equally positioned in the two structures, there is some shift in the position of subunit A in the three-down structure (highlighted by the arrows) away from the position of the up RBD, expectedly destabilizing this up position. Given the location of the extra density equated here with compound 2 (symbolized with a blue ellipse), the binding of his compound could stabilize the down position of chain A, away from its optimal position for stabilizing the up position of chain B.

References

    1. Zhu N.; Zhang D.; Wang W.; Li X.; Yang B.; Song J.; Zhao X.; Huang B.; Shi W.; Lu R.; Niu P.; Zhan F.; Ma X.; Wang D.; Xu W.; Wu G.; Gao G. F.; Tan W. A Novel Coronavirus from Patients with Pneumonia in China, 2019. N. Engl. J. Med. 2020, 382, 727–733. 10.1056/NEJMoa2001017. - DOI - PMC - PubMed
    1. Matheson N. J.; Lehner P. J. How Does SARS-CoV-2 Cause COVID-19?. Science 2020, 369, 510–511. 10.1126/science.abc6156. - DOI - PubMed
    1. Fung T. S.; Liu D. X. Human Coronavirus: Host-Pathogen Interaction. Annu. Rev. Microbiol. 2019, 73, 529–557. 10.1146/annurev-micro-020518-115759. - DOI - PubMed
    1. Petrosillo N.; Viceconte G.; Ergonul O.; Ippolito G.; Petersen E. COVID-19, SARS and MERS: Are They Closely Related?. Clin. Microbiol. Infect. 2020, 26, 729–734. 10.1016/j.cmi.2020.03.026. - DOI - PMC - PubMed
    1. Siegel D.; Hui H. C.; Doerffler E.; Clarke M. O.; Chun K.; Zhang L.; Neville S.; Carra E.; Lew W.; Ross B.; Wang Q.; Wolfe L.; Jordan R.; Soloveva V.; Knox J.; Perry J.; Perron M.; Stray K. M.; Barauskas O.; Feng J. Y.; Xu Y.; Lee G.; Rheingold A. L.; Ray A. S.; Bannister R.; Strickley R.; Swaminathan S.; Lee W. A.; Bavari S.; Cihlar T.; Lo M. K.; Warren T. K.; Mackman R. L. Discovery and Synthesis of a Phosphoramidate Prodrug of a Pyrrolo[2,1-f][Triazin-4-Amino] Adenine C-Nucleoside (GS-5734) for the Treatment of Ebola and Emerging Viruses. J. Med. Chem. 2017, 60, 1648–1661. 10.1021/acs.jmedchem.6b01594. - DOI - PubMed

Publication types

Substances