. 2023 Aug 8;35(8):1356-1372.e5.
doi: 10.1016/j.cmet.2023.06.015. Epub 2023 Jul 19.

Liver mitochondrial cristae organizing protein MIC19 promotes energy expenditure and pedestrian locomotion by altering nucleotide metabolism

Affiliations

Liver mitochondrial cristae organizing protein MIC19 promotes energy expenditure and pedestrian locomotion by altering nucleotide metabolism

Jee Hyung Sohn et al. Cell Metab. .

Abstract

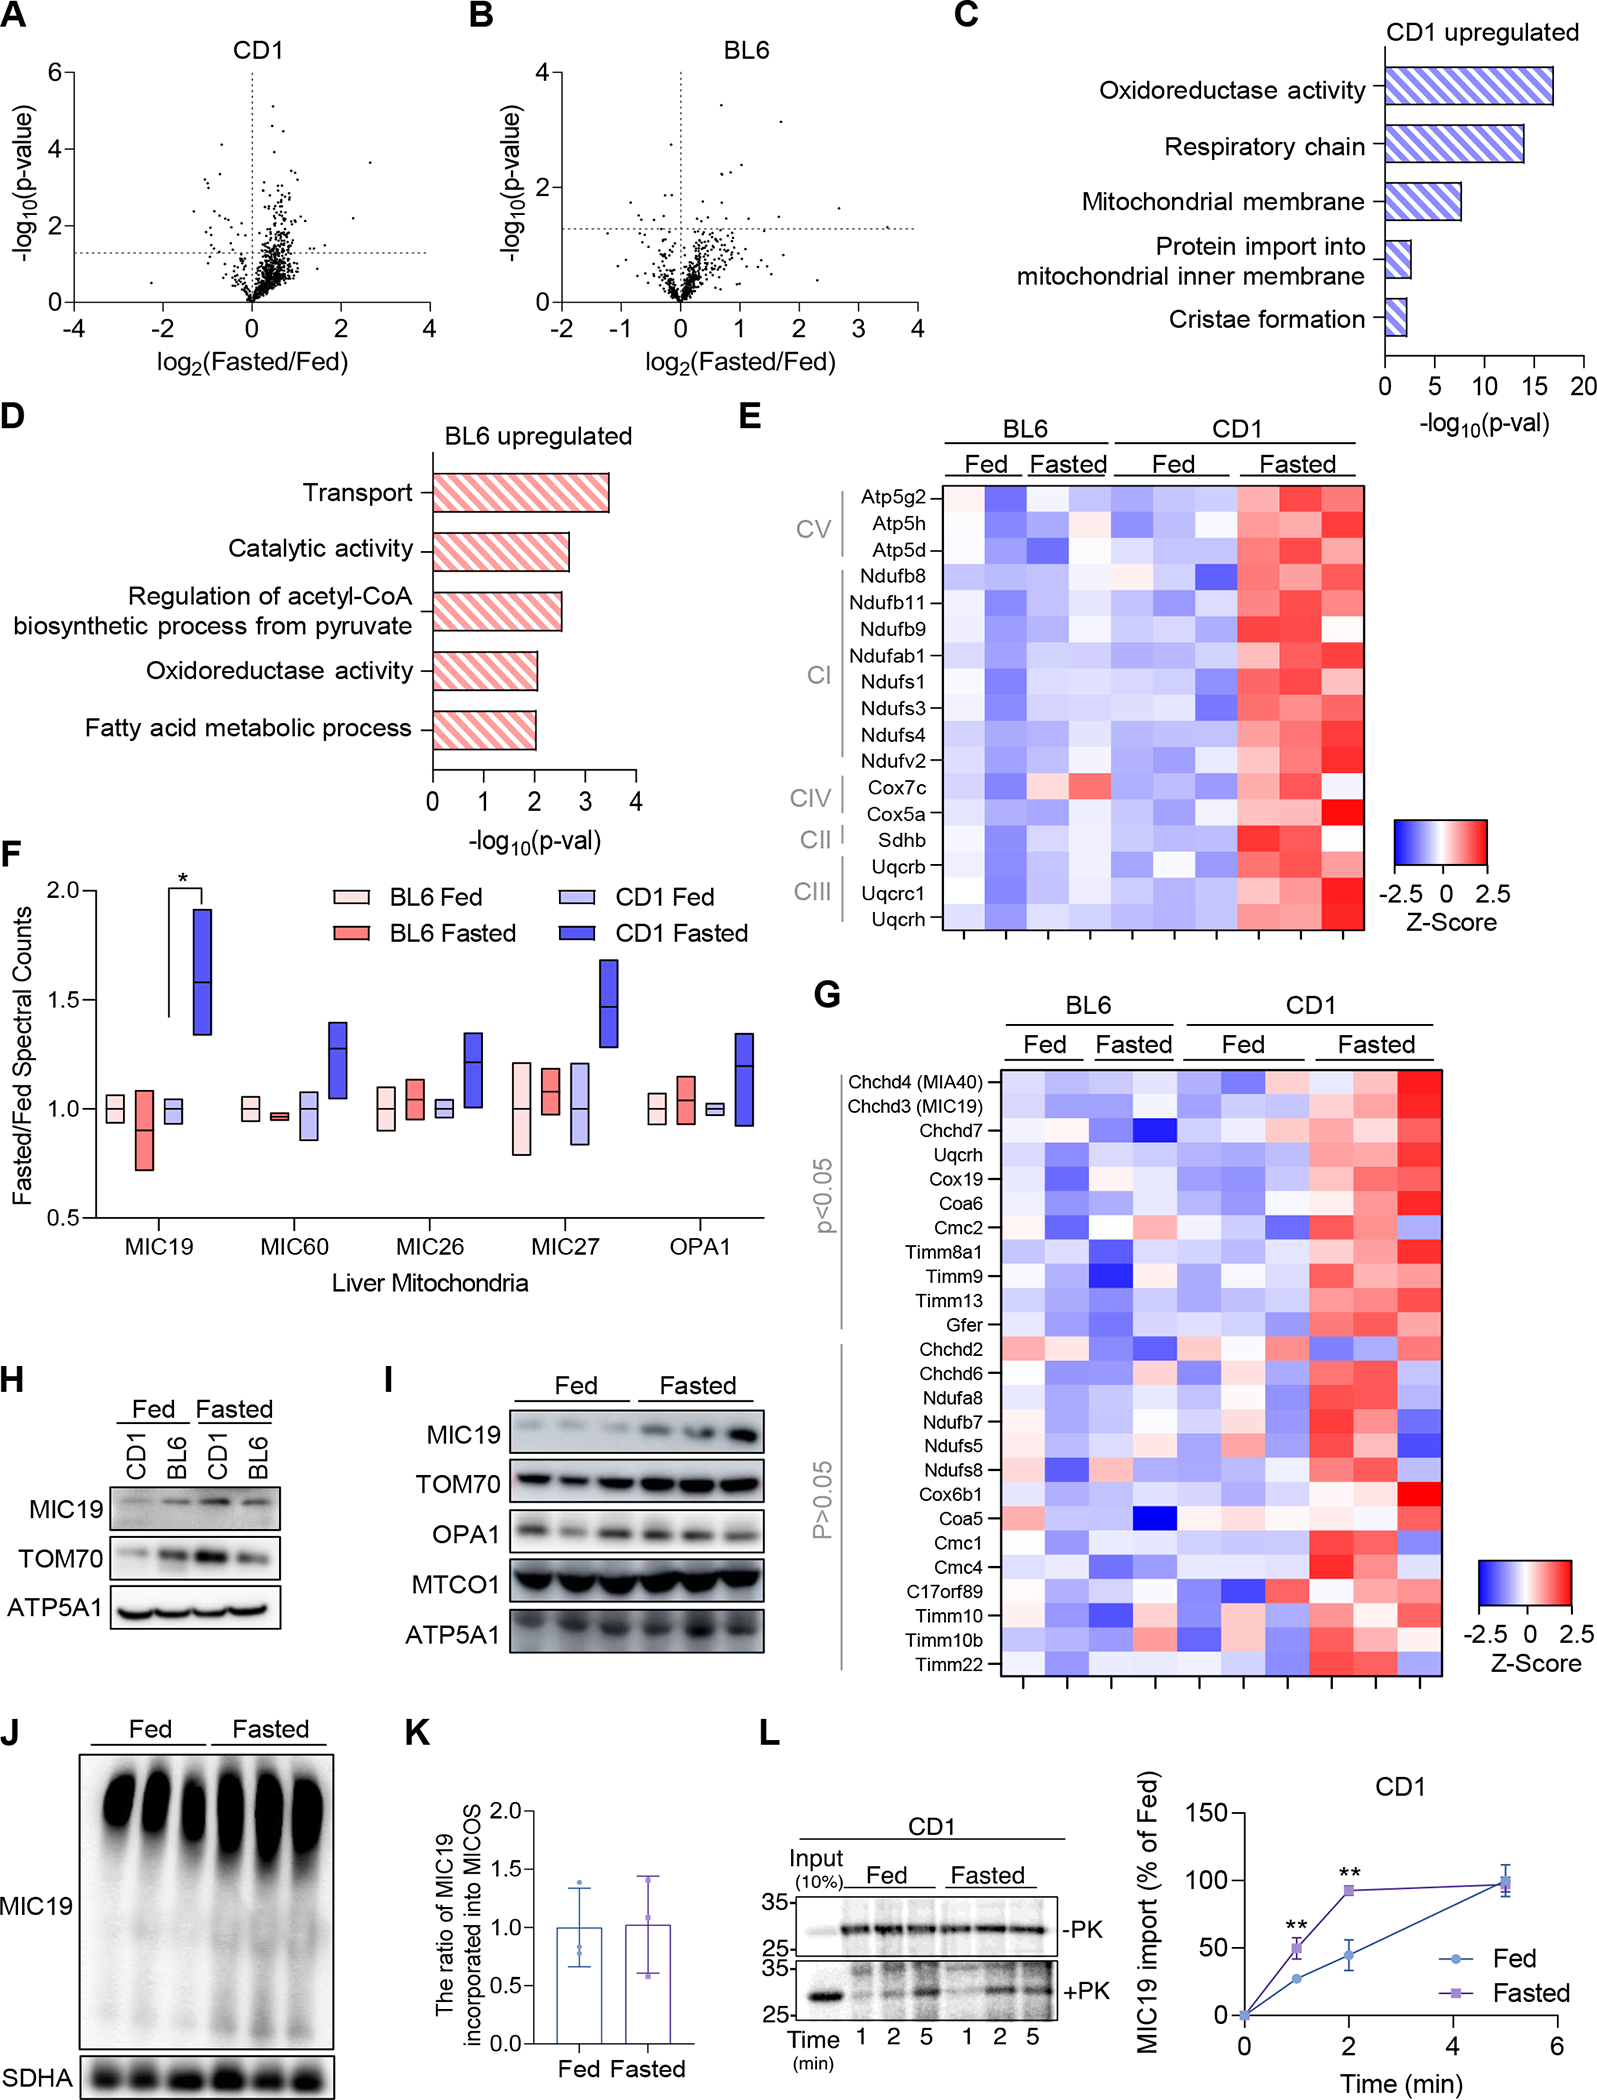
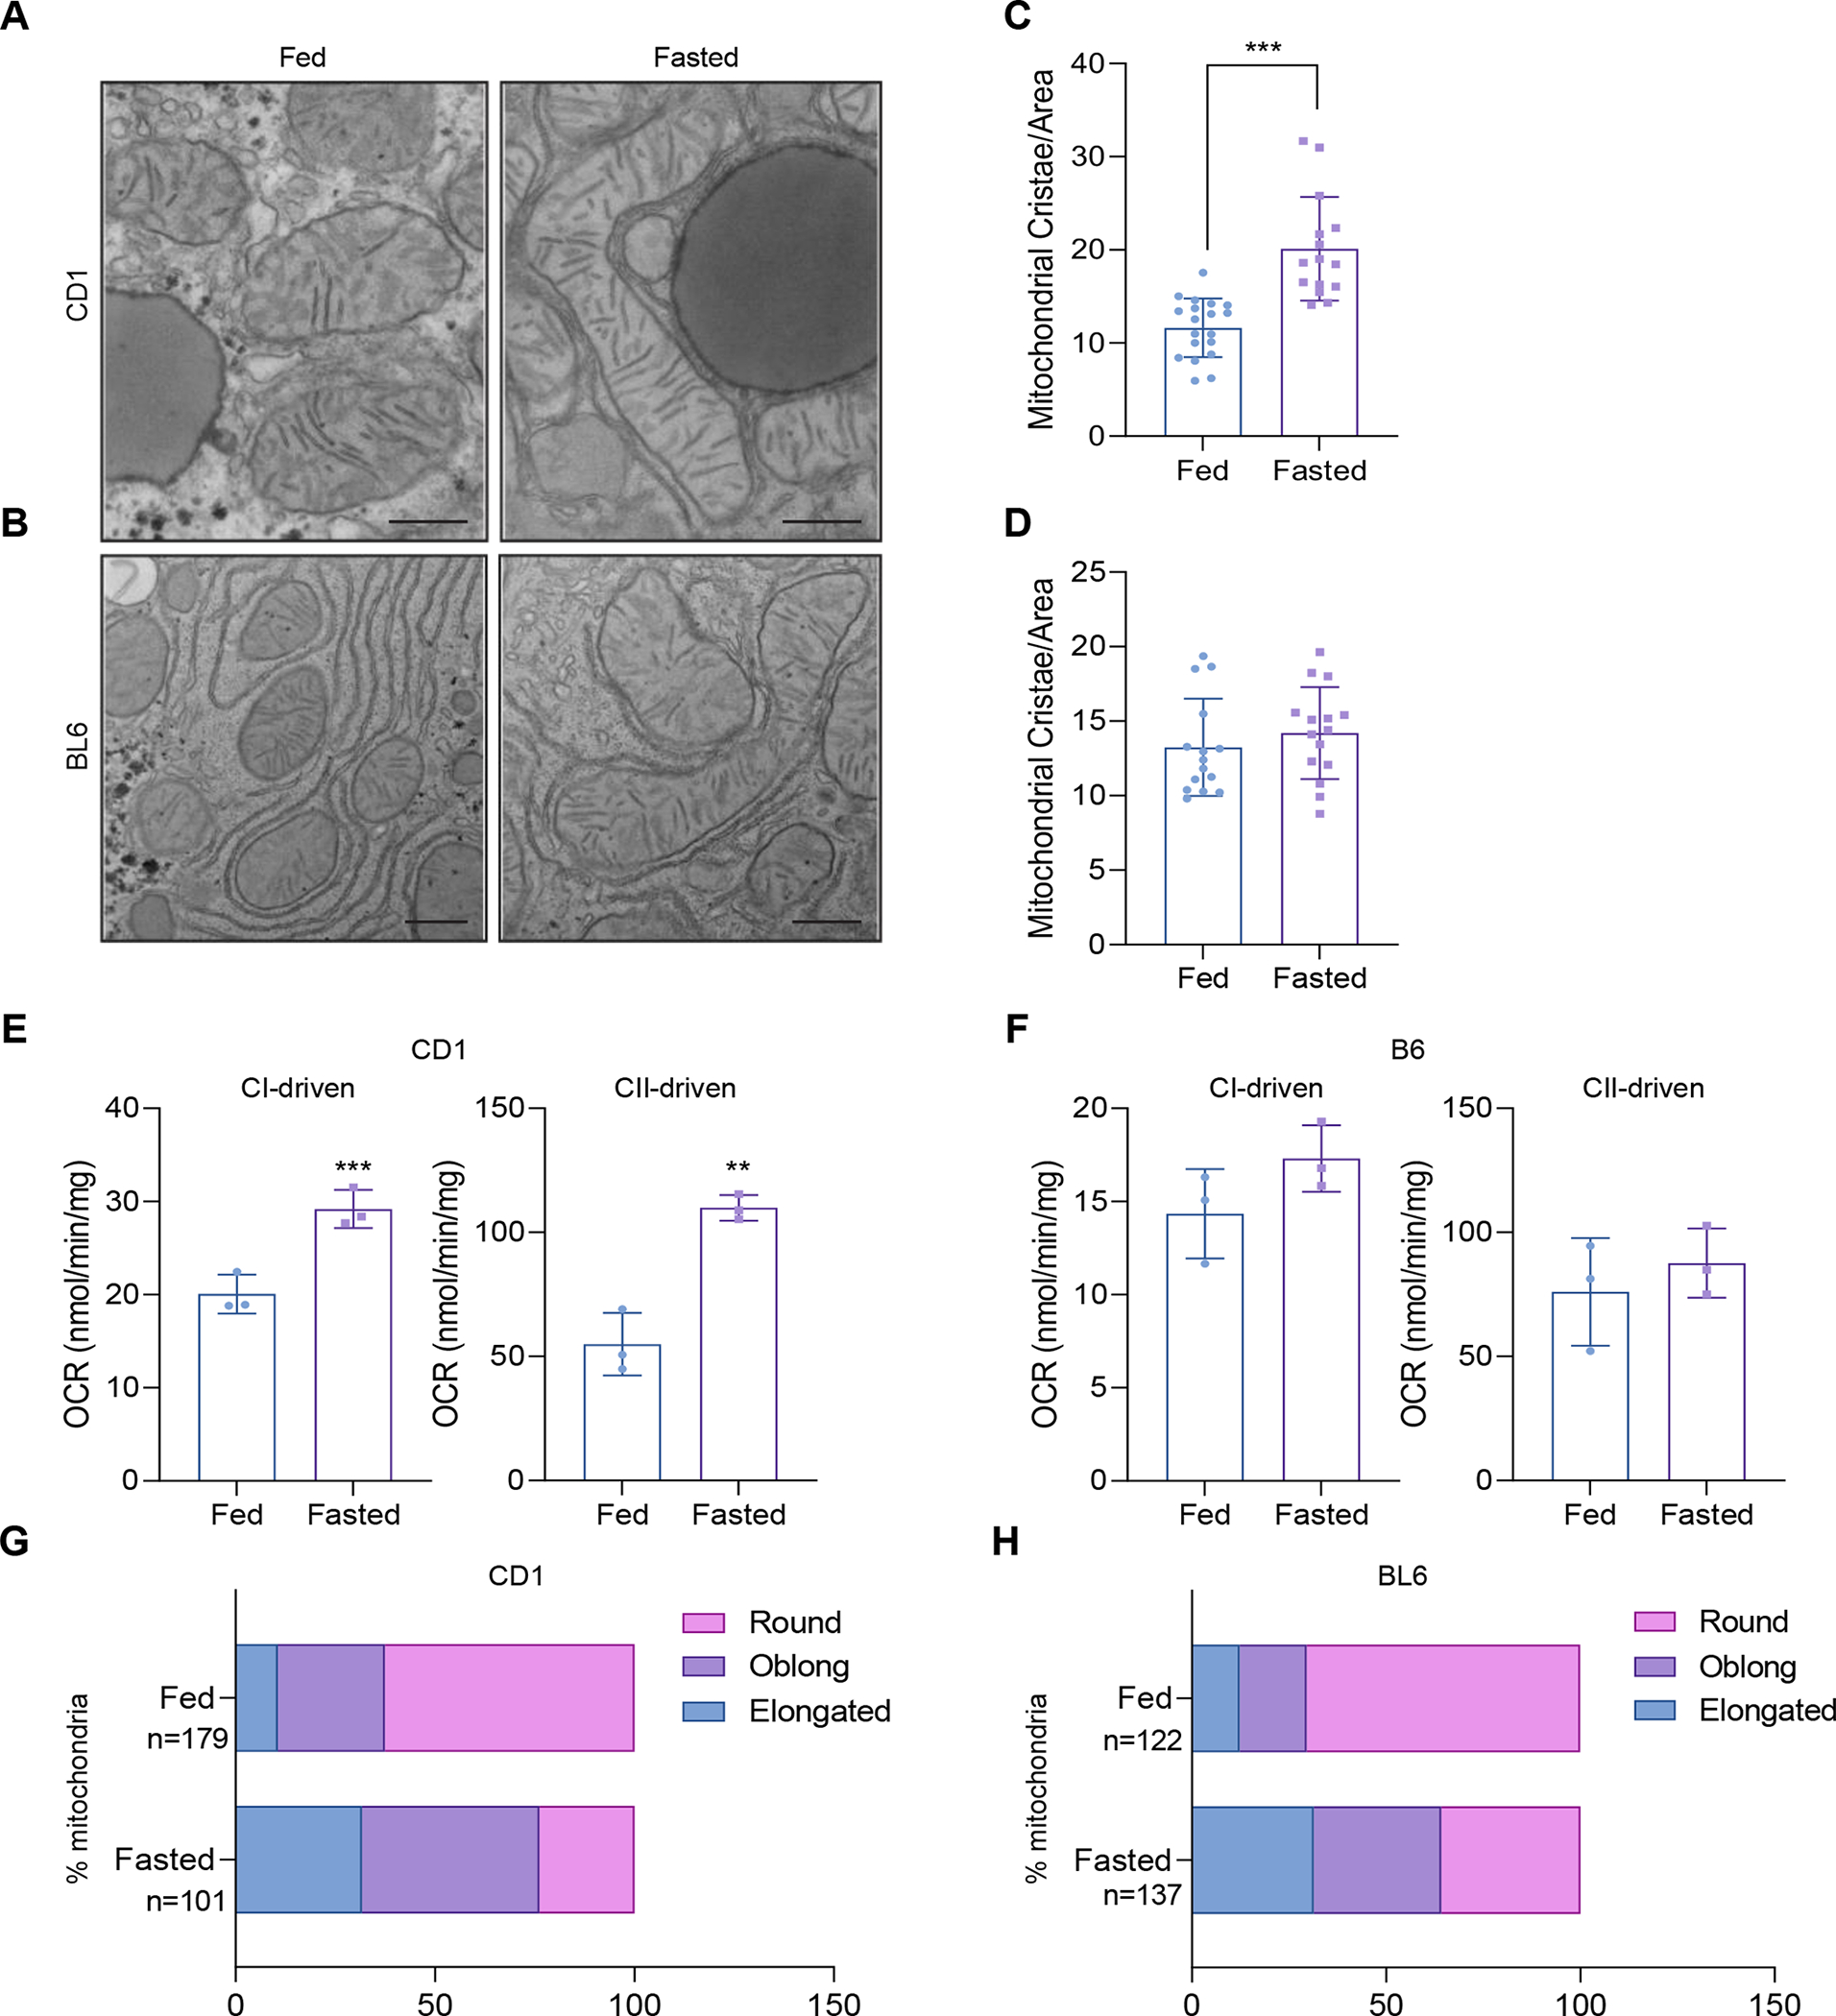
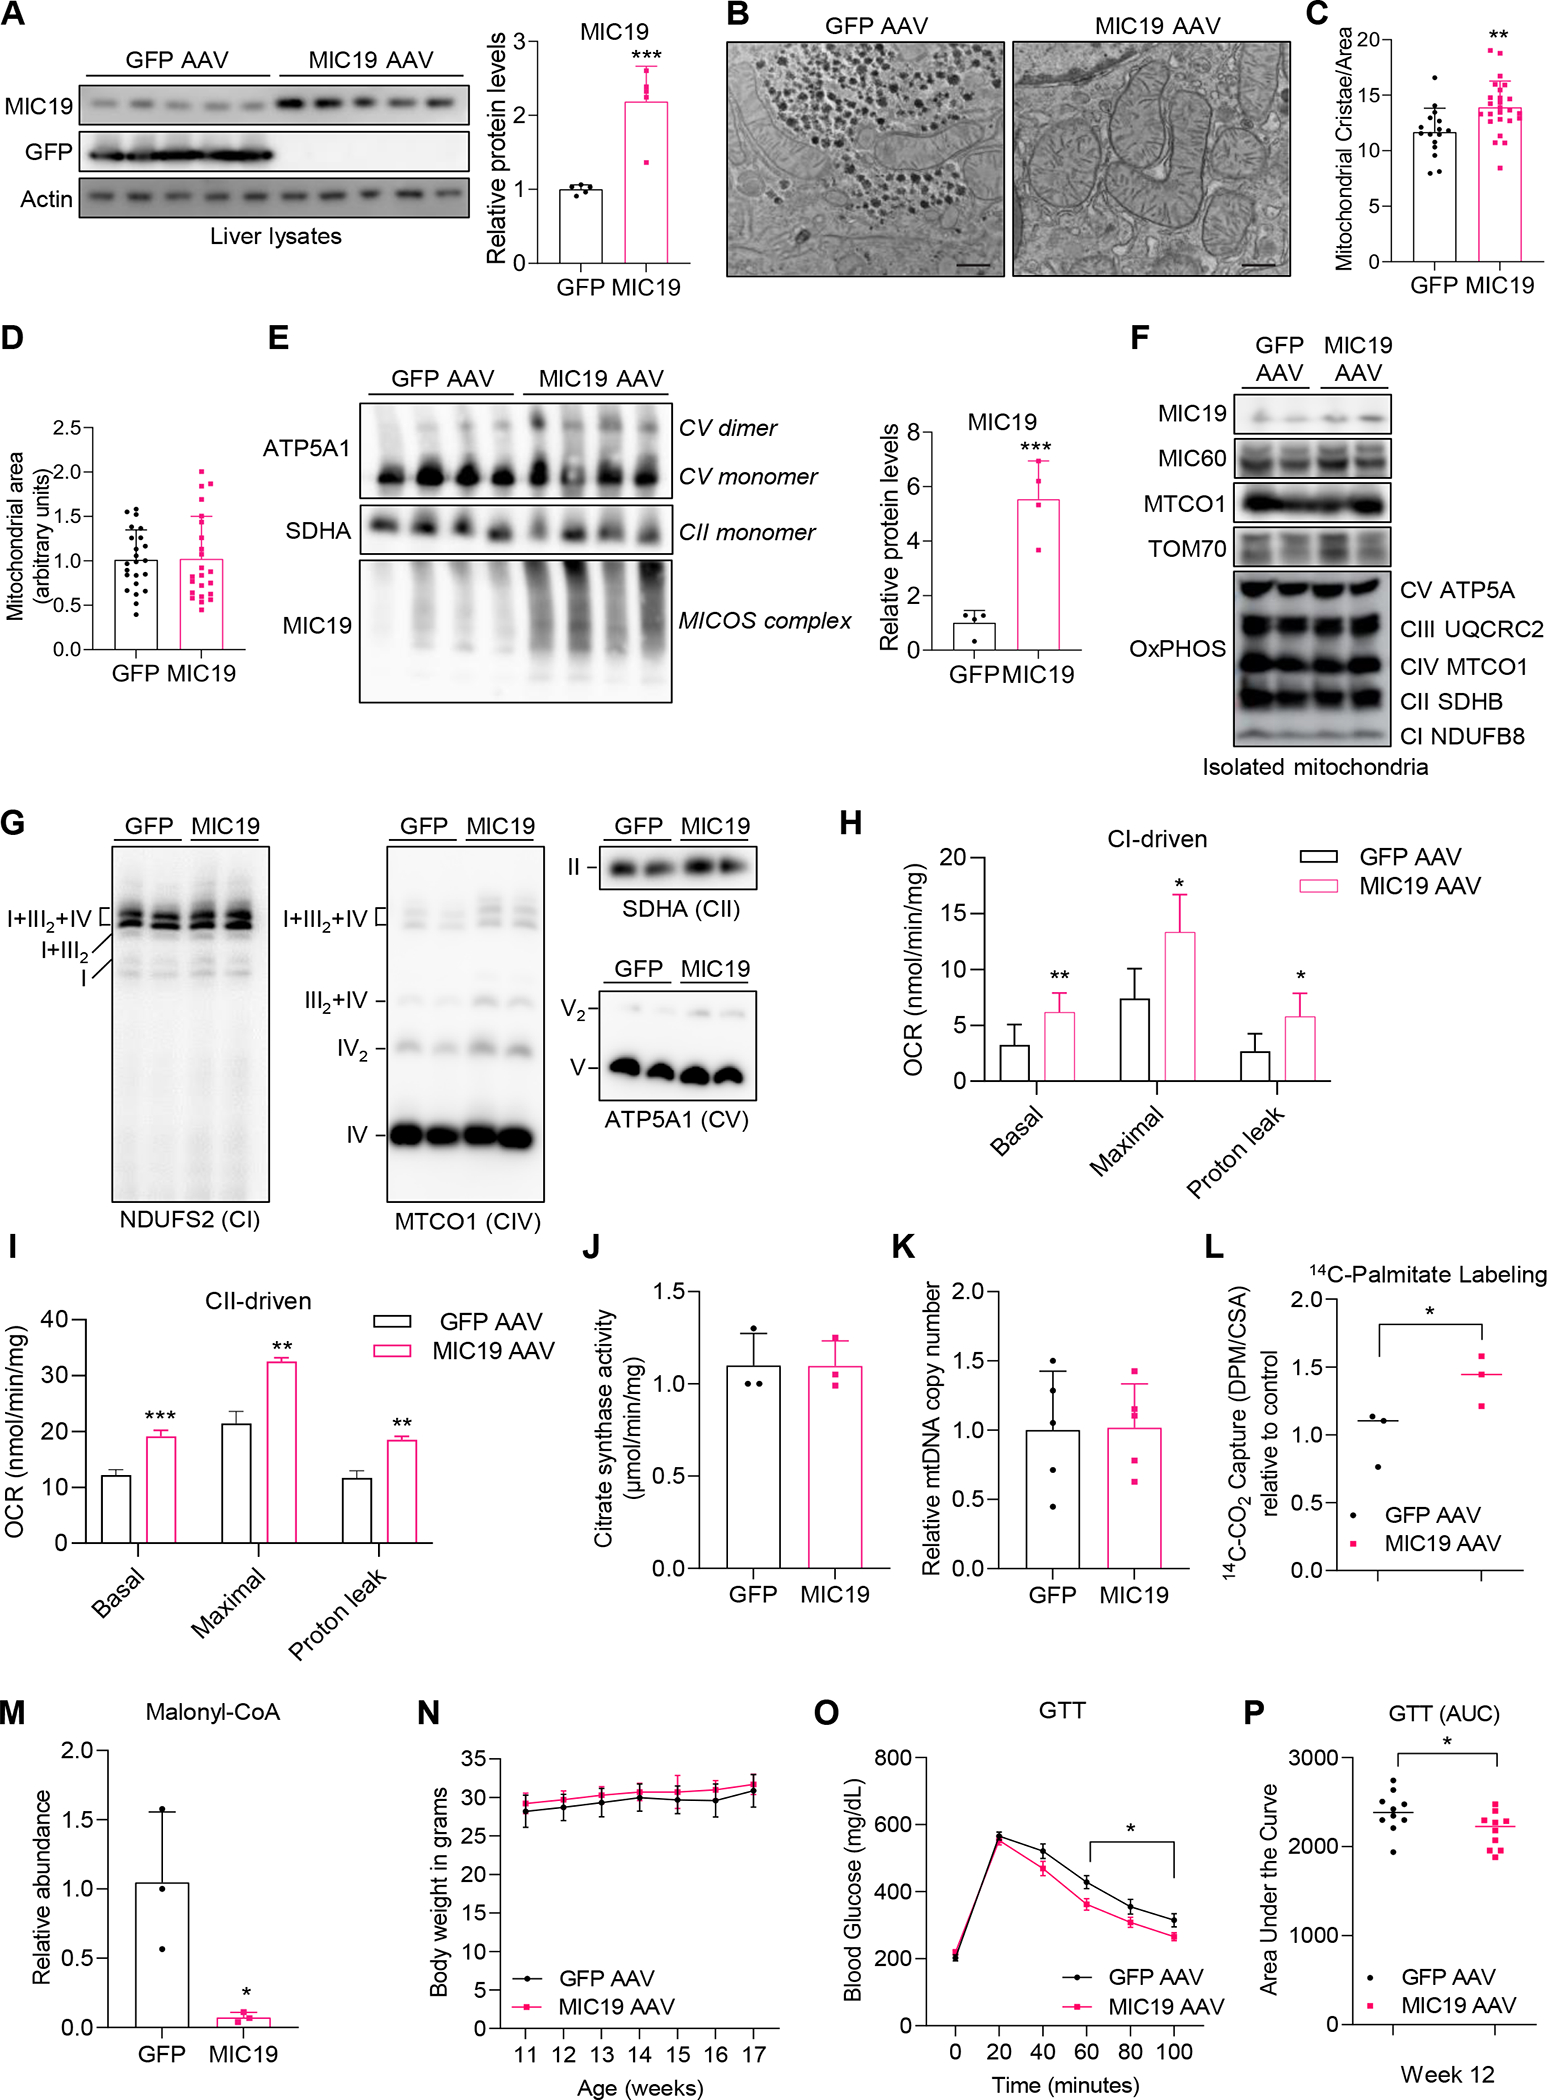
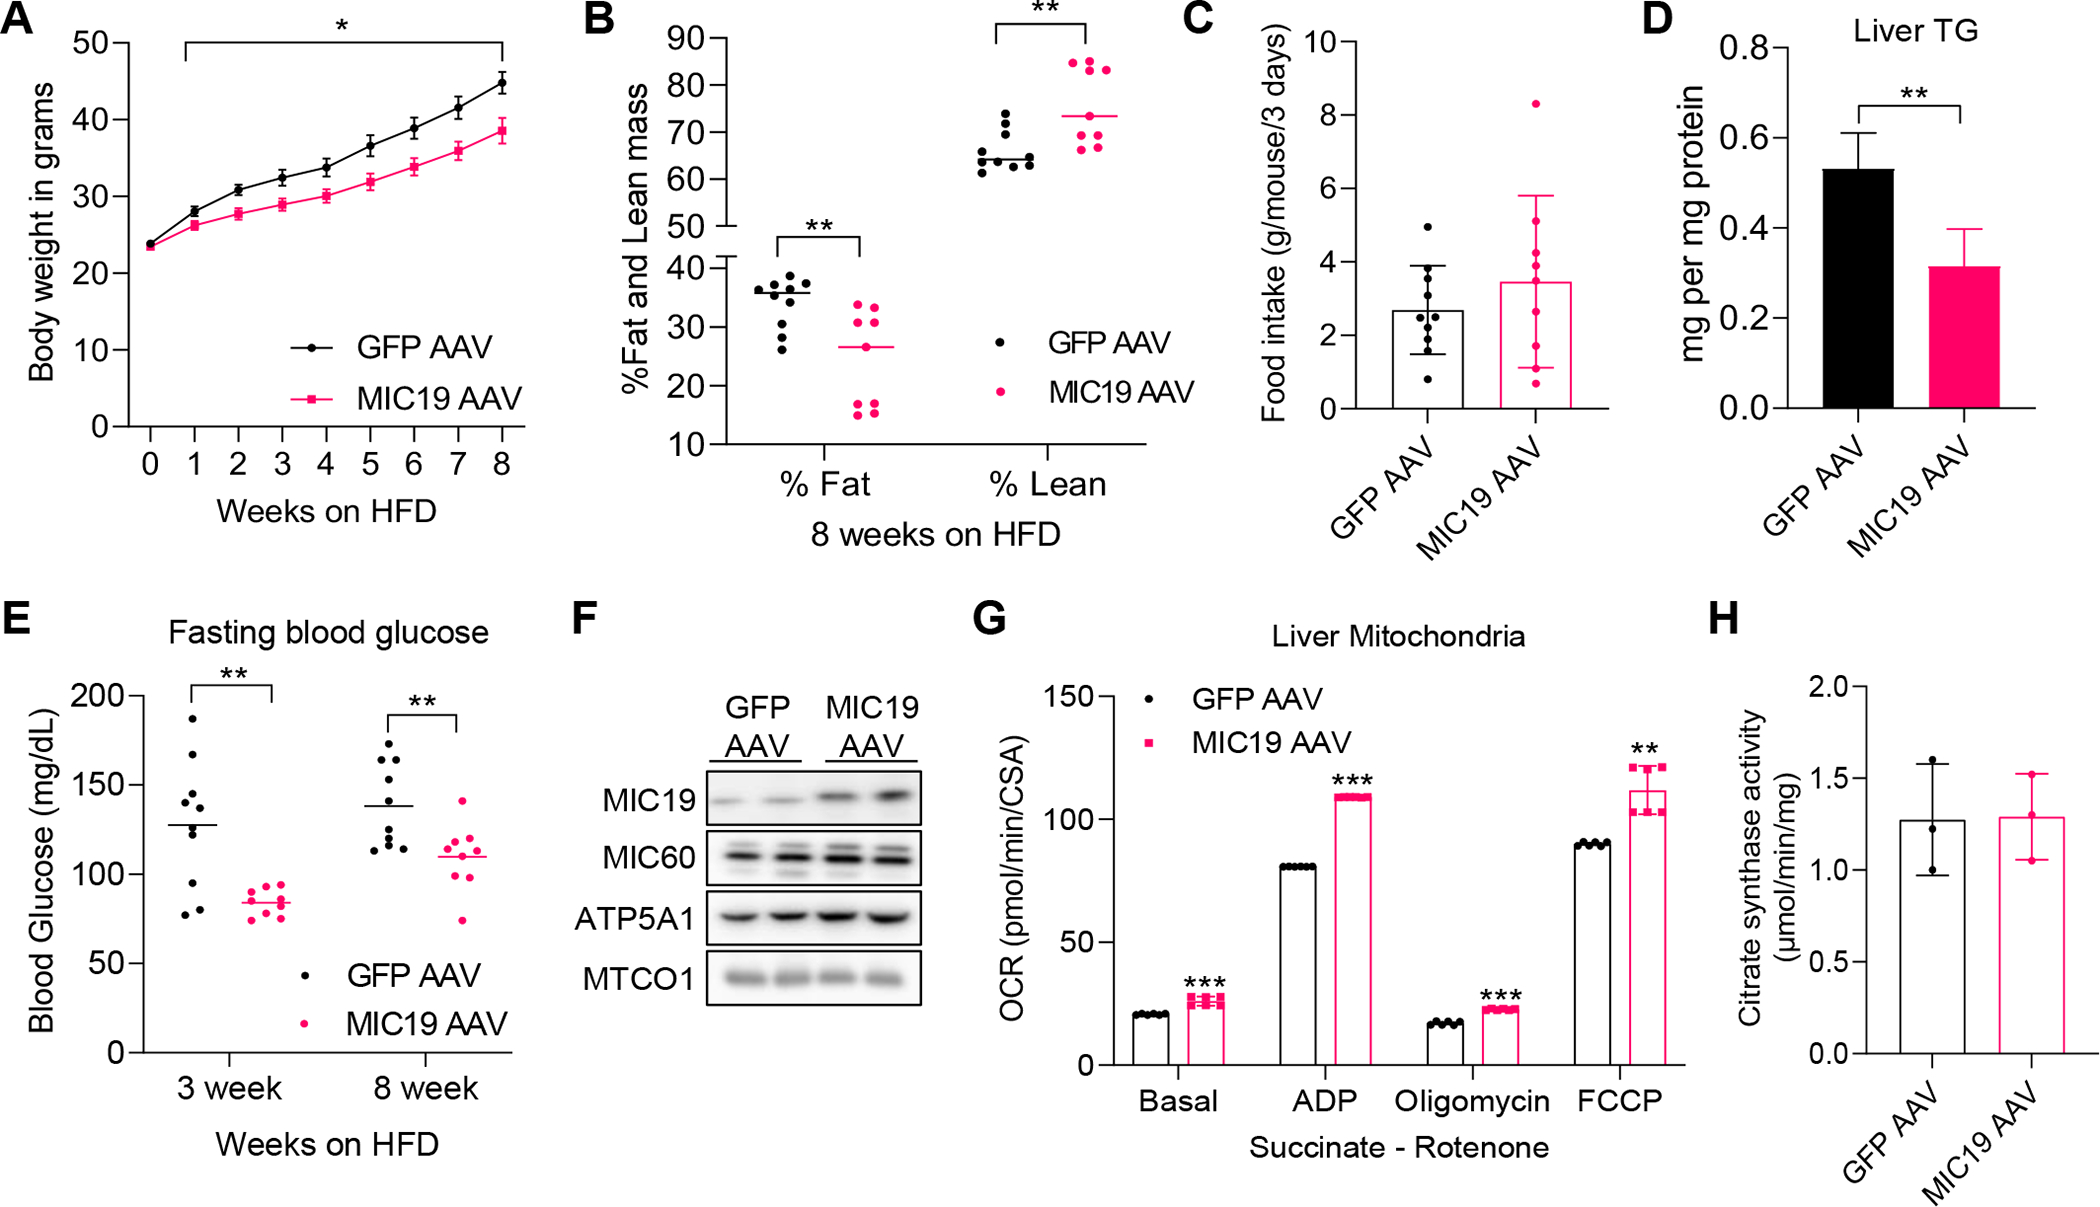
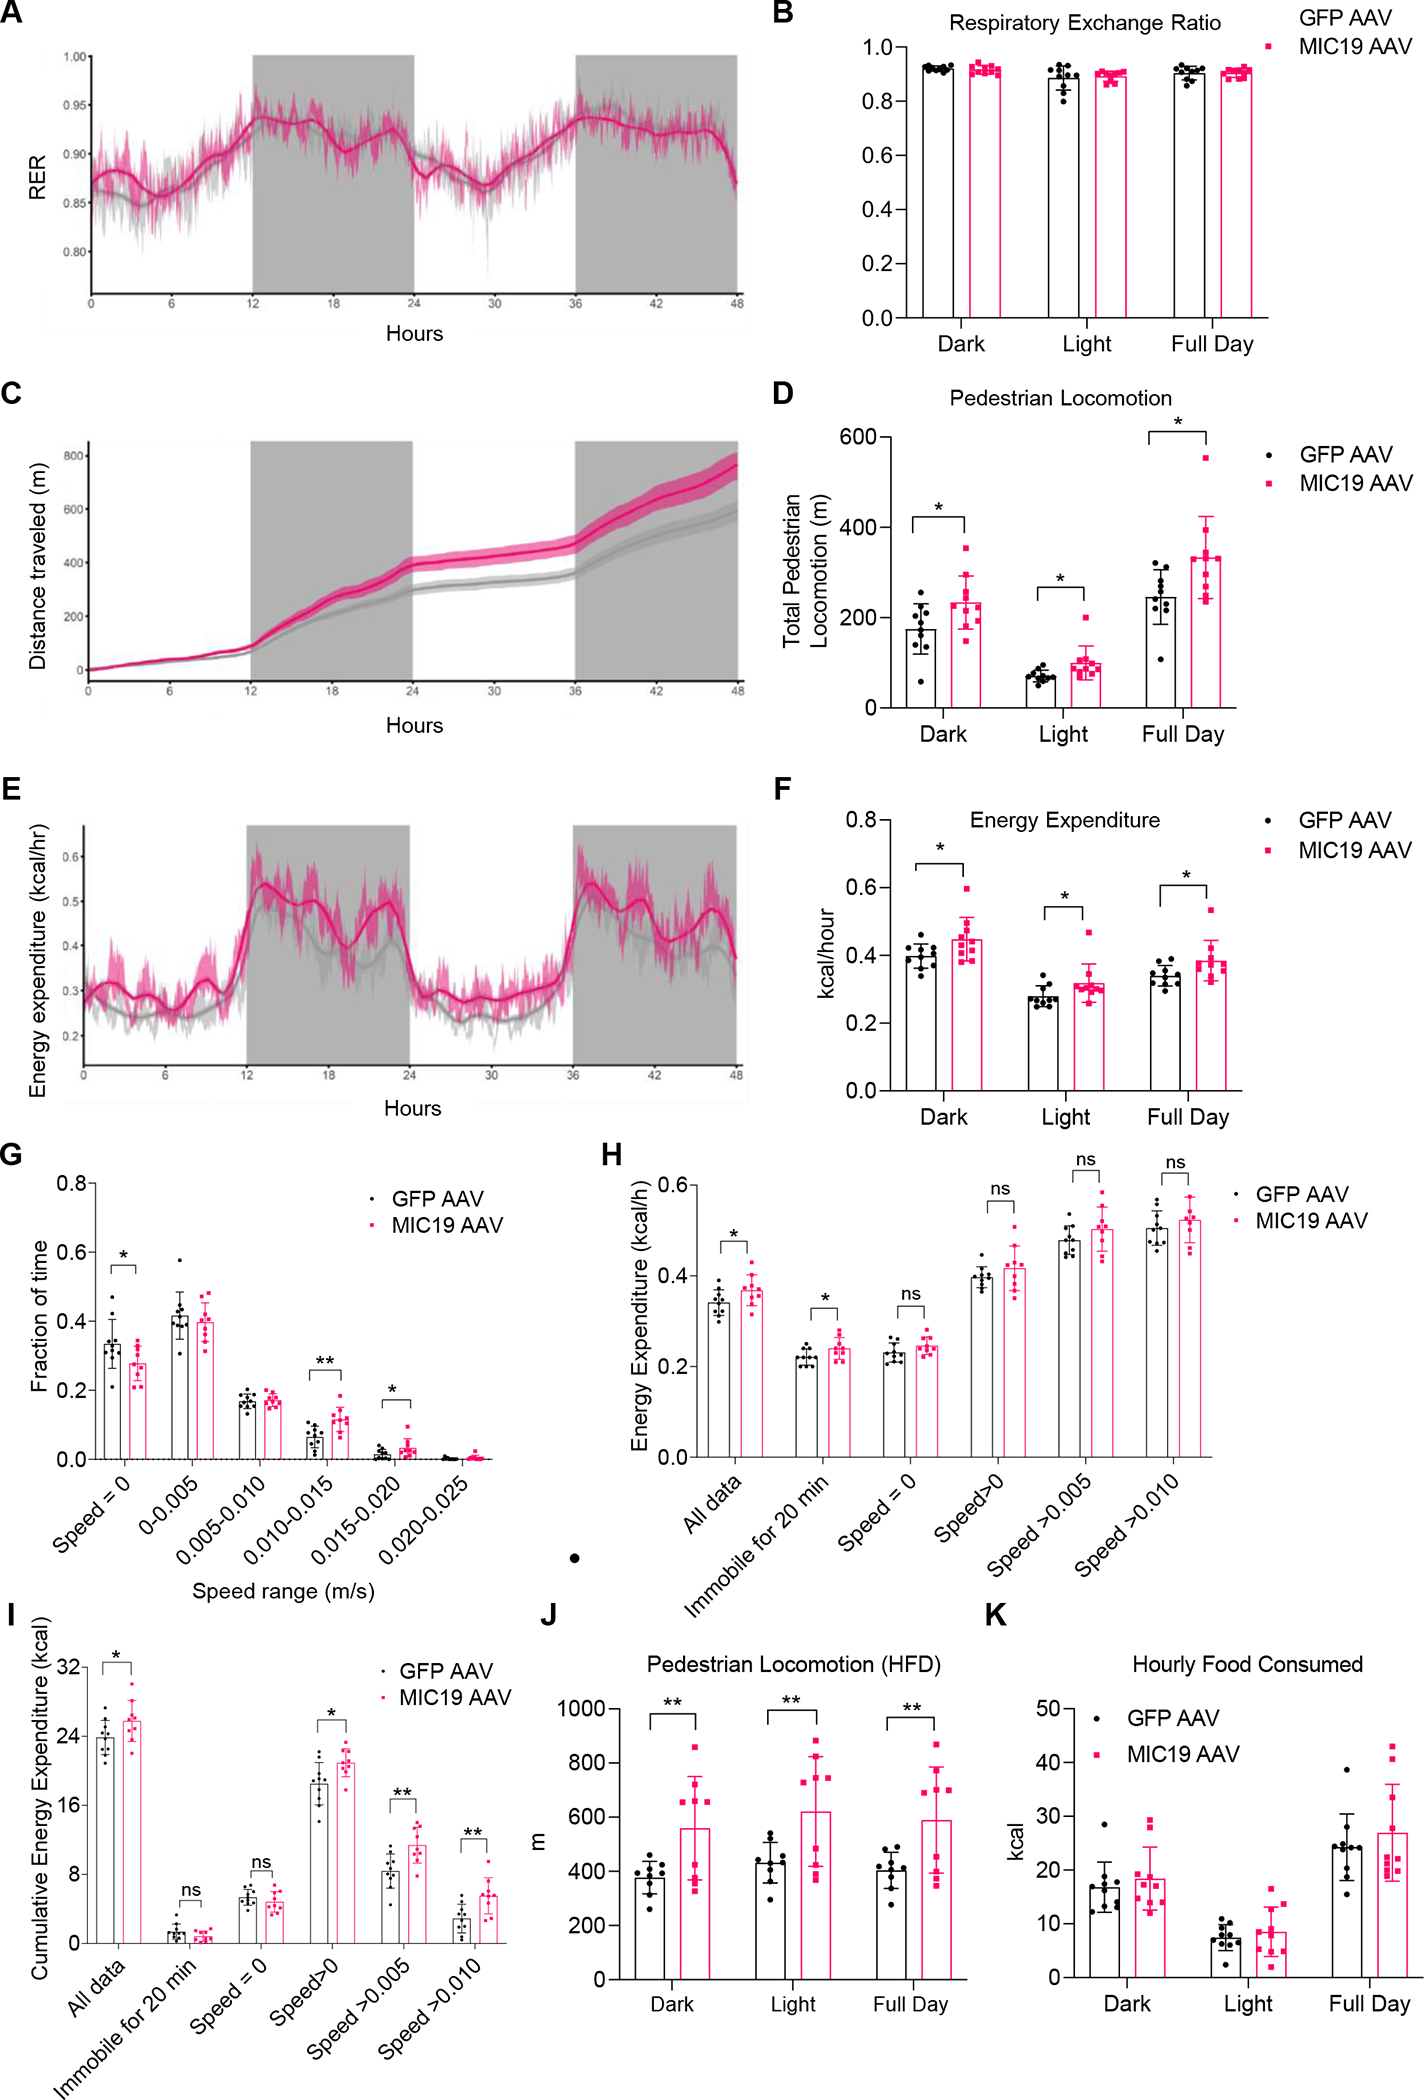
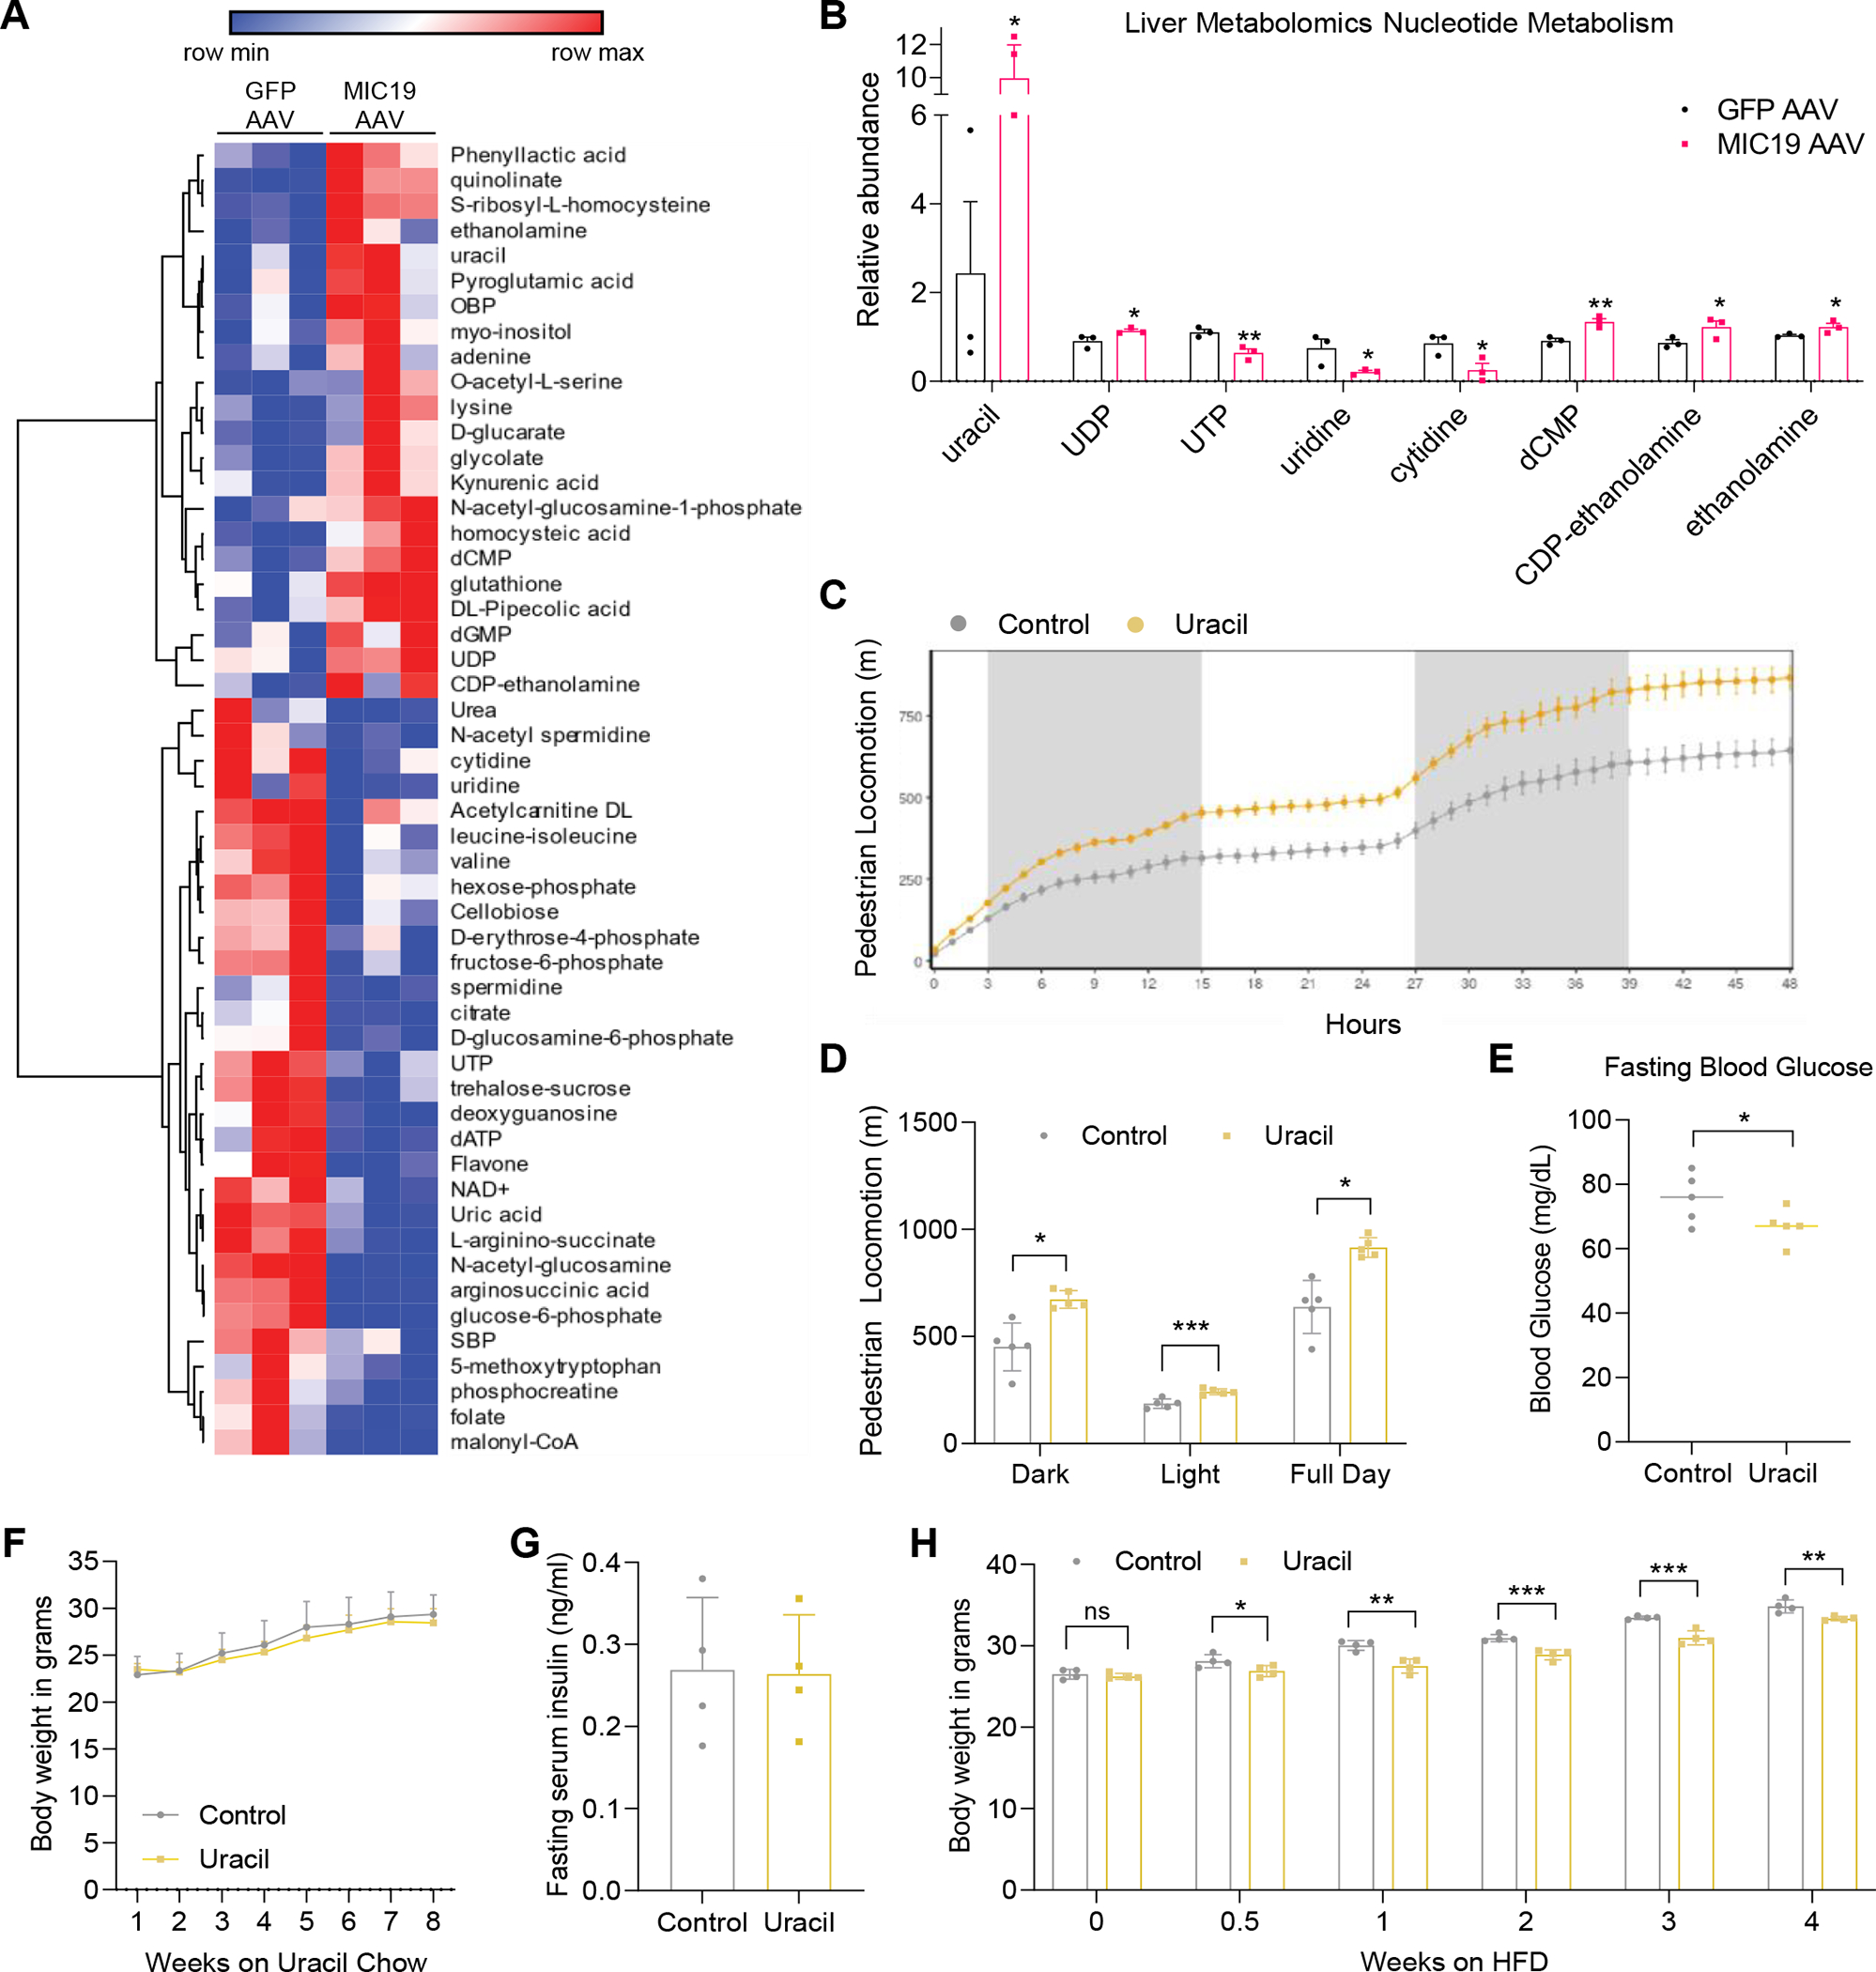
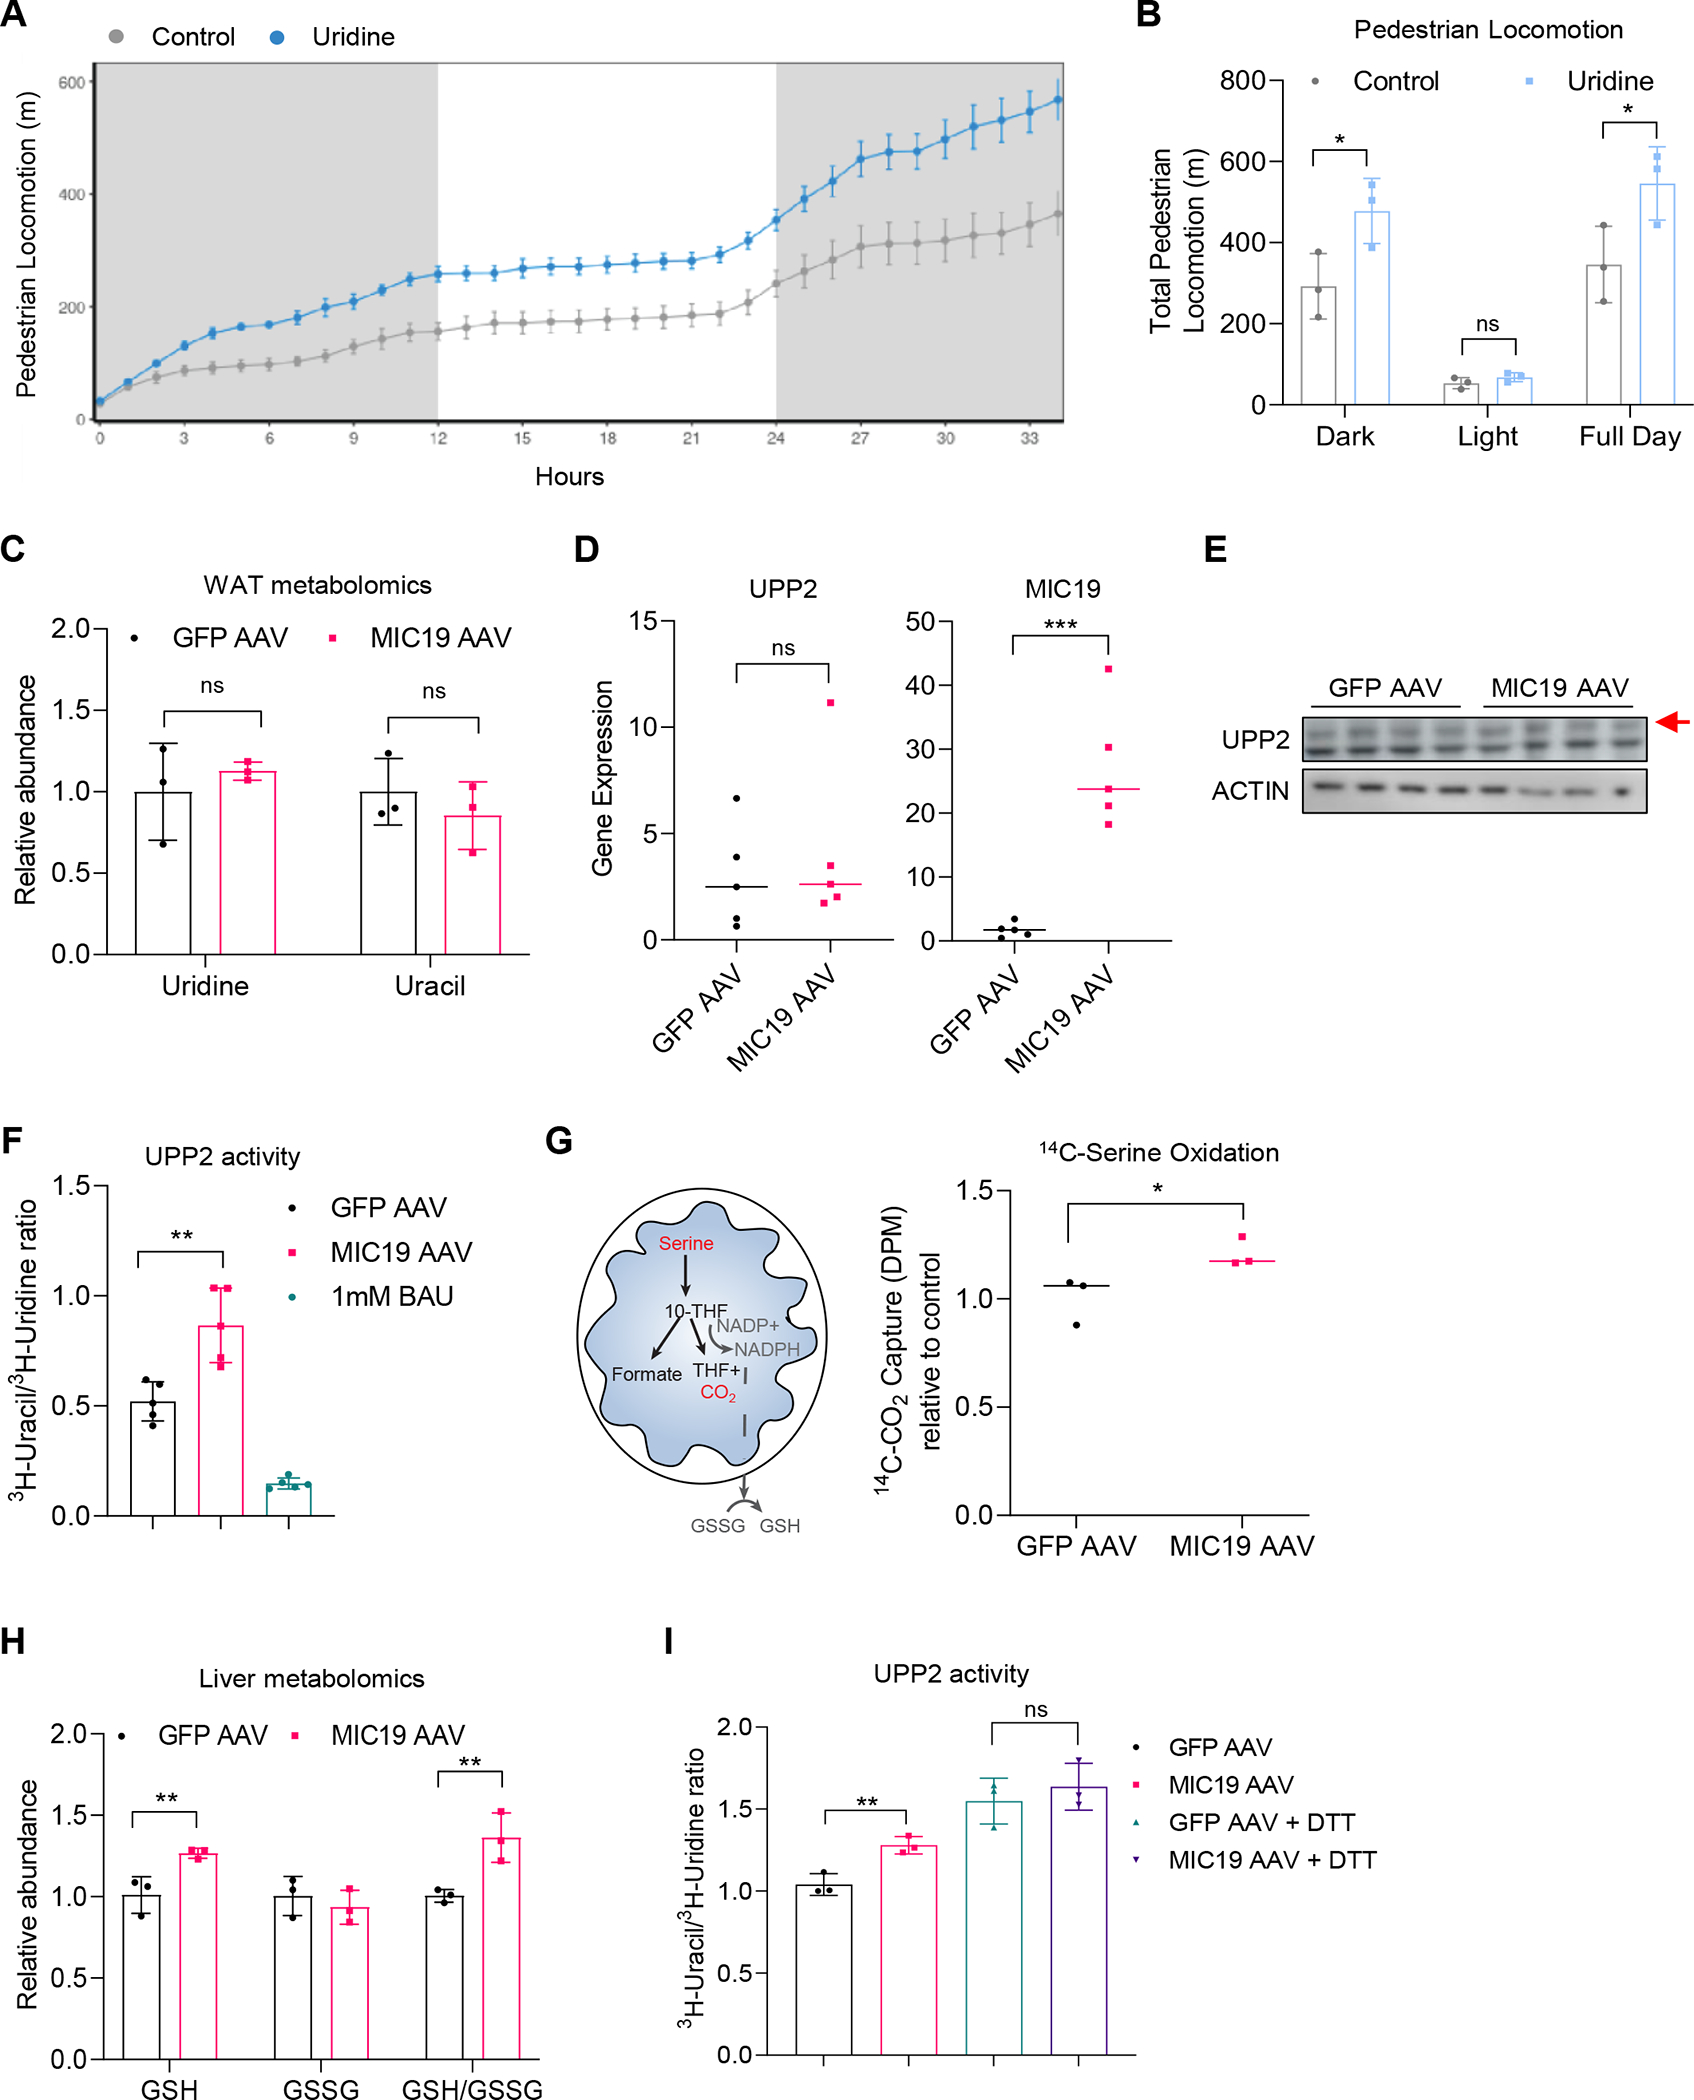
Liver mitochondria undergo architectural remodeling that maintains energy homeostasis in response to feeding and fasting. However, the specific components and molecular mechanisms driving these changes and their impact on energy metabolism remain unclear. Through comparative mouse proteomics, we found that fasting induces strain-specific mitochondrial cristae formation in the liver by upregulating MIC19, a subunit of the MICOS complex. Enforced MIC19 expression in the liver promotes cristae formation, mitochondrial respiration, and fatty acid oxidation while suppressing gluconeogenesis. Mice overexpressing hepatic MIC19 show resistance to diet-induced obesity and improved glucose homeostasis. Interestingly, MIC19 overexpressing mice exhibit elevated energy expenditure and increased pedestrian locomotion. Metabolite profiling revealed that uracil accumulates in the livers of these mice due to increased uridine phosphorylase UPP2 activity. Furthermore, uracil-supplemented diet increases locomotion in wild-type mice. Thus, MIC19-induced mitochondrial cristae formation in the liver increases uracil as a signal to promote locomotion, with protective effects against diet-induced obesity.

Keywords: brisk walking; diabetes; fatty liver; mitochondrial cristae; obesity; uracil.


Conflict of interest statement

Declaration of interests B.M. is employed by Elsevier as a Scientific Editor at Cell Press. The work reported in the paper was completed before Dr. Mutlu joined Cell Press, and Dr. Mutlu was not involved in the peer-review process or the decision to accept the paper for publication.

Figures

Figure 1.
Figure 1.. Fasting remodels the mitochondrial proteome in CD-1 livers, but not BL6.
(A and B) Volcano plots showing changes in the mitochondrial proteome in 24 hour fasted vs. ad-libitum fed mice in CD-1 and BL6. n=3 for CD-1 and n=2 for BL6 in separate experiments. Dotted lines denote the significance cut-off (p<0.05). (C and D) GO Term Analysis of upregulated genes in CD-1 and BL6 liver mitochondria. (E) Heatmap showing fold change increase in specific subunits of the respiratory chain complexes I-V upon fasting in the CD-1 strain (p<0.05). (F) Box plots extending from minimum to maximum values that show fold change in mitochondrial cristae proteins including OPA1 and MICOS complex components. (G) Heatmap showing fold change increase in MIA40 substrates. (H) Western blot validating MIC19 protein levels in isolated pure mitochondria of CD-1 and BL6 liver under fed or fasted conditions. (I) Mitochondrial protein levels in the liver mitochondria of CD-1 upon fasting (n=3). (J) Blue-Native Polyacrylamide Gel Electrophoresis blot showing more MIC19 incorporated into the MICOS complex upon 24 h fasting in the CD-1 strain. Lower band is around 700kDa, representing the MICOS complex and the upper band represents mitochondrial intermembrane bridging (MIB) supercomplex (n=3). (K) The ratio of MIC19 incorporated into MICOS complex to individual MIC19 protein calculated based on (I) and (J). (L) In vitro protein import of MIC19 using isolated liver mitochondria from CD-1 mice under fed or fasted conditions (n=3). Data represented as mean±SD (K, L). *p< 0.05, **p< 0.01 by Student’s t-test (A, B, E-G, K, L). n represents the number of biological replicates. See also Figure S1.
Figure 2.
Figure 2.. Fasting promotes mitochondrial cristae formation and mitochondrial respiration in CD-1 livers, but not BL6.
(A and B) Transmission Electron Microscopy (TEM) analysis of liver mitochondria in 24 hour fasted vs. ad libitum fed CD-1 and BL6 (n=2 mice, >5 section of images per animal). (C and D) Number of mitochondrial cristae per mitochondrial area (a.u.) in fasted vs. fed animals in CD-1 and BL6 livers (n>14 mitochondria per group). (E and F) Measurement of complex I- and complex II-linked oxygen consumption rate (OCR) in isolated liver mitochondria from fasted vs. fed CD-1 and BL6 (n=3). (G and H) Percentage of mitochondria that are round, oblong, or elongated in fasted vs. fed animals in TEM images of CD-1 and BL6 mouse livers. Number of mitochondria analyzed are denoted in the figure. Data represented as mean±SD (C-F). **p< 0.01, ***p< 0.001 by Student’s t-test (C-F). n represents the number of biological replicates.
Figure 3.
Figure 3.. Overexpression of MIC19 in BL6 livers promotes mitochondrial cristae formation and respiration.
(A) Western blot showing overexpression of GFP or MIC19 in the livers of ad libitum fed BL6. (B-C) TEM images of GFP AAV vs. MIC19 AAV mouse livers (n=2, >5 section of liver images per animal). (D) The mitochondrial area (a.u.) in GFP vs. MIC19 AAV liver. (E) Blue-Native Polyacrylamide Gel Electrophoresis showing the MICOS complex, monomers and dimers of CV (ATP5A1) and CII (SDHA) in GFP vs. MIC19 AAV liver mitochondria (n=4). (F) Western blot showing expression of mitochondrial proteins (n=2). (G) Respiratory complex assemblies in the liver mitochondria isolated from GFP or MIC19 AAV mice (n=2). (H and I) Complex I- and Complex II-dependent OCR measured by Seahorse XF analyzer in isolated mitochondria from GFP AAV vs. MIC19 AAV livers (n=3). (J) Citrate synthase activity (CSA) in the mitochondria isolated from GFP AAV vs. MIC19 AAV liver. (K) Relative mitochondrial DNA content assessed by 16s rRNA levels normalized to HK2 mRNA level. (L) 14C-palmitate oxidation in liver homogenates from GFP vs. MIC19 AAV livers normalized to CSA, shown relative to GFP AAV (n=3). (M) Relative abundance of malonyl-CoA in the liver of GFP vs. MIC19 AAV mice (n=3). (N) Body weight of GFP AAV vs. MIC19 AAV animals on regular chow at weeks 11–17 (n=10). (O) Blood glucose levels during a Glucose Tolerance Test (GTT) in GFP vs. MIC19 AAV animals (n=10). Data represented as mean±SEM. (P) Area Under the Curve (AUC) for the GTT comparing GFP vs. MIC19 animals. Data represented as mean±SD (A, C-E, H-N). *p< 0.05, **p< 0.01, ***p< 0.001 by Student’s t-test (A, C-E, H-M, O, P). n represents the number of biological replicates. See also Figures S2 and S3.
Figure 4.
Figure 4.. MIC19 overexpression in the liver has protective effects on an HFD.
(A) Body weight of GFP (n=10) vs. MIC19 (n=9) AAV animals on an HFD. 6-week-old BL6 animals were administered GFP or MIC19 AAV via the tail vein and put on an HFD at 9 week-old. Data represented as mean±SEM. (B) Fat and lean mass determined by Magnetic Resonance Imaging (MRI) imaging after 8 weeks on an HFD. (C) Food intake in grams per mouse measured in metabolic cages across 3 days in GFP vs. MIC19 AAV animals. (D) Liver triglyceride levels in GFP vs. MIC19 AAV animals on an HFD (n=4). (E) Fasting blood glucose in GFP (n=10) vs. MIC19 (n=9) AAV animals after HFD. (F) Western blot showing expression of mitochondrial proteins in samples used to measure mitochondrial respiration (n=2). (G) OCR measured by Oroboros in isolated mitochondria from GFP AAV vs. MIC19 AAV livers (n=6). OCR was normalized to CSA. (H) CSA in the mitochondria isolated from HFD-fed GFP AAV vs. MIC19 AAV liver (n=3). Data represented as mean±SD (C, G, H). *p< 0.05, **p< 0.01, ***p< 0.001 by Student’s t-test (A-E, G, H). n represents the number of biological replicates.
Figure 5.
Figure 5.. Animals that overexpress MIC19 in the liver have increased pedestrian locomotion.
Metabolic parameters across light and dark cycles for GFP vs. MIC19 AAV mice at 30°C. (A-F) Respiratory Exchange Ratio (RER), cumulative pedestrian locomotion, and energy expenditure (n=10). (G-I) Fraction of time spent at certain speeds, mean energy expenditure at certain speeds, and cumulative energy expenditure at certain speeds (m/s). n=10 for GFP and n=9 for MIC19 AAV mice. (J) Pedestrian locomotion in GFP vs. MIC19 AAV mice with a body weight difference on an HFD (n=9). (K) Hourly Food Consumed in kcal (n=10). Data represented as mean±SD (B, D, F-K) or as mean±SEM (A, C, E). *p< 0.05, **p< 0.01 by Student’s t-test (B, D, F-K). n represents the number of biological replicates. See also Figure S4.
Figure 6.
Figure 6.. Uracil accumulates in MIC19 AAV livers and promotes locomotion.
(A) Heatmap showing metabolites that change significantly between GFP vs. MIC19 AAV livers (p<0.05, n=3). (B) Relative abundance of pyrimidine nucleotides in GFP vs. MIC19 AAV livers. (C and D) Pedestrian locomotion in mice supplemented with uracil (0.1% in drinking water, n=5). (E-G) Fasting blood glucose, body weight, and fasting serum insulin level of mice on a standard chow diet with or without 1% uracil supplementation (n=4~5). (H) Body weight of mice on an HFD supplemented with uracil (0.1% in drinking water, n=4). Data represented as mean±SD (D-H) or as mean±SEM (B, C). *p< 0.05, **p< 0.01, ***p< 0.001 by Student’s t-test (A, B, D-H). n represents the number of biological replicates. See also Figure S5.
Figure 7.
Figure 7.. Conversion of uridine to uracil is increased in MIC19 AAV animals in a redox sensitive manner.
(A and B) Pedestrian locomotion in mice supplemented with uridine (3% drinking water, n=3 mice). (C) Relative abundance of uridine and uracil in iWAT in GFP vs. MIC19 AAV mice from a metabolomics experiment (n=3). (D) UPP2 and MIC19 mRNA expression levels in GFP vs. MIC19 AAV livers (n=5). (E) Western blots showing UPP2 protein levels in GFP vs. MIC19 AAV livers. Red arrow denotes the size for UPP2. (F) Ratio of 3H-uracil to 3H-uridine as a measure for UPP2 activity in GFP vs. MIC19 AAV liver lysates. Treatment of GFP AAV lysates with 1 mM BAU inhibits UPP2 activity (n=5). (G) Left: Cartoon depicting the oxidation of serine through the mitochondrial one carbon pathway and its connection to glutathione. Right: 14C-serine oxidation in liver homogenates from GFP vs. MIC19 AAV livers normalized to CSA, shown relative to GFP AAV (n=3). (H) Reduced and oxidized glutathione levels in GFP vs. MIC19 AAV livers (n=3). (I) UPP2 activity in GFP vs. MIC19 AAV liver lysates with or without 10 mM DTT treatment (n=3). Data represented as mean±SD (B, C, F, H, I) or as mean±SEM (A). *p< 0.05, **p< 0.01, ***p< 0.001 by Student’s t-test (B-D, F-I). n represents the number of biological replicates. See also Figure S6.

References

    1. Heymsfield SB, and Wadden TA (2017). Mechanisms, Pathophysiology, and Management of Obesity. N Engl J Med 376, 254–266. 10.1056/NEJMra1514009. - DOI - PubMed
    1. Roden M, and Shulman GI (2019). The integrative biology of type 2 diabetes. Nature 576, 51–60. 10.1038/s41586-019-1797-8. - DOI - PubMed
    1. Bence KK, and Birnbaum MJ (2021). Metabolic drivers of non-alcoholic fatty liver disease. Mol Metab 50, 101143. 10.1016/j.molmet.2020.101143. - DOI - PMC - PubMed
    1. Chalasani N, Younossi Z, Lavine JE, Charlton M, Cusi K, Rinella M, Harrison SA, Brunt EM, and Sanyal AJ (2018). The diagnosis and management of nonalcoholic fatty liver disease: Practice guidance from the American Association for the Study of Liver Diseases. Hepatology 67, 328–357. 10.1002/hep.29367. - DOI - PubMed
    1. Sheka AC, Adeyi O, Thompson J, Hameed B, Crawford PA, and Ikramuddin S (2020). Nonalcoholic Steatohepatitis: A Review. JAMA 323, 1175–1183. 10.1001/jama.2020.2298. - DOI - PubMed

Publication types

LinkOut - more resources