. 2023 Oct 4;111(19):3028-3040.e6.
doi: 10.1016/j.neuron.2023.06.017. Epub 2023 Jul 19.

Excitatory neuron-specific suppression of the integrated stress response contributes to autism-related phenotypes in fragile X syndrome

Affiliations

Excitatory neuron-specific suppression of the integrated stress response contributes to autism-related phenotypes in fragile X syndrome

Mehdi Hooshmandi et al. Neuron. .

Abstract

Dysregulation of protein synthesis is one of the key mechanisms underlying autism spectrum disorder (ASD). However, the role of a major pathway controlling protein synthesis, the integrated stress response (ISR), in ASD remains poorly understood. Here, we demonstrate that the main arm of the ISR, eIF2α phosphorylation (p-eIF2α), is suppressed in excitatory, but not inhibitory, neurons in a mouse model of fragile X syndrome (FXS; Fmr1-/y). We further show that the decrease in p-eIF2α is mediated via activation of mTORC1. Genetic reduction of p-eIF2α only in excitatory neurons is sufficient to increase general protein synthesis and cause autism-like behavior. In Fmr1-/y mice, restoration of p-eIF2α solely in excitatory neurons reverses elevated protein synthesis and rescues autism-related phenotypes. Thus, we reveal a previously unknown causal relationship between excitatory neuron-specific translational control via the ISR pathway, general protein synthesis, and core phenotypes reminiscent of autism in a mouse model of FXS.

Keywords: autism; fragile X syndrome; integrated stress response; mRNA translation.


Conflict of interest statement

Declaration of interests M.C.-M. is a member of Neuron’s advisory board and a shareholder of Altos Labs and Mikrovia.

Figures
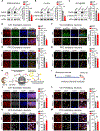
Figure 1.
Figure 1.. Fmr1−/y mice show a reduction in p-eIF2α and an increase in global protein synthesis in mature excitatory but not inhibitory neurons.
(A-C) Representative immunoblotting (left) and quantification (right) showing reduced p-eIF2α in Fmr1−/y mice (n = 5) compared with WT mice (n = 4) in hippocampus (A, WT versus Fmr1−/y, t = 8.818, p < 0.0001), cortex (B, WT versus Fmr1−/y, t = 3.681, p = 0.0078), and amygdala (C, WT versus Fmr1−/y, t = 3.790, p = 0.0068). (D-G) Immunofluorescent labelling against p-eIF2α (green) in mature excitatory (CaMK2α-positive, red) and inhibitory (GAD67-positive, red) neurons reveals reduced p-eIF2α in Fmr1−/y (n = 6) compared with WT animals (n = 6) in excitatory neurons in CA1 (D, WT versus Fmr1−/y, t = 5.119, p < 0.0005) and prefrontal cortex (PFC) (E, WT versus Fmr1−/y, t = 4.084, p < 0.0022), but not inhibitory neurons in CA1 (F, WT versus Fmr1−/y, t = 0.444, p > 0.05) and prefrontal cortex (G, WT versus Fmr1−/y, t = 0.967, p > 0.05). (H) Schematic illustration of the fluorescence non-canonical amino acid tagging (FUNCAT) and (I) experimental design. AHA incorporation (grey), indicating the level of the nascent protein synthesis, is significantly higher in excitatory (CaMK2α-positive, red) neurons in CA1 (J, WT versus Fmr1−/y, t = 3.083, p = 0.0216) and PFC (K, WT versus Fmr1−/y, t = 2.78, p = 0.032) of Fmr1−/y (n = 4) compared with WT (n = 4) mice. No significant differences were found in AHA incorporation in inhibitory (GAD67-positive, red) neurons in CA1 (L, WT versus Fmr1−/y, t(6) = 0.283, p > 0.05) and PFC (M, WT versus Fmr1/y, t = 0.567, p > 0.05) of Fmr1−/y (n = 4) compared with WT (n = 4) mice. Yellow arrows mark inhibitory neurons. Each data point represents an individual animal. All data are presented as mean ± SEM. *p < 0.05, **p < 0.01, ***p < 0.001, ****p < 0.0001, and ns, not significant. Student’s t-test was performed for all the experiments. Scale bars, 25 μm. See also Figures S1, S2, S3, and Table S1.
Figure 2.
Figure 2.. A crosstalk between mTORC1 and eIF2α pathways in the brain of Fmr1−/y mice.
(A-D) Oral administration of NV-5138 results in elevated p-S6 and decrease in p-eIF2α in hippocampal and cortical lysates. (A and C) Brains were extracted from mice 2 hours after receiving vehicle (n = 4) or NV-5138 (160 mg/kg, n = 5)). NV-5138 causes an increase in p-S6/S6 and decrease in p-eIF2α in hippocampus (B, left, p-S6, t = 2.76, p = 0.0281; right, p-eIF2α, t = 3.211, p = 0.0148) and cortex (D, left, p-S6, t = 2.567, p = 0.0372; right, p-eIF2α, t = 4.039, p = 0.0049). Inhibition of mTORC1 with CCI-779 (7.5 mg/kg, daily over 3 days, i.p.) in the hippocampus (E) and cortex (G). (F) Quantifications of p-S6/S6 and p-eIF2α/eIF2α in hippocampus (F, p-S6/S6: F3, 28 = 228.4, p < 0.0001, WT + Vehicle versus Fmr1−/y + Vehicle, q28 = 5.734, p = 0.0019; WT + Vehicle versus WT + CCI-779, q28 = 23.17, p < 0.0001; Fmr1−/y + Vehicle versus Fmr1−/y + CCI-779, q28 = 28.54, p < 0.0001, n = 8 per group; p-eIF2α/eIF2α, F3, 28 = 17.84, p < 0.0001, WT + Vehicle versus Fmr1−/y + Vehicle, q28 = 8.838, p < 0.0001; Fmr1−/y + vehicle versus Fmr1−/y + CCI-779, q28 = 7.171, p = 0.0001). In cortex (H, p-S6/S6: F3, 28 = 57.32, p < 0.0001, WT + Vehicle versus Fmr1−/y + Vehicle, q28 = 4.582, p = 0.0153; WT + Vehicle versus WT + CCI-779, q28 = 10.58, p < 0.0001; Fmr1−/y + Vehicle versus Fmr1−/y + CCI-779, q28 = 14.83, p < 0.0001; p-eIF2α/eIF2α: F3, 28 = 16, p < 0.0001, WT + Vehicle versus Fmr1−/y + Vehicle, q28 = 8.082, p < 0.0001; Fmr1−/y + vehicle versus Fmr1−/y + CCI-779, q28 = 4.337, p = 0.0001. For E-H, n = 8 per group, one-way ANOVA followed by Tukey’s multiple comparisons post hoc test). No differences in S6 (hippocampus: F3, 28 = 1.002, p > 0.05 and cortex: F3, 28 = 1.033, p > 0.05) and eIF2α (hippocampus: F3, 28 = 1.652, p > 0.05 and cortex: F3, 28 = 0.1165, p > 0.05) were observed (One-way ANOVA). Each data point represents an individual animal. Data are presented as mean ± SEM. *p < 0.05, **p < 0.01, ****p < 0.0001, ns, not significant. See also Figures S4, S5, S6, and S7.
Figure 3.
Figure 3.. Mice with reduced phosphorylation of eIF2α in excitatory neurons exhibit autistic-like behaviors.
(A) Immunostaining of hippocampal sections from Eif2αS/A cKICamk2α mice shows a reduction in p-eIF2α in excitatory neurons (CaMK2α-positive, red) in CA1 area (control (n = 5) versus Eif2αS/A cKICamk2α (n = 5), t = 4.038, p = 0.0037). (B) Global protein synthesis, measured by AHA incorporation, is increased in CA1 excitatory neurons in Eif2αS/A cKICamk2α mice compared with control mice (control (n = 4) versus Eif2αS/A cKICamk2α (n = 4), t = 3.504, p = 0.0128). (C, D) Immunoblotting (left) and quantification (right) show reduced p-eIF2α in Eif2αS/A cKICamK2α (n = 5) compared with control (n = 4) mice in hippocampus (C, control versus Eif2αS/A cKICamK2α, t = 2.658, p = 0.0326), and cortex (D, control versus Eif2αS/A cKICamK2α, t = 3.296, p = 0.0132). Eif2αS/S Camk2Cre mouse line was used as control. (E and F) Three-chamber social interaction test in Eif2αS/A cKICamk2α mice. (H) In the first 10-minutes phase of the test (sociability phase), both Eif2αS/A cKICamk2α and control mice preferred cage containing stranger (S1) mouse over empty cage (E) (Chamber time effect: F(1, 54) = 59.86, p < 0.0001; Controls, n = 15, E sniffing time versus S1 time, t54 = 7.528, p < 0.0001), EifS/A cKICamk2α mice (n = 14, E time versus S1 time, t54 = 3.485, p = 0.0020). Statistics are based on two-way ANOVA followed by Bonferroni’s post hoc test. In the second phase (F, novelty seeking phase), Eif2αS/A cKICamk2α mice show no preference for novel mouse (S2) over familiar mouse (S1) (Chamber time effect; F(1, 54) = 34.90, p < 0.0001; S1 time versus S2 time, t54 = 1.446, p > 0.05), contrary to control animals (S1 time versus S2 time, t54 = 7.006, p < 0.0001). Statistics are based on two-way ANOVA followed by Bonferroni’s post hoc test. Direct social interaction test (G) reveals that Eif2αS/A cKICamk2α mice interact less with the stranger mouse than control mice (t = 2.49, p = 0.019). Eif2αS/A cKICamk2α mice groom significantly more than controls (H, control (n = 15) versus Eif2αS/A cKICamk2α (n = 14), t = 3.515, p = 0.0016) and bury more marbles in marble burying test (I, control (n = 15) versus Eif2αS/A cKICamk2α (n = 14), t = 3.657, p = 0.0011). Student’s t-test was used in all panels except E and F. All data are shown as mean ± SEM. *p < 0.05, **p < 0.01, ***p < 0.001, ****p < 0.0001, and ns, not significant. Scale bars, 25 μm. See also Figure S8.
Figure 4.
Figure 4.. Heterozygous ablation of p-eIF2α in all cell types does not cause autism-like behaviors.
(A, top) Schematic illustration of alleles in Eif2αS/A knock-in (KI) mouse line. (A, bottom) Immunoblot shows a reduction in p-eIF2α in the brain of Eif2αS/A KI mice. (B, C) three-chamber social interaction test. Eif2αS/A KI mice show no deficits in sociability (B, F(1, 34) = 0.337, p > 0.05; KI, n = 9; control, n = 10, sniffing time for empty cage (E) over stranger 1 (S1) for control, t34 = 2.766, p = 0.0182; KI mice t34 = 3.425, p = 0.0032, two-way ANOVA followed by Bonferroni’s multiple comparisons test) or novelty phase (C, F(1, 34) = 0.082, p > 0.05, sniffing time for familiar mouse (S1) over novel mouse (S2) for control, t34 = 4.339, p = 0.0002; KI, t34 = 4.512, p = 0.0001, two-way ANOVA followed by Bonferroni’s multiple comparisons test). Similar to control animals (n = 10), Eif2αS/A KI mice (n = 9) showed no impairments in direct social interaction (D, t = 1.561, p > 0.05, Student’s t-test), self-grooming (E, t = 0.005, p > 0.05, Student’s t-test), and marble burying (F, t = 0.218, p > 0.05, Student’s t-test). (G-I) No anxiety-like behavior was found in Eif2αS/AKI mice (open arm time, t = 1.373, p > 0.05; closed arm time, t = 0.2445, p > 0.05, and total number of arm entries, t = 1.396, p > 0.05, Student’s t-test). Each data point represents an individual animal. All data are presented as mean ± SEM. *p < 0.05, **p < 0.01, and ***p < 0.001, and ns, not significant. See also Figure S9.
Figure 5.
Figure 5.. CReP-shRNA normalizes reduced eIF2α phosphorylation and corrects the elevated protein synthesis in excitatory neurons in Fmr1−/y mice.
AAV9-Camk2α-GFP-Ppp1r15b-shRNAmir (CReP-shRNA) or scrambled AAV were delivered via intracerebroventricular (i.c.v.) injection to ablate CReP in excitatory neurons. AAVs were injected at postnatal day (PND) 28, and experiments were performed at PND P56. (B) In the brain, eIF2α is phosphorylated by PERK, PKR, and GCN2 kinases and dephosphorylated by PP1, which forms a complex with CReP or GADD34. (C) Immunostaining of hippocampal sections for p-eIF2α in wild-type and Fmr1−/y animals injected with CReP-shRNA or scrambled AAVs. (D) CReP-shRNAmir increases the p-eIF2α in excitatory neurons (eGFP-positive) in CA1 of Fmr1−/y mice to the WT level (F3, 16 = 7.054, p = 0.0031, Fmr1−/y + CReP-shRNA versus Fmr1−/y mice + Scrambled, t16 = 4.135, p = 0.0047; WT + Scrambled versus Fmr1−/y + Scrambled, t16 = 3.352, p = 0.0243, n = 5 for all groups. Statistics are based on one-way ANOVA followed by Tukey post hoc comparisons. AHA incorporation (grey) in excitatory neurons (eGFP-positive, green) in CA1 (D) and PFC (E). CReP-shRNA AAV normalizes the elevated protein synthesis in excitatory neurons in Fmr1−/y mice in CA1 (D, F3, 16 = 6.286, p = 0.005, WT + Scramble versus WT + CReP-shRNA, q16 = 0.411, p > 0.05; WT + Scrambled versus Fmr1−/y + Scrambled, q16 = 5.004, p = 0.0131; Fmr1−/y + Scrambled versus Fmr1−/y + CReP-shRNA, q16 = 4.424, p = 0.0297, one-way ANOVA followed by Tukey post hoc comparisons, n = 5 for each group), and PFC (E, F3, 16 = 11.62, p = 0.0003, WT + Scrambled versus WT + CReP-shRNA, q16 = 1.085, p > 0.05; WT + Scrambled versus Fmr1−/y + Scrambled, q16 = 6.627, p = 0.0013; Fmr1−/y + Scrambled versus Fmr1−/y + CReP-shRNA, q16 = 4.688, p = 0.0205, one-way ANOVA followed by Tukey’s multiple comparisons test, n = 5 for each group). Each data point represents individual animal. Scale bar, 25 μm. All data are shown as mean ± SEM. *p < 0.05, **p < 0.01, ns, not significant. See also Figure S10.
Figure 6.
Figure 6.. Correction of eIF2α phosphorylation in excitatory neurons rescues pathological phenotypes in Fmr1−/y mice.
(A-D) Ablation of CReP partially rescues exaggerated mGluR-LTD. (A) CReP-shRNA or Scrambled AAV was injected i.c.v. at postnatal day (PND) 1–2 and recording was performed at PND 28–35. (B) Representative traces from 4 groups (baseline in grey and recording at 1 hour in solid colors). (Bottom) LTD was induced by application of DHPG (50 μM for 10 min). Field excitatory postsynaptic potentials (fEPSP) were recorded over a 60-min period after DHPG-induced LTD. (C) The quantification of the fEPSP slope (% of baseline) during the last 10 min of the recording. CReP-shRNA AAVs reduced the exaggerated LTD in Fmr1−/y mice (F3, 27 = 8.587, p = 0.0004, WT + Scrambled (n = 7 slices from 7 mice) versus Fmr1−/y + Scrambled (n = 8 slices from 8 mice), q27 = 6.196, p = 0.0009; Fmr1−/y + Scrambled versus Fmr1−/y + CReP-shRNA (n = 8 slices from 8 mice), q27 = 4.580, p = 0.0158; one-way ANOVA followed by Tukey’s multiple comparisons post hoc test). (D) No differences in input/output responses (F21, 182 = 0.643, p > 0.05, one-way ANOVA). (E, F) Three-chamber social interaction test, n = 10 per group. (E) In sociability phase, CReP-shRNA AAV rescued the time Fmr1−/y mice interact with stranger animal (S1) over empty cage (E) (Chamber time effect, F(1, 72) = 66.10, p < 0.0001; Fmr1−/y + CReP-shRNA, t72 = 4.859, p < 0.0001; WT + Scrambled, t72 = 5.005, p < 0.0001; Fmr1−/y + Scrambled, t72 = 0.849, p > 0.5; WT + CReP-shRNA, t72 = 5.546, p < 0.0001, one-way ANOVA followed by Bonferroni’s multiple comparisons test). (F) In the novelty seeking phase, Fmr1−/y + CReP-shRNA group spent significantly more time interacting with novel moues (S2) than familiar one (S1) (Chamber time effect, F(1, 72) = 90.46, p < 0.0001; Fmr1−/y + CReP-shRNA, t72 = 5.137, p < 0.0001; WT + Scrambled, t72 = 6.147, p < 0.0001; Fmr1−/y + Scrambled, t72 = 1.343, p > 0.5; WT + CReP-shRNA, t72 = 6.394, p < 0.0001, one-way ANOVA followed by Bonferroni’s multiple comparisons test). (G) In marble burying test (n = 10 per group), CReP-shRNA AAV reduced the number of buried marbles in Fmr1−/y mice (F3, 36 = 13.20, p < 0.0001, WT + Scrambled versus Fmr1−/y + Scrambled, q36 = 6.836, p = 0.0001; Fmr1−/y + Scrambled vs. Fmr1−/y + CReP-shRNA, q36 = 6.285, p < 0.0005, One-way ANOVA followed by Tukey’s multiple comparisons test). (H) CReP-shRNA AAV reduced the time Fmr1−/y mice spent grooming (F3, 36 = 9.602, p < 0.0001, WT + Scrambled versus Fmr1−/y + Scrambled, q36 = 6.587, p = 0.0002; Fmr1−/y + Scrambled versus Fmr1−/y + CReP-shRNA, q36 = 4.108, p = 0.304, One-way ANOVA, followed by Tukey’s multiple comparisons test). For E-H, AAVs were injected i.c.v. at postnatal day 28, and experiments were performed starting PND P56. (I-K) CReP-shRNA AAV alleviated audiogenic seizures (AGS) in Fmr1−/y mice. (I) AGS induction protocol (top), and the apparatus (bottom) composed of a soundproof box and a speaker to generate 120 dB noise. (J) Different levels of seizure upon exposure to 120 dB noise ranging from no seizure to wild running (WR), tonic-clonic (TC), and severe seizure that leads to respiratory arrest and death (RA). (K) Unlike WT + Scrambled (n = 10) and WT + CReP-shRNA (n = 10) groups, which showed no seizure, 20% of Fmr1−/y mice (n = 10) experience wild running, 30% tonic-clonic and 50% of them showed the severe form of the seizure, respiratory arrest, and death. CReP-shRNA AAV significantly reduced the severity of the seizure in Fmr1−/y + CReP-shRNA (n = 10), (X2 (9)=545.3, p < 0.0001, Fisher’s exact test). For I-K, AAVs were injected i.c.v. at postnatal day 1–2, and experiments were performed at PND P28–35. Each data point represents individual animal. All data are shown as mean ± SEM. *p < 0.05, ***p < 0.001, ****p < 0.0001, ns, not significant. See also Figure S11.

References

    1. Hagerman RJ, Berry-Kravis E, Hazlett HC, Bailey DB Jr., Moine H, Kooy RF, Tassone F, Gantois I, Sonenberg N, Mandel JL, and Hagerman PJ (2017). Fragile X syndrome. Nat Rev Dis Primers 3, 17065. 10.1038/nrdp.2017.65. - DOI - PubMed
    1. Kelleher RJ 3rd, and Bear MF (2008). The autistic neuron: troubled translation? Cell 135, 401–406. 10.1016/j.cell.2008.10.017. - DOI - PubMed
    1. Torossian A, Sare RM, Loutaev I, and Smith CB (2021). Increased rates of cerebral protein synthesis in Shank3 knockout mice: Implications for a link between synaptic protein deficit and dysregulated protein synthesis in autism spectrum disorder/intellectual disability. Neurobiol Dis 148, 105213. 10.1016/j.nbd.2020.105213. - DOI - PubMed
    1. Hornberg H, Perez-Garci E, Schreiner D, Hatstatt-Burkle L, Magara F, Baudouin S, Matter A, Nacro K, Pecho-Vrieseling E, and Scheiffele P (2020). Rescue of oxytocin response and social behaviour in a mouse model of autism. Nature 584, 252–256. 10.1038/s41586-020-2563-7. - DOI - PMC - PubMed
    1. Barnes SA, Wijetunge LS, Jackson AD, Katsanevaki D, Osterweil EK, Komiyama NH, Grant SG, Bear MF, Nagerl UV, Kind PC, and Wyllie DJ (2015). Convergence of Hippocampal Pathophysiology in Syngap+/− and Fmr1-/y Mice. J Neurosci 35, 15073–15081. 10.1523/JNEUROSCI.1087-15.2015. - DOI - PMC - PubMed

Publication types

Substances