. 2023 Sep;299(9):105073.
doi: 10.1016/j.jbc.2023.105073. Epub 2023 Jul 19.

Mitochondrial double-stranded RNA triggers induction of the antiviral DNA deaminase APOBEC3A and nuclear DNA damage

Affiliations

Mitochondrial double-stranded RNA triggers induction of the antiviral DNA deaminase APOBEC3A and nuclear DNA damage

Chloe Wick et al. J Biol Chem. 2023 Sep.

Abstract

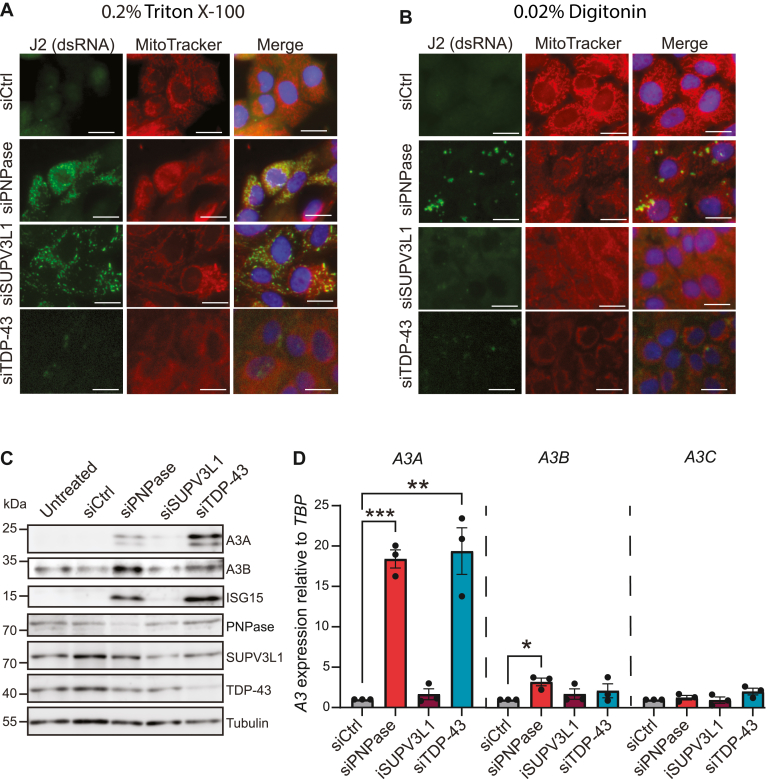
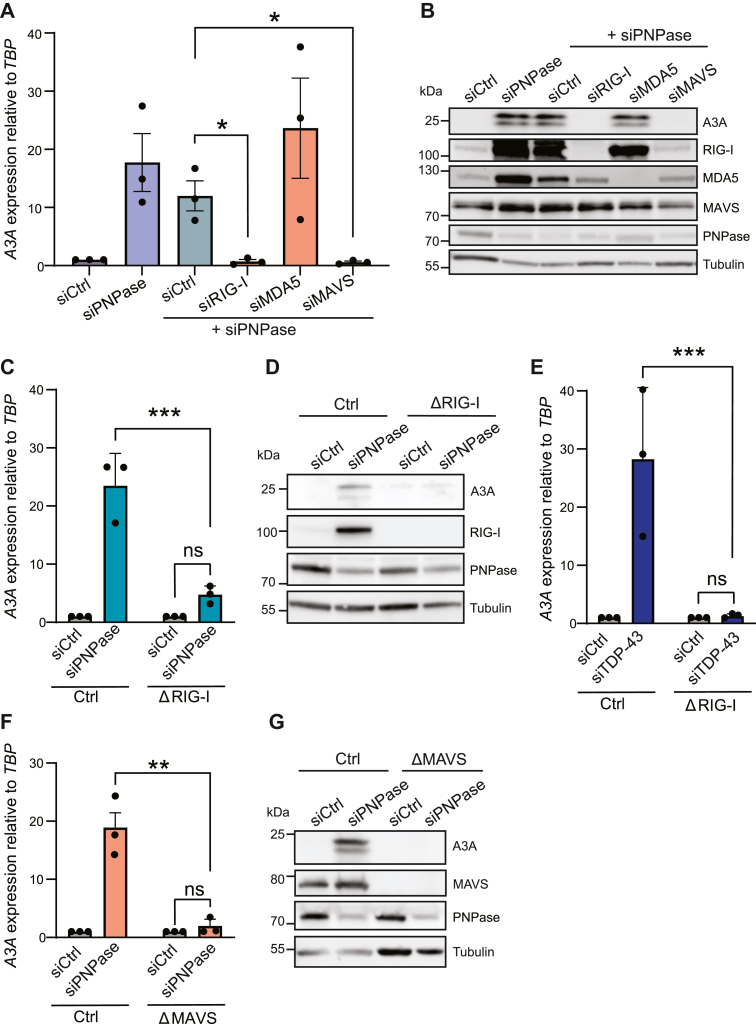
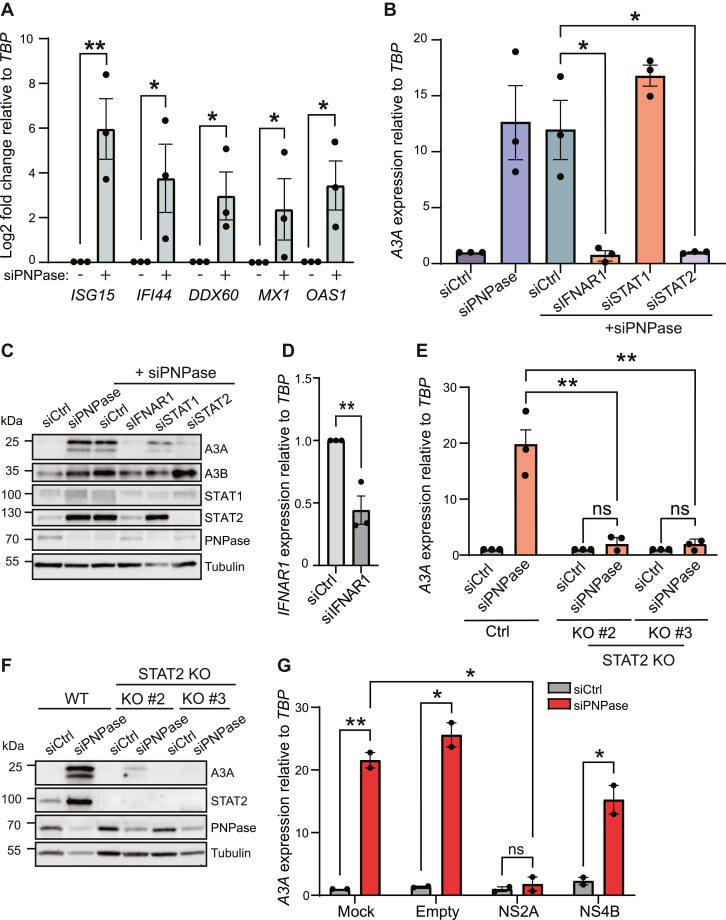
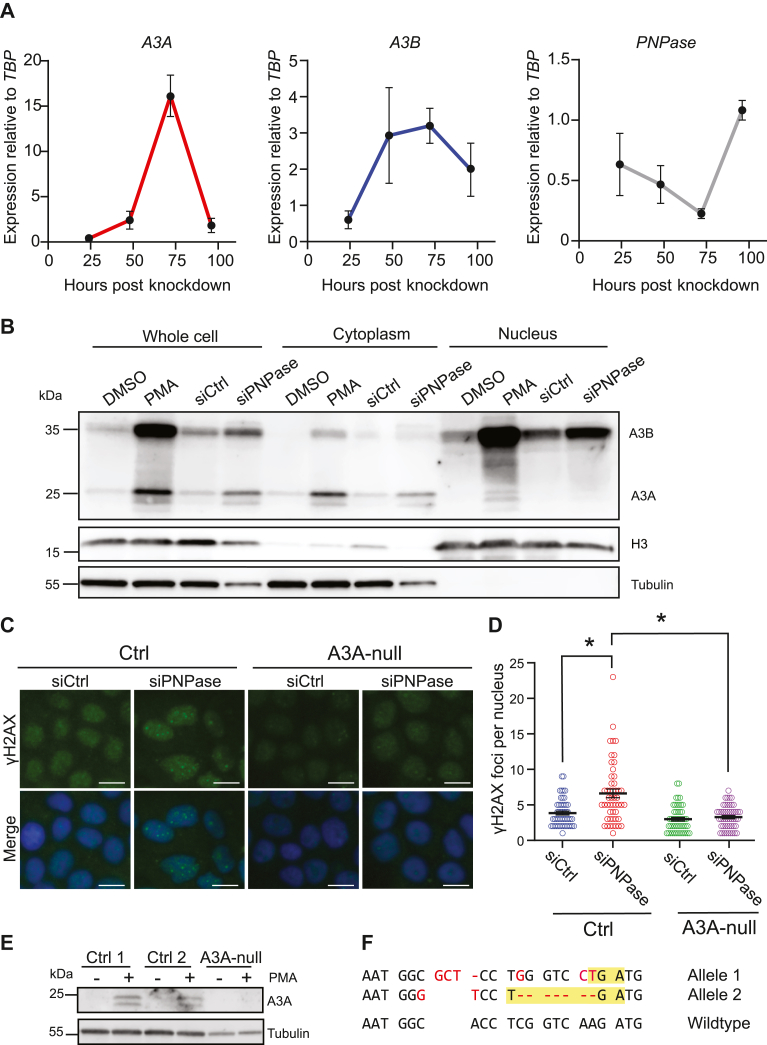
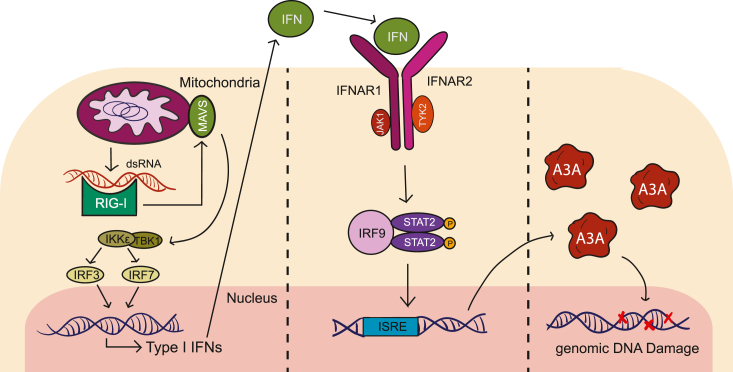
APOBEC3A is an antiviral DNA deaminase often induced by virus infection. APOBEC3A is also a source of cancer mutation in viral and nonviral tumor types. It is therefore critical to identify factors responsible for APOBEC3A upregulation. Here, we test the hypothesis that leaked mitochondrial (mt) double-stranded (ds)RNA is recognized as foreign nucleic acid, which triggers innate immune signaling, APOBEC3A upregulation, and DNA damage. Knockdown of an enzyme responsible for degrading mtdsRNA, the exoribonuclease polynucleotide phosphorylase, results in mtdsRNA leakage into the cytosol and induction of APOBEC3A expression. APOBEC3A upregulation by cytoplasmic mtdsRNA requires RIG-I, MAVS, and STAT2 and is likely part of a broader type I interferon response. Importantly, although mtdsRNA-induced APOBEC3A appears cytoplasmic by subcellular fractionation experiments, its induction triggers an overt DNA damage response characterized by elevated nuclear γ-H2AX staining. Thus, mtdsRNA dysregulation may induce APOBEC3A and contribute to observed genomic instability and mutation signatures in cancer.

Keywords: APOBEC3A; DNA damage response; cancer mutagenesis; innate immune signaling; mitochondrial dsRNA.


Conflict of interest statement

Conflict of interest The authors declare that they have no conflicts of interest with the contents of this article.

Figures

Figure 1
Figure 1
Leaked mitochondrial dsRNA triggers A3A upregulation. A and B, immunofluorescence microscopy images of MCF10A cells treated with siCtrl, siPNPase, siSUPV3L1, or siTDP-43 for 72 h and permeabilized with (A) 0.2% Triton X-100 or (B) 0.02% digitonin after which they were stained with the dsRNA-binding antibody J2. Mitochondria were stained with MitoTracker, and nuclei were stained with Hoechst (the scale bar represents 10 μm). C, immunoblot analysis of the indicated proteins expressed in MCF10A cells treated with siCtrl, siPNPase, siSUPV3L1, or siTDP-43 for 72 h. Tubulin was used as a loading control. All subpanels are from the same representative blot. D, Reverse transcription-quantitative PCR analysis of A3 mRNA levels in MCF10A cells after treatment with siCtrl, siPNPase, siSUPV3L1, or siTDP-43 for 72 h. Expression refers to A3 mRNA fold change relative to the negative control (set to 1) normalized to TBP. Mean values ± SEM of three independent experiments (∗p ≤ 0.05, ∗∗p ≤ 0.01, ∗∗∗p ≤ 0.001 by Student’s t test and not shown if insignificant).
Figure 2
Figure 2
The RIG-I/MAVS axis is required for upregulating A3A in response to endogenous mitochondrial dsRNA. A, RT-qPCR analysis of A3A after treatment with siCtrl, siPNPase, and codepletions of siPNPase with siCtrl, siRIG-I, siMDA5, and siMAVS for 72 h in MCF10A cells. Expression refers to mRNA fold change relative to the negative control (which was set to 1) and was normalized to TBP. Mean values ± SEM of three independent experiments (∗p ≤ 0.05 by Student’s t test and not shown if insignificant). B, immunoblot analysis of A3A in MCF10A cells treated with siCtrl, siPNPase, and codepletions of siPNPase with siCtrl, siRIG-I, siMDA5, and siMAVS. Tubulin was used as a loading control. C and D, RT-qPCR and immunoblot analysis of A3A mRNA and protein levels, respectively, in control or RIG-I KO MCF10A cells following siCtrl or siPNPase treatment. Expression refers to mRNA fold change relative to the negative control (which was set to 1) and was normalized to TBP. Mean values ± SEM of three independent experiments (∗∗∗p ≤ 0.001 by Student’s t test and not shown if insignificant). E, RT-qPCR analysis of A3A mRNA levels, respectively, in control or RIG-I KO MCF10A cells following siCtrl or siTDP-43 treatment. Expression refers to mRNA fold change relative to the negative control (which was set to 1) and was normalized to TBP. Mean values ± SEM of three independent experiments (∗∗∗p ≤ 0.001 by Student’s t test and not shown if insignificant). F and G, RT-qPCR and immunoblot analysis of A3A mRNA and protein levels, respectively, in control or MAVS KO MCF10A cells following siCtrl or siPNPase treatment. Expression refers to mRNA fold change relative to the negative control (which was set to 1) and was normalized to TBP. Mean values ± SEM of three independent experiments (∗∗p ≤ 0.01 by Student’s t test and not shown if insignificant). RT-qPCR, reverse transcription-quantitative PCR.
Figure 3
Figure 3
A3A is upregulated via a STAT2-dependent interferon response. A, RT-qPCR analysis of a panel of interferon-responsive genes (ISG15, IFI44, DDX60, MX1, OAS1) after siPNPase treatment of MCF10A cells. Expression refers to mRNA log2 fold change relative to the negative control (which was set to 0) and was normalized to TBP. Mean values ± SEM of three independent experiments (∗p ≤ 0.05, ∗∗p ≤ 0.01 by Student’s t test and not shown if insignificant). B, RT-qPCR analysis of A3A in MCF10A cells treated with siCtrl, siPNPase, and siPNPase in combination with siCtrl, siIFNAR1, siSTAT1, and siSTAT2 (∗p ≤ 0.05 by Student’s t test and not shown if insignificant). C, immunoblot analysis of MCF10A cells treated with siCtrl, siPNPase, and codepletions of siPNPase in combination with siIFNAR1, siSTAT1, and siSTAT2. D, RT-qPCR analysis of IFNAR1 in MCF10A cells treated with siCtrl or siIFNAR1 and siPNPase. Mean values ± SEM of three independent experiments (∗∗p ≤ 0.01 by Student’s t test). E and F, RT-qPCR and immunoblot analysis of A3A mRNA and protein levels, respectively, in control or STAT2 KO MCF10A cells following siCtrl or siPNPase treatment. Expression refers to mRNA fold change relative to the negative control (which was set to 1) and was normalized to TBP. Mean values ± SEM of three independent experiments (∗∗p ≤ 0.01 by Student’s t test and not shown if insignificant). G, RT-qPCR analysis of A3A in A549 cells treated with siCtrl/siPNPase and transfected with plasmids encoding NS2A, NS4B, or GFP. Expression refers to mRNA fold change relative to the negative control (which was set to 1) and was normalized to TBP. Mean values ± SEM of two independent experiments (∗p ≤ 0.05, ∗∗p ≤ 0.01 by Student’s t test and not shown if insignificant). RT-qPCR, reverse transcription-quantitative PCR.
Figure 4
Figure 4
DNA damage induced by the upregulation of PNPase is A3A dependent. A, Reverse transcription-quantitative PCR analysis of A3A, A3B, and PNPase in MCF10A cells treated with siCtrl/siPNPase after 24, 48, 72, and 96 h (mean ± SEM of three independent experiments). B, immunoblot analysis of whole cell, cytoplasmic, and nuclear fractions of MCF10A cells treated with 10 nM siCtrl/siPNPase for 72 h or DMSO/25 ng/ml PMA for 24 h (C and D) representative immunofluorescence microscopy images of γ-H2AX in control or A3A knockout cells treated with siCtrl/siPNPase with quantification of the number of γ-H2AX foci per nucleus (the scale bar represents 10 μm; mean ± SEM of n > 50 cells per condition; ∗p ≤ 0.05 by Student’s t test and not shown if insignificant). E, immunoblot of A3A in two control (lacZ) clones and in an A3A knockout clone following 24 h of stimulation with 25 ng/ml PMA. F, DNA sequence of the CRISPR-disrupted A3A alleles in MCF10A cells (5/10 sequenced plasmids had allele 1 and 5/10 allele 2). Frameshift-induced premature stop codons are highlighted in yellow, and insertions, deletions, and substitutions are shown in red. DMSO, dimethyl sulfoxide; PMA, phorbol 12-myristate 13-acetate.
Figure 5
Figure 5
Working model for A3A upregulation by endogenous dsRNA. Mitochondrial dsRNAs that accumulate inappropriately in the cytosol are sensed by RIG-I, which signals through the adaptor protein MAVS and leads to a type I interferon response, induction of A3A by STAT2, and chromosomal DNA damage. Three distinct panels are shown to illustrate the fact that interferon signaling can act in both cis and trans (autocrine and paracrine).

Similar articles

Cited by

References

    1. Salter J.D., Bennett R.P., Smith H.C. The APOBEC protein family: United by structure, divergent in function. Trends Biochem. Sci. 2017;41:578–594. - PMC - PubMed
    1. Refsland E.W., Harris R.S. The APOBEC3 family of retroelement restriction factors. Curr. Top. Microbiol. Immunol. 2013;371:1–27. - PMC - PubMed
    1. Green A.M., Landry S., Budagyan K., Avgousti D.C., Shalhout S., Bhagwat A.S., et al. APOBEC3A damages the cellular genome during DNA replication. Cell Cycle. 2016;15:998–1008. - PMC - PubMed
    1. Hoopes J.I., Cortez L.M., Mertz T.M., Malc E.P., Mieczkowski P.A., Roberts S.A. APOBEC3A and APOBEC3B preferentially deaminate the lagging strand template during DNA replication. Cell Rep. 2016;14:1273–1282. - PMC - PubMed
    1. Cervantes-Gracia K., Gramalla-Schmitz A., Weischedel J., Chahwan R. APOBECs orchestrate genomic and epigenomic editing across health and disease. Trends Genet. 2021;37:1028–1043. - PubMed

Publication types