. 2023 Aug 9;43(32):5741-5752.
doi: 10.1523/JNEUROSCI.0815-23.2023. Epub 2023 Jul 20.

Postsynaptic Calcium Extrusion at the Mouse Neuromuscular Junction Alkalinizes the Synaptic Cleft

Affiliations

Postsynaptic Calcium Extrusion at the Mouse Neuromuscular Junction Alkalinizes the Synaptic Cleft

Ryan J Durbin et al. J Neurosci. .

Abstract

Neurotransmission is shaped by extracellular pH. Alkalization enhances pH-sensitive transmitter release and receptor activation, whereas acidification inhibits these processes and can activate acid-sensitive conductances in the synaptic cleft. Previous work has shown that the synaptic cleft can either acidify because of synaptic vesicular release and/or alkalize because of Ca2+ extrusion by the plasma membrane ATPase (PMCA). The direction of change differs across synapse types. At the mammalian neuromuscular junction (NMJ), the direction and magnitude of pH transients in the synaptic cleft during transmission remain ambiguous. We set out to elucidate the extracellular pH transients that occur at this cholinergic synapse under near-physiological conditions and identify their sources. We monitored pH-dependent changes in the synaptic cleft of the mouse levator auris longus using viral expression of the pseudoratiometric probe pHusion-Ex in the muscle. Using mice from both sexes, a significant and prolonged alkalization occurred when stimulating the connected nerve for 5 s at 50 Hz, which was dependent on postsynaptic intracellular Ca2+ release. Sustained stimulation for a longer duration (20 s at 50 Hz) caused additional prolonged net acidification at the cleft. To investigate the mechanism underlying cleft alkalization, we used muscle-expressed GCaMP3 to monitor the contribution of postsynaptic Ca2+ Activity-induced liberation of intracellular Ca2+ in muscle positively correlated with alkalization of the synaptic cleft, whereas inhibiting PMCA significantly decreased the extent of cleft alkalization. Thus, cholinergic synapses of the mouse NMJ typically alkalize because of cytosolic Ca2+ liberated in muscle during activity, unless under highly strenuous conditions where acidification predominates.SIGNIFICANCE STATEMENT Changes in synaptic cleft pH alter neurotransmission, acting on receptors and channels on both sides of the synapse. Synaptic acidification has been associated with a myriad of diseases in the central and peripheral nervous system. Here, we report that in near-physiological recording conditions the cholinergic neuromuscular junction shows use-dependent bidirectional changes in synaptic cleft pH-immediate alkalinization and a long-lasting acidification under prolonged stimulation. These results provide further insight into physiologically relevant changes at cholinergic synapses that have not been defined previously. Understanding and identifying synaptic pH transients during and after neuronal activity provides insight into short-term synaptic plasticity synapses and may identify therapeutic targets for diseases.

Keywords: acetylcholine; mouse; neuromuscular junction; pH; synapse; synaptic transmission.


Figures

Figure 1.
Figure 1.
Virally expressed pHusion-Ex responds to changes in extracellular pH at the NMJ. Data are presented as mean ± SD in all graphs. A, Fluorescence ratio of pHusion-Ex at various bath pHs. Levator auris longus muscles infected with AAV-pHusion-Ex were incubated in a static bath buffered with 20 mm HEPES and 10 mm HCO3, at indicated pH (N = 16). B, Calibration of relationship between pH and fluorescence change, normalized to pH 7.2. C, Prominent surface expression of GFP/pHusion-Ex at the NMJ endplate. Maximum z-projection of a confocal image stack of a levator auris longus muscle infected with pHusion-Ex and stained under nonpermeabilizing conditions with an anti-GFP antibody. Images were taken at 40×. Left (green), pHusion-ex expression; middle (magenta) anti-GFP binding; right, merged pHusion-ex and anti-GFP signal.
Figure 2.
Figure 2.
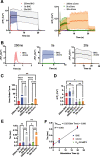
The NMJ synaptic cleft alkalizes in response to synaptic stimulation when postsynaptic signal transduction is intact. Synaptic cleft pH was monitored using muscle-expressed pHusion-Ex. Myosin inhibitor BHC blocked muscle contraction, and Nav1.4 antagonist μ-Conotoxin blocked muscle action potential generation. Data are presented as mean ± SD in all graphs. A, An expanded timescale of the 250 ms stimulation condition in BHC, illustrating mild cleft alkalization that does not recover. The gray area (vertical line) indicates when stimulation occurred. B, An expanded timescale of the 5 s stimulation condition in BHC, illustrating cleft alkalization and recovery to baseline. The gray area indicates when stimulation occurred. C, An expanded timescale of the 20 s stimulation condition in µCono, illustrating slow and mild alkalization of the cleft. The gray area indicates when stimulation occurred. D, Full timescale showing summary of changes in pH when incubated with BHC and stimulated for 250 ms at 50 Hz (red, N = 7), or 5 s at 50 Hz (blue, N = 14). E, Full timescale showing activity-dependent changes in pH were largely absent when incubated with µCono (purple, 250 ms stimulation at 50 Hz, N = 7; orange, 20 s stimulation at 50 Hz, N = 16). F, Truncated timescale of the 250 ms stimulation at 50 Hz when nAChRs are blocked with tubocurarine, displaying no change from baseline (N = 8). The gray area indicates when stimulation occurred. G, Comparison of maximum cleft pH alkalization. Stimulation for 5 s in BHC and stimulation for 20 s in µCono were sufficient to cause significant alkalization compared with no stimulus controls (****p < 0.0001 and **p = 0.008, respectively). All other conditions did not significantly deviate from baseline, p > 0.25. H, Comparison of the time at which maximum alkalization occurs. Simulation for 5 s, when incubated with BHC, alkalized significantly faster than all other conditions (250 ms BHC, *p = 0.014; 20 s µCono, ***p = 0.0002; 250 ms µCono, **p = 0.005) and reached a maximum during the stimulus train. All other conditions were not significantly different from one another. Stimulation onset was at 0 s.
Figure 3.
Figure 3.
HEPES accelerates recovery from fatigue-induced acidification. Data are presented as mean ± SD in all graphs. A, The time courses of preparations incubated with BHC and stimulated for 20 s at 50 Hz. The blue trace shows the summary of pH changes in endplates incubated in physiological buffer (10 mm bicarbonate, N = 13). The green trace shows pH changes in endplates incubated in a high-capacity pH buffer (20 mm HEPES and 10 mm bicarbonate, N = 9). The gray area indicates when stimulation occurred. B, Time courses of preparations incubated with BHC and stimulated for 20 s at 50 Hz, assessing the role of extracellular carbonic anhydrase. The blue trace shows pH changes in endplates incubated in physiological buffer (10 mm bicarbonate) as in A. The purple trace shows cells incubated with 100 μm acetazolamide to block carbonic anhydrase and limit endogenous buffering (N = 8). The gray area indicates when stimulation occurred. C, An expanded timescale of pH changes in A, showing the difference between the original (10 mm, blue) and high-capacity (20 mm HEPES, green) buffering conditions. Note the slight reduction in alkalization in the presence of high HEPES. The gray area indicates when stimulation occurred. D, An expanded timescale of pH changes in 10 mm bicarbonate and 100 μm acetazolamide, showing the maximum pH changes when endplates were incubated with BHC and stimulated for 20 s at 50 Hz. The gray area indicates when stimulation occurred. E, Summary comparison of maximum alkalization. HEPES buffer and treatment with 100 μm acetazolamide did not significantly reduce alkalization compared with the physiological buffer (p > 0.15). ns = no significant difference. Note the wide variability in the data. F, Summary comparison of the maximum acidification. No significant change was measured (p > 0.68, Kruskal–Wallis test). G, Summary comparison of recovery from acidification, measured as the time constant of the recovery curve. Cells recovered significantly faster from acidification when incubated in 20 mm HEPES buffer (**p = 0.006 vs 10 mm HCO3, *p = 0.014 vs acetazolamide). Acetazolamide did not vary significantly from the physiological buffer (p > 0.178, Brown–Forsythe test). Simulation onset was at 0 s.
Figure 4.
Figure 4.
Muscle-expressed GCAMP shows a significantly larger cytosolic Ca2+ transient in BHC when compared with µCono. Data are presented as mean ± SD in all graphs. A, Summary of changes in GCaMP3 signal in response to 250 ms, 5 s, and 20 s stimulation trains at 50 Hz in either BHC (left, N = 9) or µCono (right, N = 10). Note the difference in response magnitude between graphs. B, Comparison of fluorescent GCaMP3 signal in response to 250 ms (left), 5 s (middle), and 20 s (right) in BHC versus µCono. C, Summary comparison of the integral of GCaMP3 response. The area under the curve for all conditions was significantly different from each other (all other conditions, p < 0.021; Dunnett's test). ns = no significant difference, *p < 0.5, **p < 0.01, ***p < 0.001, ****p < 0.0001. D, Summary comparison of maximum fluorescence values. All BHC conditions had significantly higher maximums than all µCono conditions (BHC vs µCono, p < 0.05; Dunn's test) Similar peak GCaMP3 signal in BHC was seen across all stimulation durations. Similarly, µCono peak responses were independent of stimulation duration. E, Summary comparison of GCaMP signal decay following stimulation. Decay of GCaMP fluorescence after stimulation ended was fit with a single exponential. Time constant for recovery was significantly slowed by increasing stimulus duration (250 ms BHC vs 5 s BHC, p = 0.2; 250 ms BHC vs 5 s µCono, p = 0.12; all other time comparisons, p < 0.05, Dunnett's test). Stimulus trains with the same duration were not significantly different between BHC and µCono (p > 0.999, Brown–Forsythe test). F, Regression line relating the time constant of recovery to stimulation time (0 calculated from the koff = 5.3 s−1 of GCaMP3). Simulation onset was at 0 s.
Figure 5.
Figure 5.
Alkalization is modulated by intracellular Ca2+ release from the sarcoplasmic reticulum. Data are presented as mean ± SD in all graphs. A, Cleft pH changes are enhanced in µCono-treated preparations by the ryanodine receptor agonist caffeine (N = 8, red trace) when stimulated for 20 s at 50 Hz. Cleft pH in µCono alone had minimal alkalinization (paired and nonpaired data shown; N = 16, blue trace). The gray area indicates when stimulation occurred. B, Summary pairwise comparison shows increased pH change because of caffeine; **p = 0.007. C, GCaMP3 signal is increased after exposure to caffeine (N = 8, red trace). Virtually no GCaMP3 signal was seen because of stimulation in µ-Conotoxin (N = 8, blue trace). The gray area indicates when stimulation occurred. D, Maximum normalized GCaMP3 fluorescence was significantly increased by caffeine; **p = 0.008.
Figure 6.
Figure 6.
PMCA localizes to the NMJ endplate. A, Example maximum z-projections of deconvolved confocal images of NMJ endplates show close correlation between PMCA and synaptic markers. Magenta, anti-vAChT; green, Alexa Fluor 594 conjugated to α-bungarotoxin; blue, anti-pan-PMCA. B, Three-dimensional-STED image of a portion of an LAL endplate shows PMCA is located extrasynaptically, adjacent to nAChRs. Lateral resolution is 60–100 nm in these images. C, Transcript abundance of PMCA isoforms (Atp2b1-4) relative to GAPDH was determined by qRT-PCR from LAL lysate. PMCA1 is transcribed significantly more than PMCA3 and PMCA4; *p = 0.037 for both comparisons, but not significantly more than PMCA2, p = 0.602 (Dunn's test). All other comparisons were not significantly different (p > 0.602); N = 4 independent replicates (animals). Data are presented as mean ± SD.
Figure 7.
Figure 7.
Alkalization at the neuromuscular junction requires PMCA activity. Data are presented as mean ± SD in all graphs. A, In paired experiments, synaptic cleft pH changes were muted by the PMCA inhibitor caloxin 1b1 (N = 7, red) compared with paired and nonpaired control cells in BHC (N = 14, blue) when stimulated for 5 s at 50 Hz. The gray area indicates when stimulation occurred. B, Summary of maximum alkalization (N = 7 cells) in paired experiments before and during caloxin exposure. Cleft alkalization was significantly reduced by caloxin, **p = 0.0012. C, Caloxin marginally attenuated GCAMP3 signal (N = 10, blue, BHC; N = 10, red, BHC + caloxin). The gray area indicates when stimulation occurred. D, Maximum normalized GCaMP fluorescence was not affected by caloxin in paired experiments.

Similar articles

Cited by

References

    1. Alijevic O, Bignucolo O, Hichri E, Peng Z, Kucera JP, Kellenberger S (2020) Slowing of the time course of acidification decreases the acid-sensing ion channel 1a current amplitude and modulates action potential firing in neurons. Front Cell Neurosci 14:41. 10.3389/fncel.2020.00041 - DOI - PMC - PubMed
    1. Allen DG, Lamb GD, Westerblad H (2008) Impaired calcium release during fatigue. J Appl Physiol (1985) 104:296–305. 10.1152/japplphysiol.00908.2007 - DOI - PubMed
    1. Baggaley E, Mclarnon S, Demeter I, Varga G, Bruce JIE (2007) Differential regulation of the apical plasma membrane Ca(2+)-ATPase by protein kinase A in parotid acinar cells. J Biol Chem 282:37678–37693. 10.1074/jbc.M703416200 - DOI - PubMed
    1. Bertone NI, Groisman AI, Mazzone GL, Cano R, Tabares L, Uchitel OD (2017) Carbonic anhydrase inhibitor acetazolamide shifts synaptic vesicle recycling to a fast mode at the mouse neuromuscular junction. Synapse 71:e22009. 10.1002/syn.22009 - DOI - PubMed
    1. Blaustein M, Wirth S, Saldana G, Piantanida AP, Bogetti ME, Martin ME, Colman-Lerner A, Uchitel OD (2020) A new tool to sense pH changes at the neuromuscular junction synaptic cleft. Scientific Reports 10:7. 10.1038/s41598-020-77154-3 - DOI - PMC - PubMed

Publication types

LinkOut - more resources