. 2023 Jul 20;14(1):4385.
doi: 10.1038/s41467-023-40054-x.

IL-1β turnover by the UBE2L3 ubiquitin conjugating enzyme and HECT E3 ligases limits inflammation

Affiliations

IL-1β turnover by the UBE2L3 ubiquitin conjugating enzyme and HECT E3 ligases limits inflammation

Vishwas Mishra et al. Nat Commun. .

Abstract

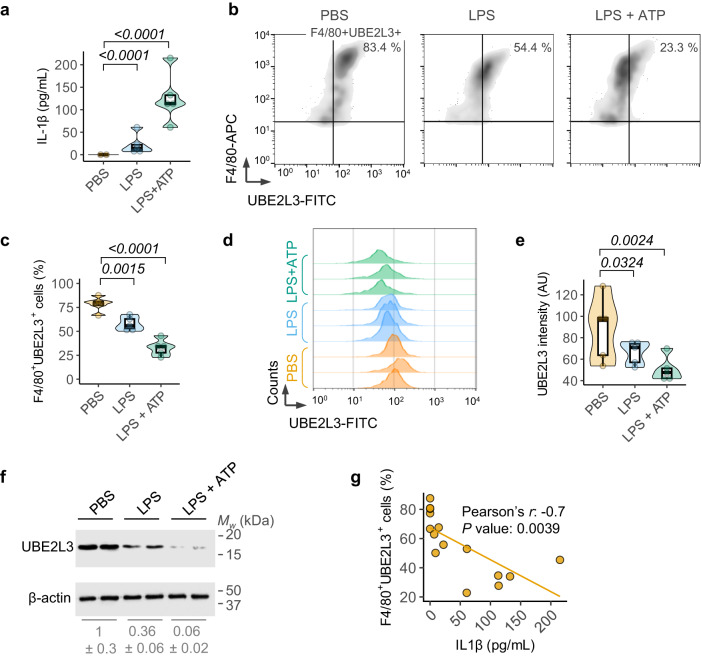
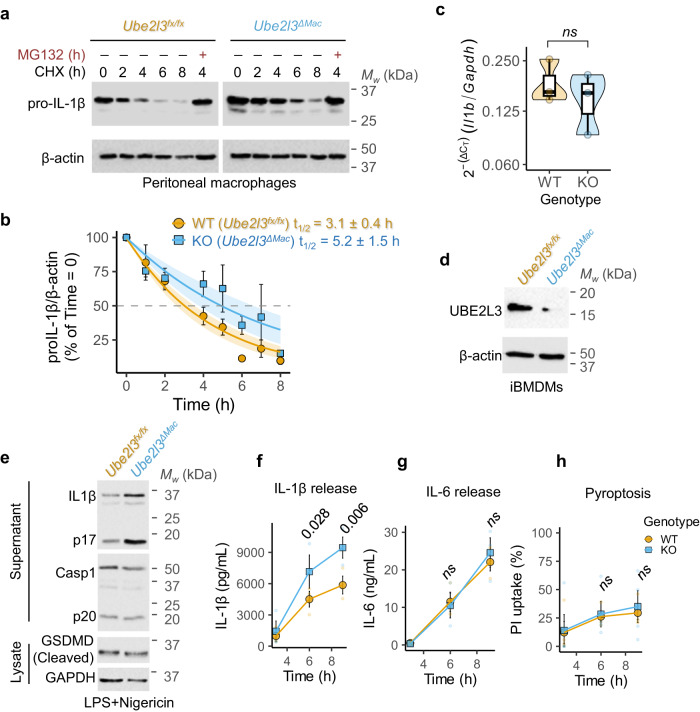
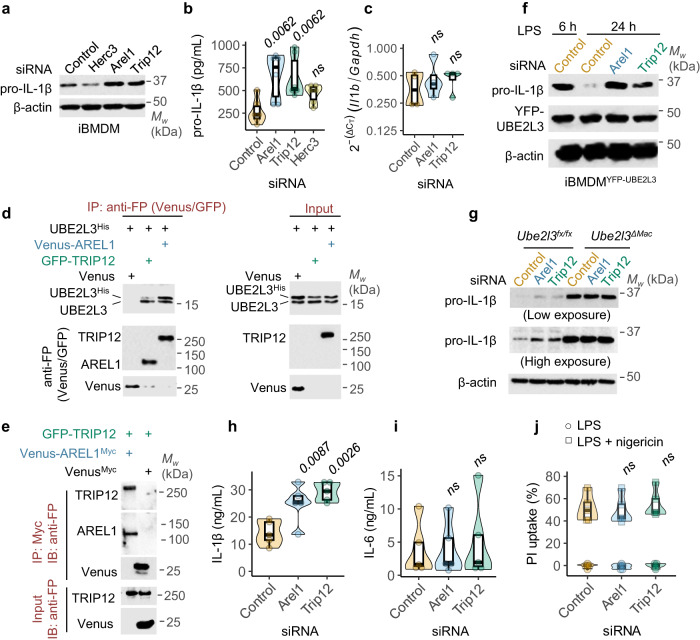
The cytokine interleukin-1β (IL-1β) has pivotal roles in antimicrobial immunity, but also incites inflammatory disease. Bioactive IL-1β is released following proteolytic maturation of the pro-IL-1β precursor by caspase-1. UBE2L3, a ubiquitin conjugating enzyme, promotes pro-IL-1β ubiquitylation and proteasomal disposal. However, actions of UBE2L3 in vivo and its ubiquitin ligase partners in this process are unknown. Here we report that deletion of Ube2l3 in mice reduces pro-IL-1β turnover in macrophages, leading to excessive mature IL-1β production, neutrophilic inflammation and disease following inflammasome activation. An unbiased RNAi screen identified TRIP12 and AREL1 E3 ligases of the Homologous to E6 C-terminus (HECT) family in adding destabilising K27-, K29- and K33- poly-ubiquitin chains on pro-IL-1β. We show that precursor abundance determines mature IL-1β production, and UBE2L3, TRIP12 and AREL1 limit inflammation by shrinking the cellular pool of pro-IL-1β. Our study uncovers fundamental processes governing IL-1β homeostasis and provides molecular insights that could be exploited to mitigate its adverse actions in disease.


Conflict of interest statement

The authors declare no competing interests.

Figures

Fig. 1
Fig. 1. UBE2L3 is depleted in vivo upon inflammasome activation.
a Quantification of IL-1β by ELISA of peritoneal lavage from mice given PBS, LPS (5 μg, 3 h) or LPS + ATP (5 μg, 3 h + 50 μmol, 10 min) intraperitoneally. b, c Representative flow cytometry density plots (b) of peritoneal cells stained with F4/80 (macrophage surface marker) and intracellular UBE2L3 and quantification (c) of the percentage double-positive cells from mice given PBS, LPS or LPS + ATP as described in a. d, e Representative histograms of counts of F4/80 and UBE2L3 double-positive cells (d) and the graph of mean geometric fluorescence intensity of UBE2L3 in F4/80+ve cells (e). Mice were treated as in a. AU = arbitrary units. f Representative immunoblots of UBE2L3 and β-actin in lysates from peritoneal macrophages. Each lane represents an individual mouse given PBS, LPS or LPS + ATP (5 μg for 3 h + 50 μmol 10 min) intraperitoneally as labelled. Numbers below (mean ± SD) are UBE2L3/β-actin ratios relative to the PBS samples. Data from one of three similar experiments. g Plot showing negative correlation between IL-1β measured in peritoneal lavage fluid and percentage of UBE2L3+ve peritoneal macrophages from the same mouse by flow cytometry. Each dot represents a mouse given PBS, LPS or LPS + ATP as in a–e. Each lane in d, f, and dot in a, c, e, g represents an individual mouse; n = 5 mice for experiments in ae. Data distribution is depicted with violin, box (25th to 75th percentile, line at median), and whiskers ( ± 1.5 x IQR). Two-tailed P value for indicated comparison from correlation analysis (g) or mixed effects ANOVA (a, c, e).
Fig. 2
Fig. 2. Elevated IL-1β in Ube2l3ΔMac mice after inflammasome activation.
a Schematic depiction of the strategy to generate conditional, macrophage-specific deletion of Ube2l3. Exon 1 of Ube2l3 was ‘floxed’, leading to its deletion by Cre recombinase whose expression is controlled by the Csf1r (also called CD115) promoter and activity is induced by oral administration of tamoxifen in vivo or 4-hydroxytamoxifen in vitro in macrophages. b Flow cytometric analysis showing percentage of Csf1r/CD115 and UBE2L3 +ve peritoneal macrophages isolated from mice of the indicated genotypes given tamoxifen orally on 3 consecutive days. WT = Ube2l3fx/fx; KO = Ube2l3ΔMac. c Schematic depiction of inflammatory models tested in Ube2l3fx/fx (WT) and Ube2l3ΔMac (KO) mice. Mice were given tamoxifen (Tam; 80 mg.kg−1) via oral gavage on 3 consecutive days, and the indicated inflammatory stimuli intraperitoneally on day 5. Low dose LPS + ATP = 5 μg LPS per mouse for 3 h followed by ATP (50 μmol) for 10 min. High dose LPS = 30 mg.kg−1 LPS for 3 h. MSU crystals = monosodium uric acid crystals (1 mg per mouse) for 6 h. See Methods for details. d, e Quantification of IL-1β (d) and IL-6 (e) by ELISA of peritoneal lavage from mice of the indicated genotypes following low dose LPS model. WT = Ube2l3fx/fx; KO = Ube2l3ΔMac. f–h Quantification of IL-1β (f) and IL-6 (g) by ELISA of serum, and disease scores (h), of mice of the indicated genotypes following high-dose LPS treatment. WT = Ube2l3fx/fx; KO = Ube2l3ΔMac. i, j Quantification of IL-1β (i) by ELISA and flow cytometry-based counts of neutrophils (j) in the peritoneal lavage of mice injected with MSU crystals. WT = Ube2l3fx/fx; KO = Ube2l3ΔMac. Each dot in b, d–j represents a mouse. Number of mice as follows: b, n = 6; d-e, n = 11; f–h, n = 9; i, j, n = 8. Data distribution is depicted with violin, box (25th to 75th percentile, line at median), and whiskers ( ± 1.5 x IQR); data are pooled from 2-4 independently repeated experiments. Two-tailed P values for indicated comparisons from mixed-effects ANOVA. ns – not significant (P > 0.05).
Fig. 3
Fig. 3. Ube2l3 deletion increases pro-IL-1β stability in macrophages.
a Representative immunoblots of pro-IL-1β and β-actin in cell lysates from cycloheximide (CHX)-chase experiments on peritoneal macrophages from mice of indicated genotypes given tamoxifen to induce Ube2l3-deletion in vivo. Cells were treated with LPS (250 ng.mL−1) for 14 h followed by CHX (10 μg.mL−1) for the indicated times. MG132 (10 μM) was added for the last 3 h in the indicated samples. b Rates of turnover of pro-IL-1β in WT (Ube2l3fx/fx) and KO (Ube2l3ΔMac) macrophages. Immunoblots of CHX-chase experiments as described in a in peritoneal macrophages and primary BMDMs (Fig. S1F) were quantified, and the percentage of pro-IL-1β normalised to β-actin relative to Time = 0 h is plotted. Half-live (t1/2) ± 95 % confidence interval (CI) are indicated; shaded regions indicate 95 % CI of the fit. c Relative expression of Il1b mRNA normalised to Gapdh in peritoneal macrophages isolated from WT (Ube2l3fx/fx) and KO (Ube2l3ΔMac) mice. Cells were treated with LPS (250 ng.mL−1) for 14 h. d Representative immunoblots of UBE2L3 and β-actin in cell lysates of iBMDMs of the indicated genotypes treated with 4-hydroxytamoxifen (2 μM, 48 h). e Representative immunoblots of cell lysates and supernatants of primary BMDMs of the indicated genotypes given 4-hydroxytamoxifen (2 μM, 48 h) followed by LPS (250 ng.mL−1, 6 h) and nigericin (50 μM, 1 h) to activate inflammasomes. f–h Quantification of secreted IL-1β (f) and IL-6 (g) by ELISA and pyroptosis (h) in primary BMDMs of the indicated genotypes treated with LPS (250 ng.mL−1) for the indicated times followed by nigericin (50 μM, 1 h). Pyroptosis was measured using propidium iodide (PI) dye uptake assays. WT = Ube2l3fx/fx; KO = Ube2l3ΔMac. Number of independent experiments (n) as follows: a, n = 2; b, n = 5; c, n = 3 mice; d, n = 4; e, n = 3; f–h, n = 3. Each dot in c, and small dots in f–h represents an independent repeat. Data distribution is depicted in c with violin, box (25th to 75th percentile, line at median), and whiskers ( ± 1.5 x IQR); in b, f–h with mean (large symbol) and SEM error bars. Two-tailed P values for indicated comparisons from mixed effects ANOVA; ns = not significant (P > 0.05).
Fig. 4
Fig. 4. siRNA screen identifies the E3 ligases TRIP12 and AREL1 in promoting pro-IL-1β turnover.
a Representative immunoblots of cell lysates from iBMDMs stably expressing doxycycline (Dox)-inducible proIL-1βStrep treated with the indicated inhibitors. Cells were treated with Dox (500 ng.mL−1) for 6 h, washed, and incubated for 18 h (‘chased’); inhibitors or the vehicle DMSO was added for the last 3 h. Cell lysate collected at 6 h (sample labelled (—)) served as a control. b Representative immunoblots showing the effect of silencing UBE2L3 on the abundance of Dox-induced pro-IL-1βStrep. pLTREK-proIL-1βStrep iBMDMs were transfected with non-targeting Control or UBE2L3 siRNA for 72 h, followed by Dox treatment (500 ng.mL−1) and a 3 h chase as indicated. c Schematic depiction of the siRNA screen against 43 HECT and RBR E3 ligases in pLTREK2-pro-IL-1βStrep iBMDMs. Cells in 96-well plates were screened independently repeated n = 3 times with technical duplicates within each repeat. Cells were transfected with siRNA for 72 h, treated with Dox, and intracellular pro-IL-1βStrep was quantified by ELISA. z* score, SSMD* and P values were calculated as described in Methods. d Summary plot from siRNA screen described in c. Mean z* score and SSMD* from three independent repeats are plotted, with controls and siRNA depicted in different colours as indicated in the legend. e Results from the siRNA in screen described in c. Size of the symbols indicates mean of z* scores from three independent repeats. FDR-adjusted P values for comparison for each of the siRNA with the ‘Ctrl_18 h’ group are plotted after a -log10 transformation. Shapes of the symbols denote controls and P value cut-off (indicated with a dotted line at P = 0.01). The colour scheme indicates divergent SSMD* scores. Trip12 and Arel1 scored above thresholds. Images in a, b represent experiments done n = 3 times. Each dot in d, e represents one gene or control conditions in the siRNA screen, which was independently repeated n = 3 times.
Fig. 5
Fig. 5. TRIP12 and AREL1 interact with UBE2L3, promote pro-IL-1β clearance and suppress mature IL-1β production.
a–c Increased abundance of endogenous pro-IL-1β upon Trip12 or Arel1 silencing. iBMDMs were transfected with non-targeting Control or the indicated siRNA for 72 h followed by treatment with LPS (250 ng.mL−1) for 18 h. Representative immunoblots for endogenous pro-IL-1β (a), quantification of intracellular pro-IL-1β by ELISA (b) and relative expression of Il1b transcript normalised to Gapdh (c) are shown. c Representative images from immunoprecipitation (IP) and immunoblot (IB) experiments showing the interaction of endogenous UBE2L3 and transiently expressed UBE2L3His with AREL1 and TRIP12 in HEK293E cells. Anti-FP (fluorescent protein) antibody detects both GFP and Venus tags. e Representative images from IP and IB experiments showing the interaction between AREL1 and TRIP12 upon transient expression of the indicated proteins in HEK293E cells. Anti-FP (fluorescent protein) antibody detects both GFP and Venus tags. f Representative immunoblots from experiments assessing the abundance of pro-IL-1β in lysates of iBMDMs stably expressing YFP-UBE2L3. Cells were transfected with nontargeting Control or the indicated siRNA for 72 h and then treated with LPS (250 ng.mL−1) for the indicated times. g Representative immunoblots from experiments assessing the abundance of pro-IL-1β in lysates from of iBMDMs given non-targeting Control or the indicated siRNA for 72 h followed by treatment with LPS (250 ng.mL−1) for 24 h. h-j Quantification of IL-1β (h) and IL-6 (i) in supernatants by ELISA and pyroptosis (j) of iBMDMs given the indicated siRNA for 72 h, followed by inflammasome activation with LPS (250 ng.mL−1, 3 h) and nigericin (50 μM, 1 h). Images represent independent experiments (n) as follows: a, f, g, n = 3; d, e, n = 2. In b-c, h–j each dot represents a biologically independent experiment (n = 6 in b, n = 4 in c, n = 5 in h–j). Data distribution is depicted with violin, box (25th to 75th percentile, line at median), and whiskers ( ± 1.5 x IQR). Two-tailed P values for comparisons with samples given Control siRNA in b-c, h-j from mixed-effects ANOVA. ns – not significant (P > 0.05).
Fig. 6
Fig. 6. TRIP12 and AREL1 ubiquitylate pro-IL-1β in the N-terminal ‘pro’ domain.
a-b Representative immunoblots from Ni-NTA pull-downs of pro-IL-1βHis under denaturing conditions to assess the type of ubiquitin chains covalently added on pro-IL-1β by TRIP12 (a) or AREL1 (b). HEK293E cells stably expressing pro-IL-1βHis were transfected with HA-tagged wildtype or the indicated K→R mutants of ubiquitin along with GFP-TRIP12 (a) or AREL-HECTMyc (b) or Venus as negative control. Expression of proteins is shown below (Inputs). Also see Fig. S4B, C for additional blots from the same experiments. c Multiple sequence alignment of pro-IL-1β from the indicated organisms showing sequences flanking ‘pro’ domain lysine residues in the mouse (30, 32, 58 and 72) and human. Sequences around lysine 133 in the mature IL-1β region are also shown. B. tau – Bos taurus, C. lup – Canis lupus familiaris, H. sap – Homo sapiens, M. mul – Macaca mulatta, M.mus – Mus musculus, P. tro – Pan troglodytes, R. nor – Rattus norvegicus. d, e Representative images from TUBE pull-downs assays of wildtype or the indicated K→R variants of pro-IL-1β to assess their ubiquitylation by TRIP12 (d) or AREL1 (e). HEK293E cells were transfected with plasmids encoding the indicated pro-IL-1β variants (wildtype, 4 R (K30,32,58,72 R) and 5 R (K30,32,58,72,133 R)) and GFP-TRIP12 (d) or AREL1-HECTMyc (e) and Venus as negative control. Ubiquitylated proteins bound to HisTUBE were enriched and immunoblotted with anti-IL-1β antibody. Polyubiquitylated pro-IL-1β smears are labelled (polyUbi), and expression of proteins is shown below (Inputs). Images from the same exposure of the same immunoblots are shown in e with intervening lanes removed. f Representative immunoblots of cycloheximide (CHX)-chase experiments showing increased stability of the indicated variants of pro-IL-1β as compared to wildtype protein. HEK293E cells were transfected with plasmids coding for the indicated pro-IL-1β proteins, and treated with CHX (10 μg.mL−1) for the indicated times 18 h after transfection. Half-life (t1/2) calculated from n = 8 independent experiments is reported below (also see Fig. S3E). g Representative immunoblots showing similar proteolytic maturation of pro-IL-1β variants by caspase-1. HEK293E cells were transfected with plasmids encoding wildtype or mutant pro-IL-1β without or with caspase-1 and ASC-CFP for 18 h, and cell lysates immunoblotted with the indicated antibodies. Ratio of the intensity of mature IL-1β p17 and active caspase-1 p20 bands are indicated (mean ± SD from n = 3 independent experiments). Images represent independent experiments (n) as follows: a-b, d-e, g, n = 3; f, n = 8.

References

    1. Mantovani A, Dinarello CA, Molgora M, Garlanda C. Interleukin-1 and Related Cytokines in the Regulation of Inflammation and Immunity. Immunity. 2019;50:778–795. doi: 10.1016/j.immuni.2019.03.012. - DOI - PMC - PubMed
    1. Evavold CL, Kagan JC. Diverse Control Mechanisms of the Interleukin-1 Cytokine Family. Front. Cell Dev. Biol. 2022;10:910983. doi: 10.3389/fcell.2022.910983. - DOI - PMC - PubMed
    1. Kayagaki N, et al. Non-canonical inflammasome activation targets caspase-11. Nature. 2011;479:117–121. doi: 10.1038/nature10558. - DOI - PubMed
    1. Martinon F, Petrilli V, Mayor A, Tardivel A, Tschopp J. Gout-associated uric acid crystals activate the NALP3 inflammasome. Nature. 2006;440:237–241. doi: 10.1038/nature04516. - DOI - PubMed
    1. Rathinam VAK, Zhao Y, Shao F. Innate immunity to intracellular LPS. Nat. Immunol. 2019;20:527–533. doi: 10.1038/s41590-019-0368-3. - DOI - PMC - PubMed

Publication types