. 2023 Jul 20;14(1):4387.
doi: 10.1038/s41467-023-39867-7.

The copy number and mutational landscape of recurrent ovarian high-grade serous carcinoma

Collaborators, Affiliations

The copy number and mutational landscape of recurrent ovarian high-grade serous carcinoma

Philip Smith et al. Nat Commun. .

Erratum in

Abstract

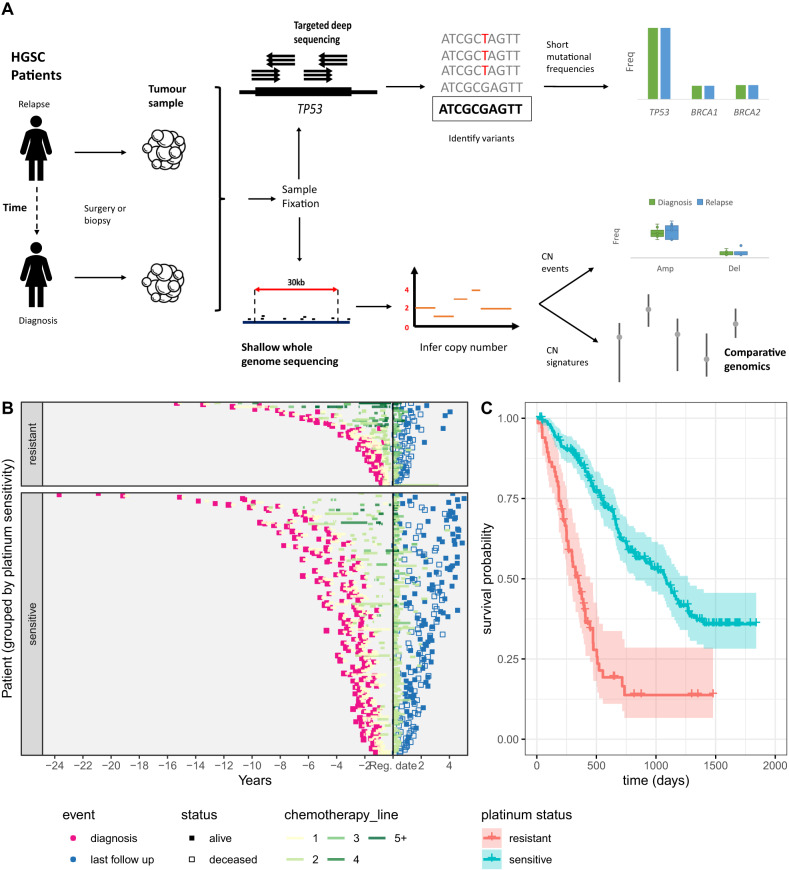
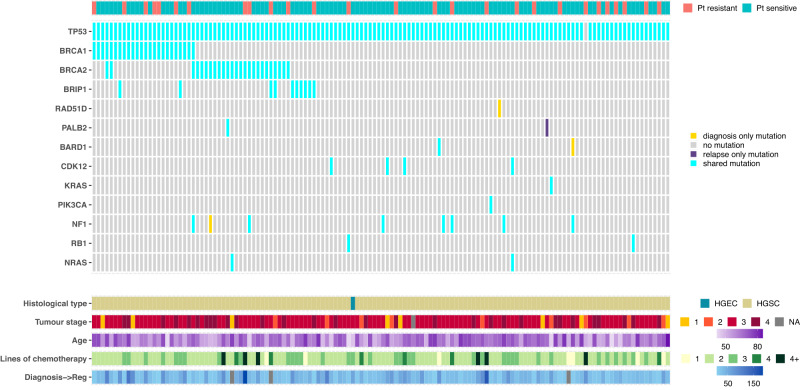
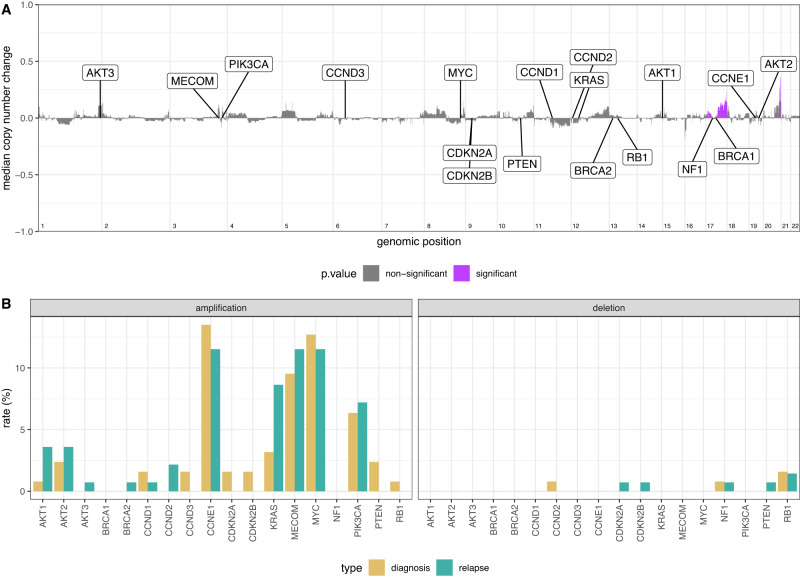
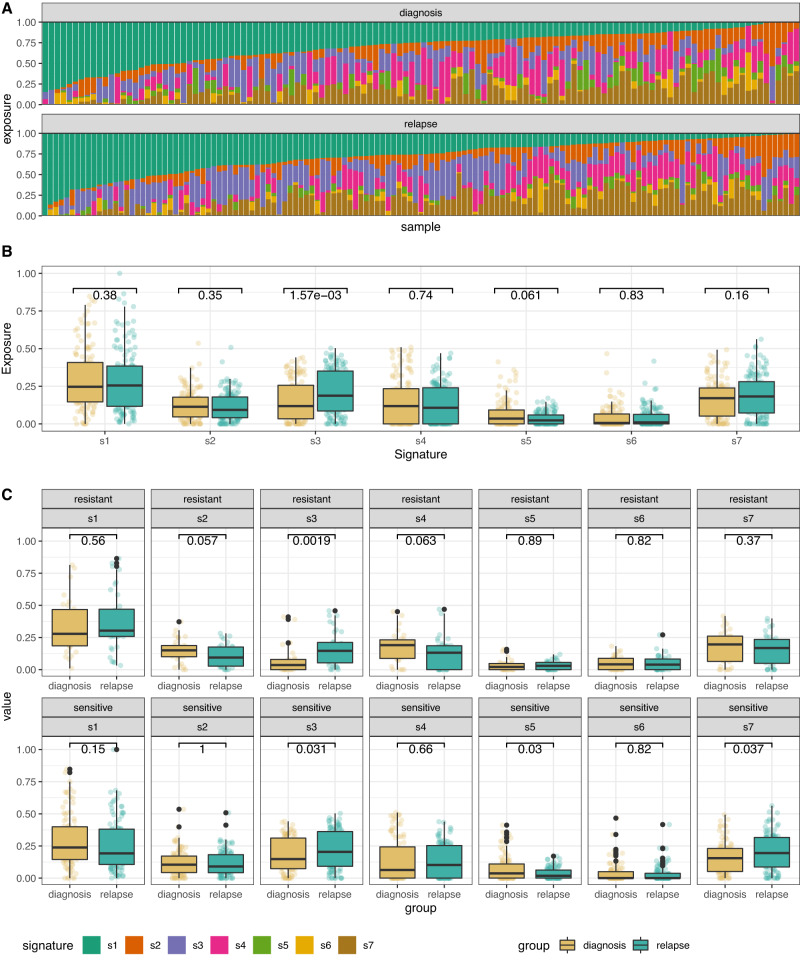
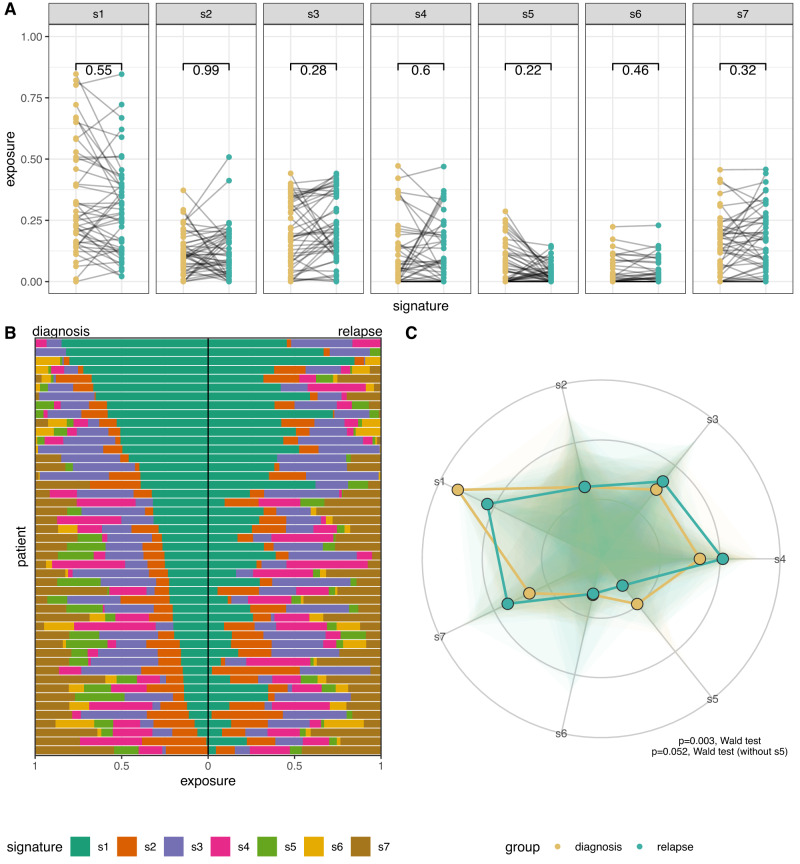
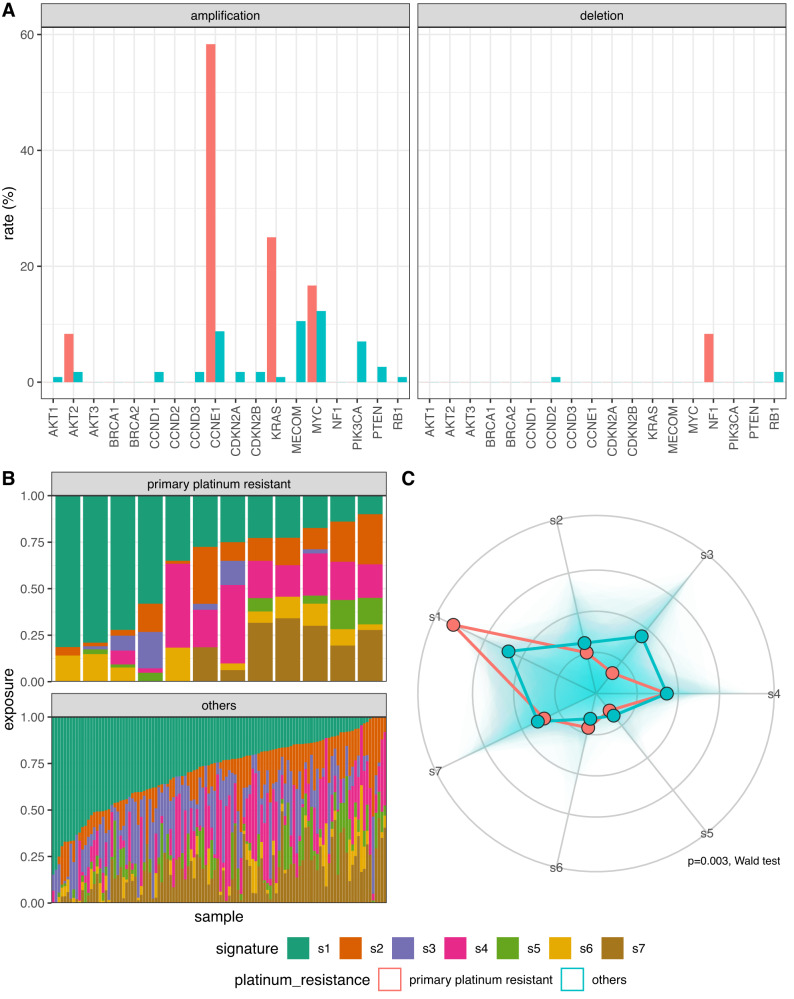
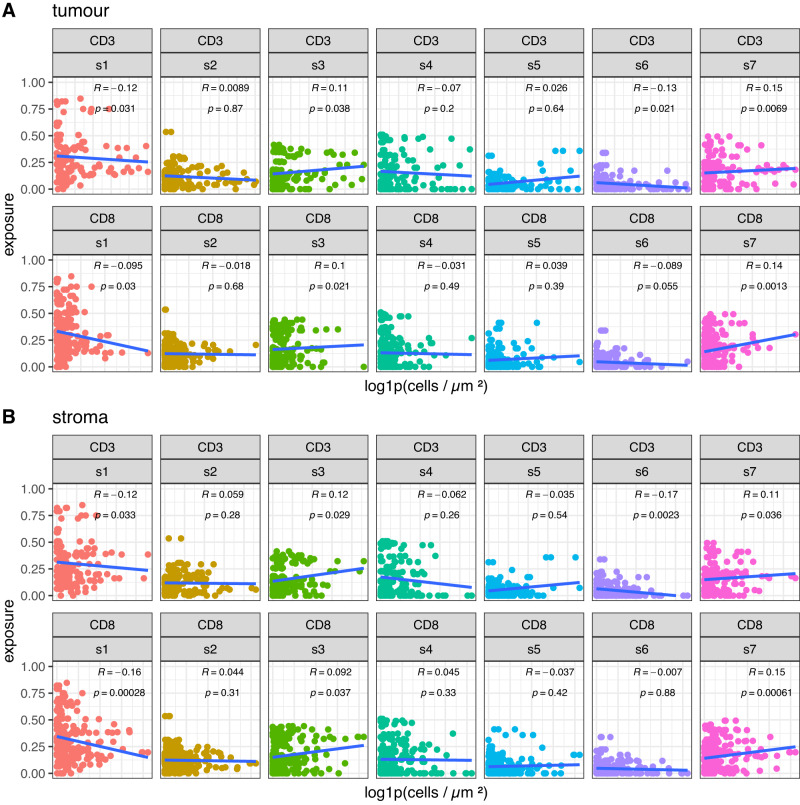
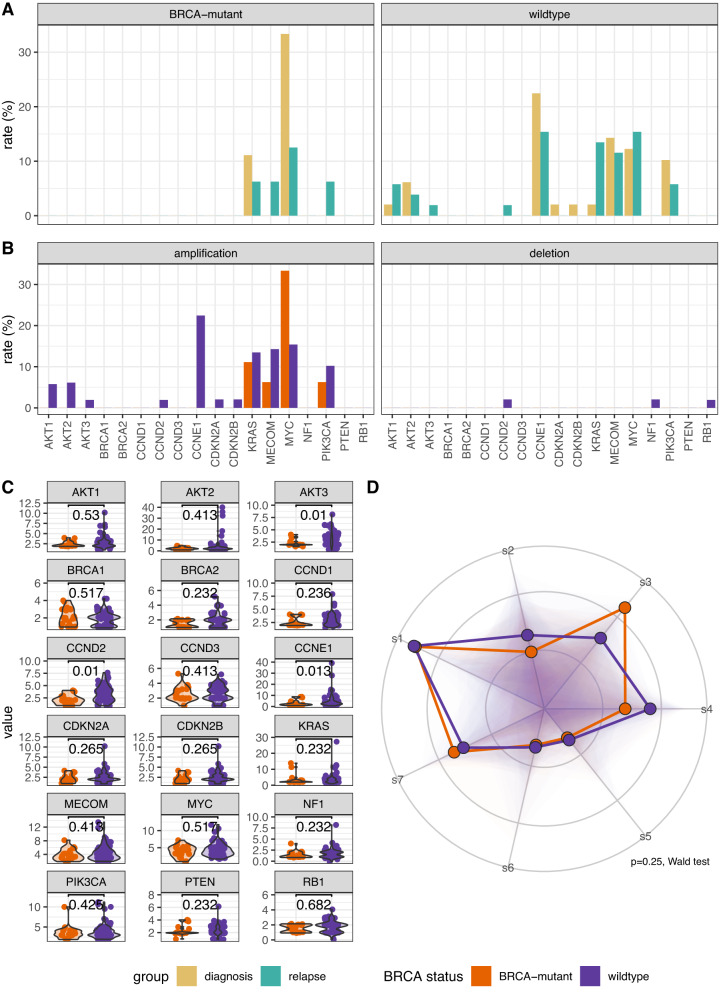
The drivers of recurrence and resistance in ovarian high grade serous carcinoma remain unclear. We investigate the acquisition of resistance by collecting tumour biopsies from a cohort of 276 women with relapsed ovarian high grade serous carcinoma in the BriTROC-1 study. Panel sequencing shows close concordance between diagnosis and relapse, with only four discordant cases. There is also very strong concordance in copy number between diagnosis and relapse, with no significant difference in purity, ploidy or focal somatic copy number alterations, even when stratified by platinum sensitivity or prior chemotherapy lines. Copy number signatures are strongly correlated with immune cell infiltration, whilst diagnosis samples from patients with primary platinum resistance have increased rates of CCNE1 and KRAS amplification and copy number signature 1 exposure. Our data show that the ovarian high grade serous carcinoma genome is remarkably stable between diagnosis and relapse and acquired chemotherapy resistance does not select for common copy number drivers.


Conflict of interest statement

G.M., F.M., A.M.P. and J.D.B. are founders and shareholders of Tailor Bio Ltd. The remaining authors declare no competing interests.

Figures

Fig. 1
Fig. 1. BriTROC-1 Study scheme, recruitment timelines and overall survival.
A Visual representation of study recruitment and data analysis pipeline. A workflow for the procedures, experiments and analyses conducted as part of this study. Patient samples were processed in parallel for short variant and copy number analysis. B Timeline representing the clinical course and outcomes of BriTROC-1 patients (n = 269). Each row represents a study participant; black vertical line represents the time of recruitment. Initial primary tumour diagnosis date is shown in pink and last follow up date at study end is shown in blue. Participants who died are shown as an unfilled point. Orange segments represent chemotherapy treatments and timescale of treatments, each subsequent treatment course is shown up to four. Treatment courses of 5 or more are aggregated. C Kaplan–Meier survival analysis for all patients enrolled into BriTROC-1 from the point of study entry stratified by platinum status. Crosses indicate right-censored data. The shaded areas indicate log-transformed upper and lower 95% confidence intervals computed from the standard error of the estimator of cumulative hazard for each condition.
Fig. 2
Fig. 2. Paired short-variant analysis from 134 diagnosis/relapse sample pairs.
Each column represents one patient and variants are not classified as either somatic or germline. Three cases had diagnosis-only mutations: patient 51 (NF1 c.6643-3del), patient 101 (RAD51D p.Gln175Ter) and patient 163 (BARD1 p.Val767Ala). Patient 139 had a relapse-only mutation in PALB2 (p.Lys1163Glu). Abbreviations: Pt - Platinum. HGSC - High grade serous carcinoma, HGEC - High grade endometrioid carcinoma. Tumour stage refers to stage at the time of diagnosis; Age refers to age at study entry; Lines of chemotherapy refers to the number of lines of chemotherapy prior to enrolment into BriTROC-1. Diagnosis-Reg denotes the interval (in months) between diagnosis and registration into BriTROC-1.
Fig. 3
Fig. 3. Copy number alterations.
A Genome-wide subtraction plot to visualise copy number differences between diagnosis and relapse in 47 matched pairs. Positive values indicate an increase in copy number state and a negative value indicates a decrease in copy number state at relapse. Purple peaks represent genomic regions (30 kb bins) with significantly altered copy number between the diagnosis and relapse tumours (chromosome-specific FDR-corrected two-sided Mann–Whitney U test). Eighteen key and frequently altered genes in HGSC are highlighted. B Rates of focal amplification and deletion for the same eighteen genes (n = 126 and n = 139, diagnosis and relapse samples, respectively).
Fig. 4
Fig. 4. Unpaired copy number signatures.
A Copy number signature spectrum across all samples. Stacked bar plots do not align between diagnosis and relapse groups due to different sample numbers (n = 126 and n = 139, diagnosis and relapse, respectively). B Boxplot demonstrating the unpaired copy number signature exposures between the diagnosis and relapse tumours (n = 126 and n = 139, diagnosis and relapse, respectively). Individual data points are overplotted. Statistics shown is a two-sided Mann–Whitney U test, without adjustments for multiple comparisons. C Boxplot demonstrating copy number signature distributions in unpaired copy number between diagnosis and relapse tumours, stratified by platinum status (n = 30, n = 36, n = 96, and n = 103, diagnosis resistant, relapse resistant, diagnosis sensitive, and relapse sensitive, respectively). Statistics shown is a two-sided Mann–Whitney U test, without adjustments for multiple comparisons. Boxplots show the lower and upper hinges corresponding to the first and third quartiles (the 25th and 75th percentiles). The whiskers extend from the hinge to the largest value no further than 1.5 × interquartile range from the hinge.
Fig. 5
Fig. 5. Paired copy number signatures.
A Paired copy number signature exposures between the diagnosis and relapse tumours in 47 paired samples. B Copy number signature spectrum of paired copy samples. Each horizontal bar represents one patient, ranked by signature 1 exposure in the diagnosis sample (n = 47). Statistics shown is a two-sided Wilcoxon signed-rank test, without adjustments for multiple comparisons. C Radar plot of diagnosis and relapse copy number signature exposures. The distribution for all signature exposures for each comparison group is visualised using a shaded polygon. The radial points indicate the inverse ILR transformation of beta intercept and beta intercept + beta slope for each signature generated during signature modelling, for diagnosis and relapse groups, respectively. The difference in global signature abundance between diagnostic and relapse samples is significant when including signature 5 but non-significant without signature 5 (p = 0.003 & p = 0.052, respectively, two-sided Wald test).
Fig. 6
Fig. 6. Copy number signatures stratified by primary platinum-based treatment resistance.
A Copy number alteration rates for 18 frequently altered genes in diagnosis samples from BriTROC-1 patients relapsing within 6 months of completing first-line platinum chemotherapy (‘primary platinum resistant’) (n = 12) compared to all other patients (n = 114). B Copy number signature exposures and (C) Radar plot of primary platinum resistant cases and others copy number signature exposures. The distribution for all signature exposures for each comparison group is visualised using a shaded polygon. The radial points indicate the inverse ILR transformation of beta intercept and beta intercept + beta slope for each signature generated during signature modelling, for primary platinum resistant and all others, respectively. Differences in global abundance of copy number signatures between primary platinum resistant cases and all other samples was significantly different (p = 0.003, two-sided Wald test) driven by differences in s1 and s3.
Fig. 7
Fig. 7. IHC-derived immune marker signature correlation plots.
Stratified correlations plot for IHC-derived CD3+ and CD8+ cell densities against copy number signatures. A Tumour and (B) Stroma. Solid blue lines are fitted linear regressions, R values are the Kendall tau correlation coefficient and associated p values for the significance of the given correlation. Calculated p values may not accurately estimate the strength of the correlation for each immune marker vs copy number signature due to the compositional nature of copy number signatures and intra-patient dependencies associated with the immune marker image data (CD3 = 158 & 58; CD8 = 239 & 90, IHC images and samples respectively). Statistics shown is a two-sided Kendall rank correlation coefficient test, without adjustments for multiple comparisons.
Fig. 8
Fig. 8. Copy number alterations and signatures stratified by BRCA status.
A Copy number amplification rates for 18 frequently altered genes in paired samples with or without pathogenic alterations in BRCA1/2, stratified by diagnosis or relapse (n = 9, 16, 49, & n = 52, BRCA-mutant diagnosis and relapse, BRCA-wildtype diagnosis and relapse, respectively). B Copy number alteration rates for 18 frequently altered genes in paired samples alterations in BRCA or without (BRCA-mutant and wildtype, respectively), stratified by amplification or deletion event types (n = 25, & n = 101, BRCA-mutant and wildtype, respectively). C Absolute copy number state violin plots for the 18 frequently altered genes between paired BRCA and non-BRCA samples (n = 25, & n = 101, BRCA-mutant and wildtype, respectively). Individual data points are overplotted. Statistics shown is a two-sided Mann–Whitney U test, without adjustments for multiple comparisons. D Radar plot of BRCA-mutant and wildtype copy number signature exposures. The distribution for all signature exposures for each comparison group is visualised using a shaded polygon. The radial points indicate the inverse ILR transformation of beta intercept and beta intercept + beta slope for each signature generated during signature modelling, for BRCA-mutant and wildtype, respectively. Differences in global abundance of copy number signatures between BRCA-mutant and wildtype samples was significantly different (p = 0.25, two-sided Wald test; n = 49 and n = 216, BRCA-mutant and wildtype, respectively).

References

    1. Ahmed AA, et al. Driver mutations in TP53 are ubiquitous in high grade serous carcinoma of the ovary. J. Pathol. 2010;221:49–56. - PMC - PubMed
    1. Gorringe KL, et al. High-resolution single nucleotide polymorphism array analysis of epithelial ovarian cancer reveals numerous microdeletions and amplifications. Clin. Cancer Res. 2007;13:4731–4739. - PubMed
    1. TCGA. Integrated genomic analyses of ovarian carcinoma. Nature. 2011;474:609–615. - PMC - PubMed
    1. Ciriello G, et al. Emerging landscape of oncogenic signatures across human cancers. Nat. Genet. 2013;45:1127–1133. - PMC - PubMed
    1. Morgan RD, et al. Objective responses to first-line neoadjuvant carboplatin-paclitaxel regimens for ovarian, fallopian tube, or primary peritoneal carcinoma (ICON8): post-hoc exploratory analysis of a randomised, phase 3 trial. Lancet Oncol. 2021;22:277–288. - PMC - PubMed

Publication types

MeSH terms