. 2023 Jul 20;14(1):4306.
doi: 10.1038/s41467-023-39950-z.

Herbarium specimen sequencing allows precise dating of Xanthomonas citri pv. citri diversification history

Affiliations

Herbarium specimen sequencing allows precise dating of Xanthomonas citri pv. citri diversification history

Paola E Campos et al. Nat Commun. .

Abstract

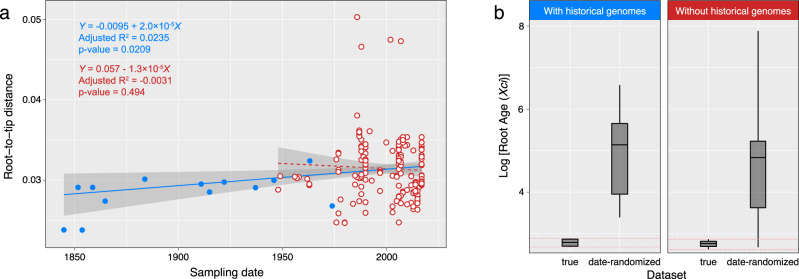
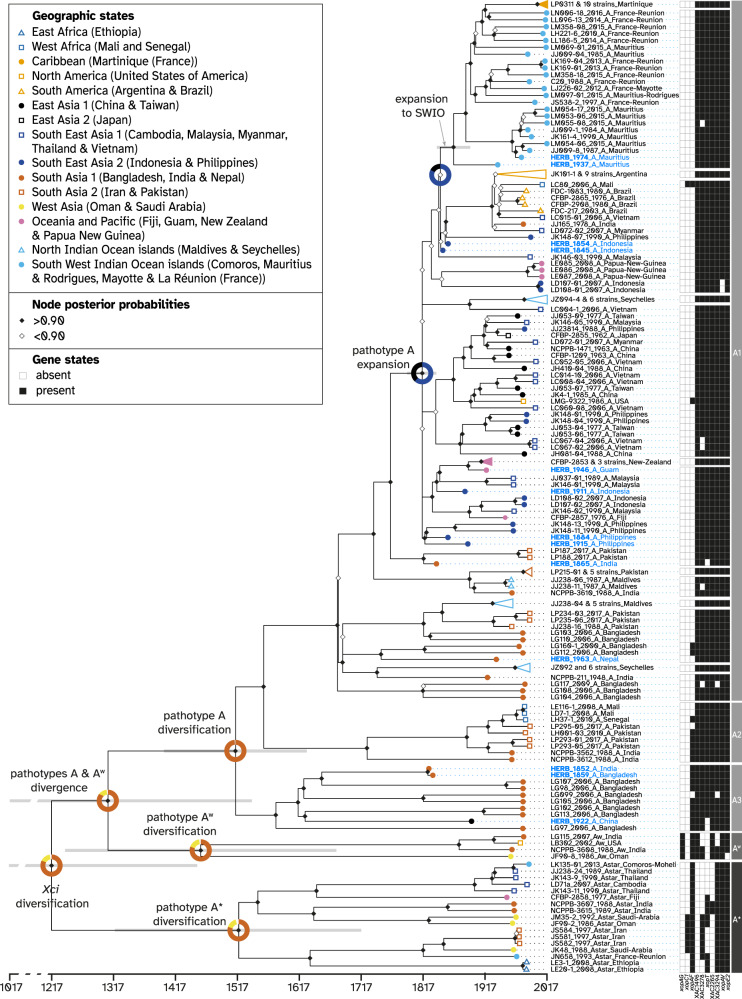
Herbarium collections are an important source of dated, identified and preserved DNA, whose use in comparative genomics and phylogeography can shed light on the emergence and evolutionary history of plant pathogens. Here, we reconstruct 13 historical genomes of the bacterial crop pathogen Xanthomonas citri pv. citri (Xci) from infected Citrus herbarium specimens. Following authentication based on ancient DNA damage patterns, we compare them with a large set of modern genomes to estimate their phylogenetic relationships, pathogenicity-associated gene content and several evolutionary parameters. Our results indicate that Xci originated in Southern Asia ~11,500 years ago (perhaps in relation to Neolithic climate change and the development of agriculture) and diversified during the beginning of the 13th century, after Citrus diversification and before spreading to the rest of the world (probably via human-driven expansion of citriculture through early East-West trade and colonization).


Conflict of interest statement

The authors declare no competing interests.

Figures

Fig. 1
Fig. 1. Post-mortem DNA damage patterns measured on reads mapping to the Xci chromosome.
a Fragment length distribution (nt: nucleotides; relative frequency in arbitrary units). b Substitution percentage of the first 25 nucleotides of R2 reads (5’ C to T substitutions, left panel), complementary to the last 25 nucleotides of R1 reads (3’ G to A substitutions, right panel) of the 13 historical genomes (blue lines, light to dark gradient from the oldest to the youngest) and three modern Xci strains (red lines, light to dark gradient from the oldest to the youngest). Source data are provided as a Source Data file.
Fig. 2
Fig. 2. Root-to-tip regression and date-randomization temporal test.
a Root-to-tip linear regression lines plotted either in blue solid line when integrating historical genomes (blue dots, n = 184), and in red dashed line when only computed from modern genomes (white dots with red line, n = 171). Gray areas (error bands) indicate 95% confidence intervals. Associated values are the linear regression equation, adjusted R² and p-value obtained from a two-sided Student test under the null hypothesis of a slope equal to zero, with (n−1) degrees of freedom (significant only when including historical genomes). b Evaluating temporal signal in the dataset by date-randomization test showed no overlap between the age of the root estimated from the real and date-randomized datasets (summed up in a single box) when historical genomes were included (left). Boxplots display the five following summary statistics: minimum, first quartile, median, third quartile and maximum of the 95% highest posterior density intervals. Statistics were computed from n = 10,000 iterations. Source data are provided as a Source Data file.
Fig. 3
Fig. 3. Spatiotemporal Bayesian reconstruction of Xci evolutionary history.
Dated phylogenetic tree including 13 historical specimens (blue labels) and 171 modern strains (black labels) built from 13,007 recombination-free SNPs. Node support values are displayed by diamonds; node bars cover 95% highest probability density of node height. Branch tips are colored according to the sample’s geographic origin. Groups of closely related strains were collapsed for better visibility; details of each group can be found in Fig. S2. Reconstructed ancestral geographic states are represented at some nodes of interest with pie charts representing the posterior probability of geographical regions as the origin of the node. Strain labels include strain name, collection year, pathotype, and country of origin. Presence and absence of 10 variably present pathogeny-associated genes are indicated next to strain labels by black squares and white squares, respectively. Pathotypes and lineages are indicated to the right. Source data are provided as a Source Data file.

References

    1. Dark P, Gent H. Pests and diseases of prehistoric crops: a yield 'honeymoon' for early grain crops in Europe? Oxford J. Archaeol. 2001;20:59–78. doi: 10.1111/1468-0092.00123. - DOI
    1. Mira A, Pushker R, Rodriguez-Valera F. The Neolithic revolution of bacterial genomes. Trends Microbiol. 2006;14:200–206. doi: 10.1016/j.tim.2006.03.001. - DOI - PubMed
    1. Stukenbrock EH, McDonald BA. The origins of plant pathogens in agro-ecosystems. Annu. Rev. Phytopathol. 2008;46:75–100. doi: 10.1146/annurev.phyto.010708.154114. - DOI - PubMed
    1. Anderson PK, et al. Emerging infectious diseases of plants: pathogen pollution, climate change and agrotechnology drivers. Trends Ecol. Evol. 2004;19:535–544. doi: 10.1016/j.tree.2004.07.021. - DOI - PubMed
    1. McCann HC. Skirmish or war: the emergence of agricultural plant pathogens. Curr. Opin. Plant Biol. 2020;56:147–152. doi: 10.1016/j.pbi.2020.06.003. - DOI - PubMed

Publication types

Supplementary concepts