. 2023 Jul 20;14(1):4253.
doi: 10.1038/s41467-023-39817-3.

Tumor-derived GDF-15 blocks LFA-1 dependent T cell recruitment and suppresses responses to anti-PD-1 treatment

Affiliations

Tumor-derived GDF-15 blocks LFA-1 dependent T cell recruitment and suppresses responses to anti-PD-1 treatment

Markus Haake et al. Nat Commun. .

Abstract

Immune checkpoint blockade therapy is beneficial and even curative for some cancer patients. However, the majority don't respond to immune therapy. Across different tumor types, pre-existing T cell infiltrates predict response to checkpoint-based immunotherapy. Based on in vitro pharmacological studies, mouse models and analyses of human melanoma patients, we show that the cytokine GDF-15 impairs LFA-1/β2-integrin-mediated adhesion of T cells to activated endothelial cells, which is a pre-requisite of T cell extravasation. In melanoma patients, GDF-15 serum levels strongly correlate with failure of PD-1-based immune checkpoint blockade therapy. Neutralization of GDF-15 improves both T cell trafficking and therapy efficiency in murine tumor models. Thus GDF-15, beside its known role in cancer-related anorexia and cachexia, emerges as a regulator of T cell extravasation into the tumor microenvironment, which provides an even stronger rationale for therapeutic anti-GDF-15 antibody development.


Conflict of interest statement

M.H., T.S., M. Mehling, M. Selle, R.D., B.W., and J.W. are inventors on patents related to GDF-15 as a biomarker and therapeutic target. M.H., T.S., and J.W. are co-founders of the biotech company CatalYm GmbH involved in translating GDF-15-based cancer therapies and diagnostics into the clinics. M.H., T.S., M.R., E.L., and C.S.W. are current or former employees and stock owners of CatalYm. N.V., S.G., M.C.G., K.E., and P.R.R. are current or former employees of CatalYm. R.R. is a partner of Forbion Capital partners who are invested in CatalYm. R.D. has intermittent, project-focused consulting and/or advisory relationships with Novartis, Merck Sharp & Dohme (MSD), Bristol-Myers Squibb (BMS), Roche, Amgen, Takeda, Pierre Fabre, Sun Pharma, Sanofi, Catalym, Second Genome, Regeneron, Alligator, T3 Pharma, MaxiVAX SA and touchIME outside the submitted work. A.B. is scientific cofounder and advisor of Aamuthera Biotech GmbH and DualYX NV that are not related to this work. K.W.H., H.H., F.N., R.D., and J.W. have received research funding via Catalym GmbH. Other authors declare no competing interests in this work.

Figures
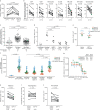
Fig. 1
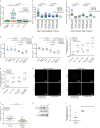
Fig. 1. GDF-15 interferes with T cell adhesion to activated endothelial cells.
a Effects of recombinant human (rh)GDF-15 (added for 10 min) on CXCL12α−mediated adhesion of whole blood-derived CD45+ cells to activated human lymphatic endothelial cells (huLEC) were analyzed. Adherence was calculated based on the number of CD45+ cells as enumerated by flow cytometry (n = 7 experiments). In b, adhering leukocytes were further characterized by multicolor staining (n = 10 experiments). c Stimulated T cells from 6 donors were treated or not with rhGDF-15 for 20 min before being run in µ-slides over a layer of activated huLEC. 10 predefined fields of view were video-imaged for 5 s and the number of T cells adhering under hydrodynamic flow conditions was counted. Different shadings indicate different T cell donors. For reference, adhesion to non-activated huLEC is shown for one donor. d Enumeration of T cells adhering to human umbilical vein endothelial cells (HUVEC). 5 predefined fields of view per sample were analyzed in a representative experiment. In e, CXCL9 and CXCL10 were used to induce adhesion of untreated or GDF-15-treated CD8+ T cells from 3 different donors on stimulated huLEC. In f, stimulated CD8+ T cells from 3 different donors were treated with rhGDF-15 and anti-GFRAL or isotype control antibodies for 20 min before being run in µ-slides over a layer of activated huLEC. In gj, phase-contrast microscopy in chamber slides to assess effects of rhGDF-15 on T cell adhesion to activated HUVEC. An EC50 value for rhGDF-15-mediated adhesion inhibition on pan T cells from 3 different donors was determined in g (logICF=logIC50 + (1/HillSlope)*log(F/(100-F)). hj Using pan T cells from 9 different donors, effects of rhGDF-15 on T cell adhesion (h), transmigration (i) and recruitment (j) were analyzed. Statistical analyses were performed by one-way ANOVA in a, d, f, by two-sided paired Student´s t-tests in b, e, h, i, j, by mixed-effects analysis in c. To correct for multiple comparisons, Tukey´s post hoc test was applied in a, c, d, Bonferroni´s method in b. In c, d, g, mean values with SEM, in e, f, median values are indicated as horizontal lines. Source data are provided as a Source Data file.
Fig. 2
Fig. 2. GDF-15 interferes with LFA-1-dependent adhesion of human T cells.
ac µ-slides were coated with CXCL12α and vehicle or ICAM-1-Fc (a–c), MAdCAM-1-Fc (b), or VCAM-1-Fc (c). Stained primary human T cells were stimulated with anti-CD3/CD28 before GDF-15, or vehicle, or antibodies against adhesion molecules LFA-1, α4β7 integrin, or VCAM-1 were added for 30 min. T cells were perfused for 6 min over the coated µ-slides. Adhesion was recorded by live microscopy and analyzed using CellProfiler software. In d, e, CD4+ and CD8+ T cells were pre-treated for 20 min with GDF-15, or blocking anti-LFA-1 antibody TS1/18, or both, and run over activated HUVEC as in (1ei). f, g Binding of conformation-specific anti-active LFA-1 antibody mAb24 (f) or ICAM-Fc (g) to CD8+ T cells was analyzed. Whole blood from healthy volunteers was maintained at 37 °C and treated or not with GDF-15 10 min prior to LFA-1 activation. Fluorescence-conjugated antibodies and complexed soluble ICAM-1-Fc were added for another 10 min. Cells were fixed and analyzed on an Attune Nxt flow cytometer. Mean fluorescent intensity (MFI) values were normalized to control conditions by z-transformation. h, i, j Human PBMC were stimulated for 30 min with CXCL12α and Mg2+ ± rhGDF-15. Cells were stained with the conformation-specific Alexa Fluor 647-labeled anti-LFA-1 antibody mAb24 (h) or hICAM-1-Fc-AF647 (i). The number of active LFA-1 molecules per single CD3+ T cell was quantified by direct stochastic optical reconstruction microscopy. Representative single cell images are shown in h, i. Data obtained with mAb24 across three different donors are summarized in j. k, l T cells were added to ICAM-1- and E-Selectin-coated Protein G beads, in the absence or presence of GDF-15. After lysis, Talin phosphorylation was assessed by Western blotting, with CD3ε as loading control. A representative blot is shown in k. Protein quantification data from 7 different samples normalized to vehicle (human serum albumin) control are displayed in l. Statistics were calculated by Kruskal–Wallis with Dunn´s post hoc test (a), by one-way ANOVA with Tukey´s correction for multiple comparisons (b–e), and by two-sided paired t-tests (f, g, j, l). Horizontal bars indicate mean (a, f, g) or median (d, e, j, l) values. Source data are provided as Source Data file.
Fig. 3
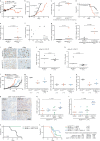
Fig. 3. GDF-15 interferes with immune infiltration and immune-mediated tumor rejection in the MC38 colon cancer model in vivo.
a, b NCInu/nu-mice (6 mice/group) were subcutaneously injected with 5 × 105 MC38blank or MC38tghGDF-15 colon cancer cells. Body weight (a) and tumor sizes (b) were determined twice weekly. ch C57BL/6NCrl–mice were subcutaneously injected with 5 × 105 MC38blank or MC38tghGDF-15 cells. c Tumor take rates. d Representative survival curves (termination criterion: tumor volume > 1200 mm3) shown as Kaplan–Meier plot (detailed statistics in Supplementary Table 1). e hGDF-15 serum levels on day 28 were analyzed by ELISA and f correlated with tumor size. g Antibodies against hGDF-15 were assessed in sera and h correlated with hGDF-15 levels. it C57BL/6NCrl–mice were subcutaneously injected with MC38blank or MC38tghGDF-15 cells. In ik, tumors were explanted when ≥1000 mm3. Tumor-infiltrating CD45+ and CD8+ cells were stained (i) and quantified (j, k). In lo, effects of anti-hGDF-15 antibody on tumor growth (l), and infiltration by CD45+ (m), CD4+ (n) and CD8+ (o) cells are shown. Infiltration was analyzed by flow cytometry from gently dissociated, 300–500 mm3-sized tumors. Preferential rejection of MC38blank tumors and tumor-unrelated deaths caused imbalances between the groups. In pr, MC38tghGDF-15 tumors were treated with vehicle/anti-hGDF-15/anti-PD-1/anti-hGDF-15+anti-PD1. Representative pictures (p), the percentage of tumor-infiltrating CD8+ T cells (q) and a score for perinecrotic CD8+ T cell infiltration (r) are shown. s, t C57BL/6NCRL mice were subcutaneously inoculated with 5 × 105 MC38blank or MC38tghGDF-15 cells. Mice were randomized across the different treatment groups and treated or not with anti-PD-1 antibody ± anti-GDF-15 antibody (t). Kaplan–Meier plots based on survival are displayed. a, b, c, h, q, and r were analyzed by two-sided unpaired t-tests, d and s by log-rank (Mantel-Cox) test. Wilcoxon–Mann–Whitney test was applied to e, g, j, and k. Pearson’s linear regression was calculated in f. In t, tumor growth was compared by Cox proportional hazard models. Individual tumor growth curves for s and t are shown in Supplementary Fig. S4. Horizontal bars depict mean values ± SEM in a, b, l, and median values in c, e, g, j, k, m, n, o, q, r. All experiments were performed at least three times. In a, b, dt, representative experiments are shown. Source data are provided as a Source Data file.
Fig. 4
Fig. 4. GDF-15 blockade synergizes with anti-PD-1 in orthotopic Panc02 tumors and enhances T cell recruitment in syngeneic and humanized mice.
In a, c, d, e, 1 × 104 luciferase-transgenic Panc02 cells (Panc02-luc) were inoculated into the pancreatic head of male albino C57Bl/6J mice. In b, female albino C57Bl/6J mice received 1 × 106 Panc02-Luc cells into the pancreatic tail. After bioluminescence-based randomization on day 5, animals were treated twice weekly with vehicle/anti-hGDF-15/anti-PD-1/anti-hGDF-15+anti-PD1. Bioluminescent in vivo imaging (1–2 times/week) enabled monitoring of tumor growth (countsfinal measurement/countsrandomization). In a, animals were euthanized when symptomatic or on day 29 (see x-axis), in b on day 35. CD4+ (c) and CD8+ (d) T cell infiltration on day 12 were assessed by flow cytometry from disseminated tumors. e Representative stainings for tumor-infiltrating CD8+, Granzyme B+ and Foxp3+ cells. fi 2 × 105 EMT6 murine breast cancer cells were orthotopically injected in female 7–10-week-old BALB/c mice. Anti-GDF-15 or isotype control were administered on days 6, 9, 12. Carboxyfluorescein-succinimidylester (CFSE)-labeled T cells were adoptively transferred on day 13. On day 14, infiltration of transferred CD3+, CD4+ and CD8+ T cells into (explanted) axillary (f) and brachial (g) lymph nodes was assessed by flow cytometry. Tumor size (h) and weight (i) were recorded. jm NOD/SCID/γc-/-FcRγ-/- mice were reconstituted with human hematopoietic stem cells (HSC), injected with patient-derived HV-18-MK (GDF-15high) melanoma transplants, and treated with anti-hGDF-15 or control antibody. Day 24 hGDF-15 serum levels (j) correlated with tumor size for the 3 isotype-treated tumors that could be explanted without being disrupted (Pearson correlation) (k). Tumor-infiltrating human CD45+, CD3+, and CD19+ cells were determined by flow cytometry. Two independent experiments (n = 9 mice/group) are summarized in l. Colors relate to CD34+ HSC donors. In m, the composition of CD3+ T cell immune infiltrates on day 24 is shown for the mice from the second independent experiment. In a, b, tumor growth was analyzed by pairwise Mann–Whitney tests with Bonferroni–Holm correction. In c, d, f, g, h, i, groups were compared by unpaired Student´s t-test. In l and m, Mann–Whitney U-test was performed, using overall cell percentages in m. Horizontal bars indicate mean ± SEM in c, d, f, g, h, i, median values in j, l, m. Source data are provided as a Source Data file.
Fig. 5
Fig. 5. GDF-15 expression is negatively correlated with intratumoral T cell infiltration in brain metastases from melanoma patients and in HPV+ oropharyngeal squamous cell carcinomas.
ad Formalin-fixed paraffin-embedded tissues from melanoma brain metastases from 70 patients were stained by immunohistochemistry for GDF-15 and for the T cell marker proteins CD3 and CD8. Exemplary stainings are shown in a. bd For hGDF-15 expression, a score was based on frequency (0–1% → score 0; 1–10% → score 1; 10–25% → score 2; 25–50% → score 3; >50% → score 4) multiplied with staining intensity (weak → 1, moderate → 2, strong → 3)). eh GDF-15 serum levels were assessed from patients with human papilloma virus (HPV)+ or HPV- oropharyngeal squamous cell carcinomas (OPSCC). Tumor-infiltrating CD8+ T cells per area were quantitated for 37 HPV+ tumors and correlated with the corresponding GDF-15 serum levels (e). fh GDF-15 serum levels were divided into two groups with either GDF-15 < 1.0 ng/ml or GDF-15 ≥ 1.0 ng/ml. Kaplan–Meier plots for disease-specific survival were plotted for these two groups for patients with OPSCC irrespective of HPV status (n = 86) (f), as well as for HPV- (n = 32) (g) and HPV+(n = 54) (h) OPSCC. Spearman´s rank-correlation coefficients (ρ) and p-values are indicated for be. Dotted trend lines were added for visualization. Kaplan–Meier curves were compared by log-rank (Mantel-Cox) test (fh). Source data for bh are provided as a Source Data file.
Fig. 6
Fig. 6. In human melanoma patients GDF-15 serum levels predict response to and survival under therapy with anti-PD-1 antibodies.
a, b GDF-15 levels were analyzed in 37 melanoma patients at baseline of ipilimumab treatment, and correlated with clinical responses based on RECIST v1.1 criteria (a), including durability of initial responses (b). cj GDF-15 levels were analyzed in pre-treatment sera from 34 melanoma patients prior to pembrolizumab treatment (Zurich cohort, ce), and from 88 patients (Tübingen cohort, fj) prior to treatment with pembrolizumab (n = 48) or nivolumab (n = 40). GDF-15 serum levels were correlated with responses according to RECIST v1.1 (c, f). Black circles indicate patients with ongoing responses at the time of analysis. Groups were compared by Mann–Whitney test in ac. In d, g, h, logistic regression models were fitted for response (d, g) or disease control (h) under anti-PD-1 treatment. Dotted vertical lines indicate GDF-15 serum levels (continuous predictor) corresponding to a 50% probability of treatment response. Two extreme values ([GDF-15] ≫ 100 ng/ml) are displayed at the upper end of the scale. In e and i, overall survival of 34 (e), respectively 88 (i) patients was analyzed by Cox proportional hazards model with overall survival (time to death) as outcome variable and GDF-15 as continuous predictor. Kaplan–Meier plots (cut-off: 2.0 ng/ml GDF-15) are shown for visualization (e, i). Further Kaplan–Meier curves including serum lactate dehydrogenase (sLDH) as additional predictor were calculated for the Tübingen cohort (j). Censoring is indicated by vertical lines. In f, p-values were calculated by Kruskal–Wallis test. In f, g, h, one patient whose clinical course contradicted the RECIST1.1-, and therefore target lesion-based classification as complete responder was omitted from statistical consideration. One further patient could not be staged and is therefore neither displayed nor assigned to any group. In i, j, overall survival between groups was compared using two-sided log-rank tests, including all patients. Horizontal bars in a, b, c, f depict median values. Source data for bh are provided as a Source Data file.

References

    1. Osipov A, et al. Tumor mutational burden, toxicity, and response of immune checkpoint inhibitors targeting PD(L)1, CTLA-4, and combination: a meta-regression analysis. Clin. Cancer Res. 2020;26:4842–4851. doi: 10.1158/1078-0432.CCR-20-0458. - DOI - PMC - PubMed
    1. Tumeh PC, et al. PD-1 blockade induces responses by inhibiting adaptive immune resistance. Nature. 2014;515:568–571. doi: 10.1038/nature13954. - DOI - PMC - PubMed
    1. Spranger S, et al. Density of immunogenic antigens does not explain the presence or absence of the T-cell-inflamed tumor microenvironment in melanoma. Proc. Natl. Acad. Sci. USA. 2016;113:E7759–E7768. doi: 10.1073/pnas.1609376113. - DOI - PMC - PubMed
    1. Jerby-Arnon L, et al. A cancer cell program promotes T cell exclusion and resistance to checkpoint blockade. Cell. 2018;175:984–997.e924. doi: 10.1016/j.cell.2018.09.006. - DOI - PMC - PubMed
    1. Jiang P, et al. Signatures of T cell dysfunction and exclusion predict cancer immunotherapy response. Nat. Med. 2018;24:1550–1558. doi: 10.1038/s41591-018-0136-1. - DOI - PMC - PubMed

Publication types

Substances